Biology of Marine Birds - Chapter 13 pptx
Bạn đang xem bản rút gọn của tài liệu. Xem và tải ngay bản đầy đủ của tài liệu tại đây (508.5 KB, 28 trang )
439
Chick Growth and
Development in Seabirds
G. Henk Visser
CONTENTS
13.1 Introduction 439
13.2 Growth Patterns of Seabird Chicks in Relation to Taxon and Parental Feeding
Strategy 442
13.2.1 Interspecific Variation in Growth Rates 442
13.2.2 Intraspecific Variation in Growth Rates 443
13.3 Energetics of Growth 444
13.3.1 Introduction 444
13.3.2 Components of the Chicks’ Energy Budget 444
13.3.3 Methods to Determine Energy Budgets in Free-Living Chicks 446
13.3.3.1 Periodic Chick Weighing 446
13.3.3.2 The Time-Energy Budget 447
13.3.3.3 The Measurement of Water Influx Rates and Subsequent Conversion
to Energy Intake 450
13.3.3.3.1 The Doubly Labeled Water Method: Some General
Principles 450
13.3.3.3.2 Applications of the DLW Method in Adult Seabirds: The
Need for Standardization 451
13.3.3.3.3 Applications of the DLW Method in Seabird Chicks 452
13.3.4 Energy Budgets of Growing Seabird Chicks: The Importance of Asymptotic
Body Mass, Duration of the Nestling Period, and Latitude 452
13.4 Development of Temperature Regulation 455
13.5 Physiological Effects of Food Restriction 457
13.6 Toward the Construction of Energy Budgets of Entire Family Units during the Peak
Demand of the Brood 458
Acknowledgments 459
Literature Cited 459
13.1 INTRODUCTION
Chicks of most seabird species grow up on land situated in close proximity to the sea. It is presumed
that the nature of their food supply has not allowed the evolution of the self-feeding precocial mode
of development in seabirds (Lack 1968). Although there are marked interspecific differences with
respect to developmental mode, in the majority of seabird species, chicks stay in or close to their
nest until fledging, being parentally fed and brooded. For example, chicks of pelicans, frigatebirds,
gannets, and boobies are born naked with their eyes closed, being totally dependent on parental
food and warmth (Figure 13.1). Chicks that hatch in this developmental state have been classified
13
© 2002 by CRC Press LLC
440 Biology of Marine Birds
as being altricial by Nice (1962; see Table 13.1). Chicks of tropicbirds (Figure 13.2) hatch with
their eyes closed, but are covered in down (being classified as being semialtricial-2; Nice 1962),
whereas tern, auk, murre, and jaeger chicks hatch with a downy plumage with their eyes open, and
are able to walk (semiprecocial: Figure 13.3). In contrast, chicks of some murrelet species (Synth-
liboramphus spp. and Brachyrhamphus spp.) leave the nest shortly after hatching, being fed at sea
by their parent (precocial-4; Nice 1962, Eppley 1984, Gaston 1992, Starck and Ricklefs 1998a).
Chicks of Common Murre (Uria aalge), Thick-billed Murre (Uria lomvia), and Razor-billed Auk
(Alca torda) do so after having attained about 25% of adult body mass (Daan and Tinbergen 1979,
Gaston 1985, Starck and Ricklefs 1998a). Obviously, early nest desertion by the chick potentially
reduces parental traveling time and enables exploitation of remote feeding areas (Ydenberg 1989).
However, this strategy can only be achieved with the co-evolution of some specific physiological
adaptations of the chick to minimize and compensate for its heat loss (e.g., Eppley 1984).
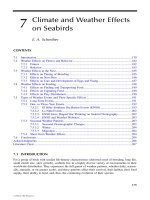
FIGURE 13.1 A newly hatched altricial Lesser Frigatebird chick (Fregata ariel). (Photo by R. W. and E. A.
Schreiber.)
TABLE 13.1
Criteria for Classification of Neonates
Type of
Neonate Plumage Eyes
Nest
Attendance
Parental
Brooding
Parental
Feeding
Precocial-1 Contour feathers Open Leave nest None None
Precocial-2 Down Open Leave nest Yes None
Precocial-3 Down Open Leave nest Yes Showing food
Precocial-4 Down Open Leave nest Yes Yes
Semiprecocial Down Open Around nest Yes Yes
Semialtricial-1 Down Open In nest Yes Yes
Semialtricial-2 Down Closed In nest Yes Yes
Altricial None Closed In nest Yes Yes
From Nice 1962.
© 2002 by CRC Press LLC
Chick Growth and Development in Seabirds 441
Seabirds have developed different feeding strategies, ranging from in-shore feeding to off-shore
feeding (see Chapter 6). In species that feed in-shore (e.g., some pelicans, cormorants, gulls, and
some terns), the chick can be fed several times a day and one parent can remain at the nest to
brood it. This foraging mode may not necessitate chicks developing homeothermy at an early age
(Klaassen 1994). Small seabird chicks frequently receive food as whole particles, such as fish (e.g.,
in most tern species), or as a predigested food mash (e.g., in young chicks of the Black-legged
Kittiwake [Rissa tridactyla], cormorants, boobies). In pelagic seabirds (e.g., albatrosses, petrels,
fulmars, boobies, and some terns), however, due to the long travel distances to their food source,
parents are often gone for one or more days on a foraging trip. Therefore, until the achievement
of homeothermy by the chick, feeding rates of the chick may be somewhat reduced over those of
near-shore feeding birds. After the chick(s) achievement of homeothermy, both parents can leave
the nest, potentially resulting in a doubling of the amount of food brought to the brood (Ricklefs
and Roby 1983). While foraging, most pelagic seabirds store the food in their stomach to carry it
back to the colony, although a few species carry fish in the bill (e.g., White Terns, Gygis alba;
puffins). Procellariiform birds are unique in the sense that parents partly concentrate the food caught
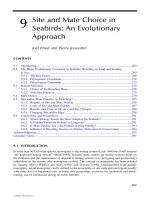
FIGURE 13.2 A 1-day-old Red-tailed Tropicbird chick. They are the only Pelecaniform chicks to hatch with
a full coat of down. (Photo by E. A. Schreiber.)
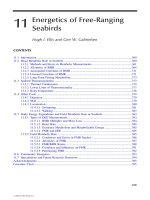
FIGURE 13.3 A Sooty Tern chick hatches with its eyes open and able to walk. The down on this just-hatched
chick has not dried out yet. (Photo by E. A. Schreiber.)
© 2002 by CRC Press LLC
442 Biology of Marine Birds
into stomach oil. This substance mainly consists of wax esters with a very high energy density,
and stomach oil formation has been interpreted as a strategy to increase the amount of energy per
feeding trip (Ricklefs et al. 1985, Roby 1991, Roby et al. 1997). This physiological development
has enabled procellariiform birds to exploit more remote feeding areas.
Recent reviews in the literature include growth patterns of birds in general (Starck and Ricklefs
1998b), developmental plasticity (Schew and Ricklefs 1998), energy budgets during growth (Weath-
ers 1992, 1996), and development of temperature regulation (Visser 1998). It is the aim of this
chapter to partly update the information presented in these reviews with special emphasis on seabird
chicks. In addition, current knowledge of several aspects of postnatal development on seabird chicks
is integrated into the text to provide insight into patterns of evolutionary and geographical diver-
sification. Some recent methodological developments are evaluated in an attempt to provide guide-
lines for the standardization of future work on the construction of energy budgets in seabird chicks
and adults.
13.2 GROWTH PATTERNS OF SEABIRD CHICKS IN RELATION TO
TAXON AND PARENTAL FEEDING STRATEGY
13.2.1 I
NTERSPECIFIC VARIATION IN GROWTH RATES
Starck and Ricklefs (1998b) present growth parameter estimates based on logistic growth curves
for a mixed data set of altricial and precocial land and seabird species (n = 557 species). The
logistic growth curve, which has a sigmoid shape, enables the description of the development of
body masses (M, g) of chicks as a function of age (t, d):
M = A/(1 + exp(–k
l
(t – t
i
))) (13.1)
where A represents the asymptotic body mass of chicks (g), t
i
the time of inflection point of the
curve (d), and k
l
the logistic growth rate constant (d
–1
). For the seabird subset (Figure 13.4),
FIGURE 13.4 Relationship between the logistic growth constant (k
l
, d
–1
) and asymptotic body mass (A, g)
in seabird chicks. Drawn diagonal line represents the general relationship between A and k
l
in birds (Equation
13.2 of this chapter, Starck and Ricklefs 1998b).
© 2002 by CRC Press LLC
Chick Growth and Development in Seabirds 443
asymptotic body masses range between 38.5 g for the Least Tern (Sterna antillarum, Schew 1990)
and 15,500 g for the Emperor Penguin (Aptenodytes forsteri, Stonehouse 1953), and the logistic
growth constants range between 0.019 d
–1
for the Amsterdam Albatross (Diomedea amsterdamensis,
Jouventin et al. 1989) and 0.38 d
–1
for the fastest growing species, the Black Tern (Chlidonias
niger, Schew 1990). Assuming independence of the data points for all 557 species, the relationship
between both parameters was described by:
k
l
= 0.962A
–0.31
(13.2)
(Figure 13.4; Starck and Ricklefs 1998b). Equation 13.2 was used to predict k
l
for each seabird
species listed by Starck and Ricklefs (1998b). Next, its residual value was calculated with the
general equation:
Residual value = 100 · (observed value – predicted value)/predicted value (13.3)
The analysis revealed that, after correction for differences in asymptotic body masses, most
seabird families exhibit relatively low growth rate constants, which is particularly the case for the
Fregatidae (average level relative to prediction: –58.0%, which differs significantly from zero, after
comparison of the standard error of the residuals, t
3
= –14.4; p <0.001), Hydrobatidae (–56.9%; t
4
= –19.0; p <0.0001), Diomedeidae (–28.3%; t
9
= –2.81; p <0.02), Phaethontidae (–4.2%; t
2
= –6.1;
p <0.03), and Procellariidae (–20.9%; t
17
= –3.0; p <0.01). In the Spheniscidae, average relative
growth rates were significantly above prediction (+32%; t
10
= 2.5; p <0.03); and in the Sulidae
(+2.9%; t
4
= 0.18; p = 0.86), Alcidae (+6.9%; t
11
= 1.0; p = 0.33), and Laridae (+8.2%; t
31
= 1.4;
p = 0.16), residual values were higher than prediction, but these differences were not significant.
These values indicate that growth rates are particularly low for many pelagic seabird species, and
tend to be higher in species that feed in-shore such as the Laridae. Highest relative growth rates
are observed in the Spheniscidae. This has been interpreted to be an adaptation to the short Antarctic
summer enabling the chicks to leave the colony before the onset of the winter (Volkman and
Trivelpiece 1980). In Section 13.3.4 we explore the energetic consequences of variations in growth
rate for free-living chicks and their parents.
13.2.2 INTRASPECIFIC VARIATION IN GROWTH RATES
Chicks of most seabird species are generally fed a high-quality diet rich in protein and energy,
with the possible exception of chicks of some petrel and albatross species that are mainly fed squid
with a relatively low energy content (Prince and Ricketts 1981, see also Section 13.3.2). However,
the quantity of food delivered by parents can be less predictable (see Chapters 6 and 7). In some
species there is tremendous variation in postnatal growth rates owing to changes in the available
food supply. For example, residual values for the logistic growth constants of Wedge-tailed Shear-
waters (Puffinus pacificus) range between –72 and –9% (n = 13 studies), Black-legged Kittiwakes
between –6 and +52%, Common Terns (Sterna hirundo) between –27 and + 74% (n = 21 studies),
and Atlantic Puffins (Fratercula arctica) between –45 and +22% (n = 27 studies). In addition, these
four species exhibit marked intraspecific differences in calculated asymptotic body mass values
which vary between 424 and 750 g, 335 and 421 g, 100 and 133 g, and 265 and 400 g, respectively.
These large differences may reflect differences in body condition of the fledglings at this stage.
There is considerable evidence that growth retardation results from reduced food availability.
For example, in a year with poor food availability, parental foraging trips of the Magellanic Penguin
(Spheniscus magellanicus) lasted 20% longer than normal, chick feeding rates were reduced, and
average body mass in 5-day-old chicks was 30% lower than in years with normal food availability
(Boersma et al. 1990). Consequently, there were large differences between years with respect to
the number of chicks fledged per nest, and in a 5-year study values ranged from 0.02 chicks per
© 2002 by CRC Press LLC
444 Biology of Marine Birds
nest to 0.60 (Boersma et al. 1990). In some cases, variation in food availability is related to El
Niño–Southern Oscillation (ENSO) events (e.g., Schreiber and Schreiber 1993, Schreiber 1994).
In other cases, intraspecific variations in chick growth and nesting success have been attributed to
individual differences in timing of egg laying within a particular year (Brooke 1986, Catry et al.
1998), age and breeding experience of the parents (Brooke 1986, Coulson and Porter 1985),
individual quality, genetically determined (Brooke 1986), weather conditions (especially wind
speed; Konarzewski and Taylor 1989), differences in food availability between colonies within a
season (Frank 1992, Frank and Becker 1992), and between years (Boersma et al. 1990, Danchin
1992, Crawford and Dyer 1995). One of the key parameters for the interpretation of inter- and
intraspecific variations in growth rates in seabird chicks seems to be the amount of energy collected
by parents during chick rearing per unit of energy spent (see Section 13.6).
On the longer term, food restrictions and the subsequent growth retardation can potentially
result in reduced survival (e.g., in the Common Murre, Harris et al. 1992), tolerance to starvation
(e.g., in the Lesser Black-backed Gull [Larus fuscus], Griffiths 1992), and reduced recruitment rate
(e.g., in the Black-legged Kittiwake, Coulson and Porter 1985).
13.3 ENERGETICS OF GROWTH
13.3.1 I
NTRODUCTION
One of the key factors needed for interpreting seabird life histories is the construction of energy
budgets of free-living chicks and their parents (Drent et al. 1992). It is assumed that during the
evolution of avian life histories, chicks have developed an array of adaptive responses, for instance:
1. In single-chick broods, the total amount of food required until independence (TME, kJ).
However, in multi-chick broods, sibling competition may select for rapid growth and
active food solicitation, potentially resulting in an increase of the TME.
2. Peak level of daily metabolized energy (peak-DME, kJ d
–1
).
3. Duration of the growth period (t
fl
, d) in order to reduce the risk of predation (Lack 1968),
and (in polar environments) to complete the reproductive cycle before the onset of winter
(Obst and Nagy 1993).
It has to be noted that minimizing the duration of the development period may require increasing
growth rate and therefore daily energy requirement (Weathers 1992, and Section 13.3.4). These
adaptations may enable parents to maximize their lifetime reproductive output.
13.3.2 COMPONENTS OF THE CHICKS’ ENERGY BUDGET
Of all energy ingested by a chick (gross energy intake: GEI, kJ d
–1
) only a part can be metabolized
(metabolizable energy intake: MEI, kJ d
–1
); the remainder is excreted in the form of feces and urine
(FU, kJ d
–1
). The assimilation coefficient (Q, dimensionless) is defined as:
Q = (GEI – FU)/GEI (13.4)
Once gross energy intake and assimilation coefficient are known, metabolizable energy intake can
be calculated by
MEI = Q · GEI (13.5)
The gross energy content of chick food varies with the type of diet, and is reported to be about
2.9 to 4.5 kJ g
–1
fresh mass for krill (depending on its reproductive status; Clarke and Prince 1980,
© 2002 by CRC Press LLC
Chick Growth and Development in Seabirds 445
Davis et al. 1989), 2.9 to 4.9 kJ g
–1
for zooplankton (Clarke and Prince 1980, Montevecchi et al.
1984, Simons and Whittow 1984, Clarke et al. 1985), 4.2 to 10.3 kJ g
–1
for fish (depending on its
fat content; Montevecchi et al. 1984), and 39 to 41.7 kJ g
–1
for the oil component of procellariiform
diets (Warham et al. 1976, Simons and Whittow 1984, Obst and Nagy 1993). Some seabird species
are known for having highly specialized diets (e.g., feeding exclusively on fish [terns] or krill [some
penguins]), whereas other species (like most Procellariiformes) exhibit a nonspecialized aquatic
diet (squid and other zooplankton, krill, fish, and trawler offal).
Assimilation coefficients have been determined in seabird chicks of several species and for
different diets (Table 13.2). Average values for fish, krill, and zooplankton diets are 0.80 (SD =
0.035, n = 10), 0.75 (SD = 0.014, n = 2), and 0.75 (SD = 0.040, n = 3), respectively. It is interesting
to note that the measured values in chicks are in close agreement with those reported for adult
birds fed fish or invertebrates (0.77 and 0.74, respectively; Castro et al. 1989), which suggests that
digestion efficiency in seabird chicks is high. Little information is available on the development of
the assimilation efficiency as a function of the chicks’ ages. An increase in assimilation coefficient
from 0.8 at 11 to 12 days of age to a value of 0.88 at 20 to 21 days of age was reported in Double-
crested Cormorant (Hypoleucos auritus) chicks (Dunn 1975). A similar trend with age was found
in Jackass Penguin (Spheniscus demersus) chicks (Heath and Randall 1985), but not in chicks of
the Cape Gannet (Morus capensis, Cooper 1978) and Common and Sandwich Tern (Sterna sand-
vicensis, Klaassen et al. 1992).
TABLE 13.2
Assimilation Coefficients for Seabird Chicks in Relation to Food Type
Family/Species Food Type Coefficient Source
Spheniscidae
Jackass Penguin (Spheniscus demersus) Fish 0.76 Cooper 1978
Jackass Penguin (S. demersus) Fish 0.83 Heath and Randall 1985
Jackass Penguin (S. demersus) Zooplankton 0.71 Heath and Randall 1985
Gentoo Penguin (Pygoscelis papua) Krill 0.74 Davis et al. 1989
Procellariidae
White-chinned Petrel (Procellaria aequinoctialis) Fish 0.78 Jackson 1986
White-chinned Petrel (P. aequinoctialis) Zooplankton 0.74 Jackson 1986
White-chinned Petrel (P. aequinoctialis) Krill 0.76 Jackson 1986
Sulidae
Cape Gannet (Morus capensis) Fish 0.74 Batchelor 1982
Cape Gannet (M. capensis) Fish 0.76 Cooper 1978
Phalacrocoracidae
Double-crested Cormorant (Hypoleucos auritus) Fish 0.85 Dunn 1975
Laridae
Common Tern (Sterna hirundo) Fish 0.81 Klaassen et al. 1992
Arctic Tern (S. paradisaea) Fish 0.80 Drent et al. 1992
Sandwich Tern (S. sandvicensis) Fish 0.82 Klaassen et al. 1992
Black-legged Kittiwake (Rissa tridactyla) Fish 0.80 Gabrielsen et al. 1992
Alcidae
Dovekie (Alle alle) Zooplankton 0.79 Taylor and Konarzewski 1992
Note: In chicks of some diving petrels, prions, and storm petrels, the digestion efficiencies of the dietary wax
component was near 0.99 (Roby et al. 1986).
© 2002 by CRC Press LLC
446 Biology of Marine Birds
It appears as if there are marked differences between species with respect to assimilation
efficiency as a function of diet type. For example, assimilation coefficients in White-chinned Petrel
(Procellaria aequinoctialis) chicks were relatively insensitive to diet type, and values ranged from
0.74 for a squid diet to 0.78 for a fish diet (Jackson 1986). In contrast, assimilation coefficients of
Jackass Penguin chicks varied from 0.68 and 0.87 for these two diets (Heath and Randall 1985).
The high flexibility of the digestive system of White-chinned Petrel chicks is interpreted to be an
adaptation to their nonspecialized diets (squid, krill, fish, and trawler offal; Jackson 1986; see also
Brown 1988).
Metabolized energy can be allocated to the following components of the chicks’ energy budget:
(1) resting metabolism at thermoneutrality (i.e., the energy required for maintaining some basal
physiological functions within the chicks’ body; RMR, units kJ d
–1
), (2) heat increment of feeding
(i.e., the energy required to warm and digest the food; HIF [also referred to as specific dynamic
action of food; SDA], units kJ d
–1
), (3) temperature regulation (to compensate for heat losses from
the chick to its environment: TR, units kJ d
–1
), (4) activity (e.g., walking, preening, calling, and
begging; A, units kJ d
–1
), (5) biosynthesis-related heat production (the energy required for synthe-
sizing new tissue such as fat and protein; S, units kJ d
–1
), and (6) tissue energy (energy deposited
as protein and fat; TE, units kJ d
–1
):
MEI = RMR + HIF + TR + A + S + TE (13.6)
At a given level of metabolizable energy intake of a chick (e.g., the maximum level that can be
provided by the parents), growth is highest at low levels of energy expenditure. Growth is zero if
MEI equals energy expenditure, and growth is negative if MEI is lower than the level of energy
expenditure. Under the latter conditions, body tissue (e.g., fat or protein) is used to produce energy
for supporting other physiological functions.
13.3.3 METHODS TO DETERMINE ENERGY BUDGETS IN FREE-LIVING CHICKS
Four different methods have been used to determine the chick’s level of MEI under free-living
conditions:
1. Determination of gross energy intake based on periodic weighing of the chick in the
field (e.g., Prince and Walton 1984, Ricklefs et al. 1985, Obst and Nagy 1993)
2. Determination of energy expenditure of the chick based on the extrapolation of laboratory
measurements to field conditions, with an added component for energy deposited in
tissues (see Ricklefs and White 1981)
3. Measurement of water influx rates and subsequent conversion to gross energy intake
(Gabrielsen et al. 1992, Konarzewski et al. 1993)
4. Measurement of the level of energy expenditure directly in the field with doubly labeled
water method, with an added component for growth energy (see Klaassen et al. 1989,
Klaassen 1994, Visser and Schekkerman 1999)
13.3.3.1 Periodic Chick Weighing
A method used frequently to assess levels of food intake in seabird chicks is based on periodic
chick weighing (expressed in grams per unit of time; e.g., Ricklefs 1984, Ricklefs et al. 1985,
Schreiber 1994, 1996, Philips and Hamer 2000). Chicks are weighed regularly (e.g., at 2- to 12-h
intervals) to monitor changes in their body mass. It is assumed that body mass decreases with time,
a process that can be approached mathematically (e.g., by taking initial body mass, age, body size
index, and time into account; Philips and Hamer 2000). If the chick exhibits a positive change in
body mass, it is assumed that it was fed exactly between two weighings. The food intake level at
© 2002 by CRC Press LLC
Chick Growth and Development in Seabirds 447
the assumed feeding time is calculated as the difference between backward and forward extrapo-
lation of the mass loss curves of a recently fed and fasting chick, respectively. The value obtained
represents the amount of food eaten by the chick (in grams per unit of time). Next, to convert this
value to gross energy intake (GEI), an assumption must be made with respect to the mass-specific
energy content of the food (see Section 13.3.2). Finally, MEI can be calculated on the basis of
Equation 13.5, after assuming a specific value for the assimilation coefficient of the diet (see Section
13.3.2 and Table 13.2).
Although this method is very easy to apply, it can only be used in chicks that are fed meals
that are heavy relative to their body mass. In addition, apart from weighing and extrapolation errors,
the calculated MEI level is subject to several other accumulating methodological errors. The first
potential error is caused by the uncertainty with respect to the exact feeding time. This error is
larger if weighings are done with a lower frequency. However, a high weighing frequency may, in
some cases, interfere with chick begging, or parental feeding behavior, although some species are
not bothered by it. In some sedentary seabird chicks, this problem can be circumvented by contin-
uous weighing on an electronic balance, as employed in albatross chicks (Prince and Walton 1984,
Huin et al. 2000).
The second potential error relates to the conversion of mass change to GEI. This error is
probably smallest in species with a specialized diet, facilitating accurate estimation of the mass-
specific energy content of the diet. The error is probably largest in procellariiform chicks because
of the large difference in energy density of separate components of their diet, which ranges from
about 4 kJ g
–1
for predigested food to about 40 kJ g
–1
for the stomach-oil component (see Section
13.3.2). Another complication is the large variation in the relative quantity of the oil component
between meals within a species (e.g., values determined for different birds from the same colony
during one observation day ranged between 20 and 83% in Wilson’s Storm-Petrel [Oceanites
oceanicus]; Obst and Nagy 1993), between species (e.g., see Roby 1991), and the relative difficulty
to estimate the fraction of the oil component in a chick’s diet (Roby et al. 1997).
The third potential error of this method is the conversion of GEI to MEI (Equation 13.5), after
assuming a specific value for the assimilation coefficient. As discussed in Section 13.3.2, these
average values range from 0.77 for krill and zooplankton to about 0.99 for stomach oil (Roby et
al. 1986). Because of its high mass-specific gross energy content and its high assimilation coeffi-
cient, stomach oil is the most important component in energy budgets of procellariiform chicks,
and it may contribute up to about 80% of their energy budgets (Roby 1991, Obst and Nagy 1993).
The overall error of using the “chick weighing” method to estimate MEI can be as high as about
25%, depending on the number of assumptions made (Weathers 1992, 1996).
13.3.3.2 The Time-Energy Budget
The “time energy budget” method differs fundamentally from the “chick weighing” method in the
sense that in the former method, metabolizable energy intake is estimated on the basis of measure-
ments on energy expenditure (the components RMR, HIF, TR, A, and S; Equation 13.6) with an
added component of the tissue energy (TE; Equation 13.6). As a first step, levels of oxygen
consumption (and carbon dioxide production) are determined in resting chicks while housed in a
small respiration chamber (indirect calorimetry; Weathers 1996). Next, metabolic rate (MR) can
be calculated after assuming a specific energy equivalent per unit oxygen consumed or carbon
dioxide produced. Typically, levels of energy expenditure are determined at different ambient
temperatures to reveal the lowest level of energy expenditure at thermoneutrality (RMR), and the
thermoregulatory costs (TR) at temperatures below the lower critical temperature (LCT, units °C).
At each temperature, thermal conductance can be calculated being the metabolic level per degree
temperature difference between the chick’s body and its environment (see Visser 1998). The thermal
conductance is assumed to be minimal at ambient temperatures below LCT.
© 2002 by CRC Press LLC
448 Biology of Marine Birds
To facilitate extrapolation of laboratory measurements to field conditions, the thermal environ-
ment of a chick must be characterized in its habitat (Bakken 1976, Klaassen 1994). This is most
easily accomplished in chicks that live in deep burrows (e.g., procellariiform chicks, by measuring
burrow-air temperatures), and it is most difficult in mobile chicks that live in sparsely vegetated
colonies. When fully exposed, a chick experiences cooling effects of wind, compensated for by the
chick elevating its metabolism. These effects can be strongly diminished by the chick positioning
itself in vegetation (i.e., an energy-saving mechanism). In contrast, when fully exposed, a chick
may experience the heating effects of solar radiation (enabling the chick to reduce thermoregulatory
costs). Both effects can be integrated when employing heated taxidermic mounts, or (partly) with
temperature measurements using black spheres (Gabrielsen et al. 1992, Klaassen 1994).
To estimate the tissue energy component of the energy budget in relation to the chicks’ age, it
is necessary to determine their growth curve in the field (see Section 13.2.1), as well as their mass-
specific energy content of the body. The latter component is often estimated with the general
equation:
E = a + b · (M/A) (13.7)
where E represents the mass-specific energy density of the whole body (kJ g
–1
); a the intercept
value at zero body mass (g); b the slope of the relationship; M the body mass (g) of the chick at
a particular stage; and A its asymptotic body mass (g; Ricklefs 1974, Weathers 1996). The mass-
specific energy density increases from about 3 to 4 kJ g
–1
in young Double-crested Cormorant
chicks (Ricklefs 1974) to about 22 kJ g
–1
in heavy Wilson’s Storm-Petrel chicks 1 week prior to
fledging (Obst and Nagy 1993). For some species-specific estimates, see Table 13.3 (Note: a steeper
slope indicates that as birds get heavier, they have a higher energy density per gram of body mass).
As can be seen, seabirds exhibit large differences in developmental patterns, and energy
densities are particularly high in some pelagic seabird species (Ricklefs et al. 1980, Obst and Nagy
1993, Ricklefs and Schew 1994). Therefore, the use of group-specific estimates of the regressions
to estimate energy accumulation is suggested, instead of the use of Weathers’ (1996) Equation
13.10 for birds in general. To estimate the biosynthesis-related heat production in chicks, a synthesis
efficiency value of 0.75 has traditionally been assumed (Ricklefs 1974), which has been used for
the construction of energy budgets of most species listed in Table 13.3. More recently, Weathers
(1996) advocated the separation of tissue growth into a fat component (with high synthesis effi-
ciency) and a protein component (with low synthesis efficiency). Although this approach is more
correct, it appears as if little error is made when employing a value of 0.75 (Konarzewski 1994,
Ricklefs et al. 1998).
There are a number of potential methodological errors involved in this time energy budget
method that merit attention. First, it is virtually impossible to account for the costs associated with
locomotion or activity of the chick (e.g., see Dunn 1980). Probably these costs are lowest in
individual procellariiform chicks that spend “about 90% of their time resting and sleeping” (Simons
and Whittow 1984, Brown 1988), but the costs can be much higher for chicks growing up in dense
colonies where frequent social interactions occur (Figure 13.5). Second, the extrapolation of
laboratory measurements to field conditions for estimating the costs for temperature regulation is
relatively difficult, especially because of the difficulty in accounting quantitatively for energy-saving
mechanisms such as huddling, sheltering, or exposure to solar radiation. Third, poikilothermic
chicks are frequently brooded by a parent, which considerably reduces its energy expenditure level
(Klaassen 1994). Fourth, the extrapolation procedure is very sensitive to the assumed body tem-
perature of the chick under field conditions. Although chicks of most species tend to keep up a
body temperature of about 40°C, chicks of some species enter into torpor periodically between
feeding bouts (Pettit et al. 1982, Boersma 1986). Occurrence of torpor has been interpreted to be
an energy-saving mechanism to minimize costs of temperature regulation.
© 2002 by CRC Press LLC
Chick Growth and Development in Seabirds 449
Some of the aforementioned difficulties with the extrapolation of laboratory-based measure-
ments to field conditions also apply to adult birds. However, the energetic importance of energy-
saving mechanisms in chicks is magnified because (1) chicks exhibit a larger surface area per unit
body mass than adults, and (2) per unit of body surface, minimal thermal conductances are higher
in chicks than in adults (Visser 1998). The average error of the time-energy budget method has
been estimated to be on the order of 25% (Weathers 1992).
TABLE 13.3
Development of the Mass-Specific Energy Content of Chicks during Growth
of Some Seabird Species
Family/Species
Intercept
(a)
Slope
(b) Source
Spheniscidae
Gentoo Penguin (Pygoscelis papua) 3.26 7.57 Myrcha and Kaminski 1982
Chinstrap Penguin (P. antarctica) 3.18 7.08 Myrcha and Kaminski 1982
Pelecanoididae
Georgian Diving-Petrel (Pelecanoides georgicus) 4.28 5.11 Roby 1991
Hydrobatidae
Wilson’s Storm-Petrel (Oceanites oceanicus) 7.55 12.26 Obst and Nagy 1993
Phalacrocoracidae
Double-crested Cormorant (Hypoleucos auritus) 2.97 6.40 Ricklefs 1974
Laridae
Common Tern (Sterna hirundo) 3.86 4.94 Drent et al. 1992
Sandwich Tern (S. sandvicensis) 3.97 4.68 Drent et al. 1992
Arctic Tern (S. paradisaea) 4.13 3.73 Drent et al. 1992
Black-legged Kittiwake (Rissa tridactyla) 4.24 4.51 Gabrielsen et al. 1992
Alcidae
Least Auklet (Aethia pusilla) 3.69 5.04 Roby 1991
Note: Model used E = a + b · (M/A), where E represents the mass-specific energy density of the body
(kJ g
–1
), M the actual body mass of the chick (g), and A the asymptotic or fledging body mass (g).
FIGURE 13.5 In a colony of Sooty Terns, nests are very close together. Here adult and large chicks are
constantly interacting, possibly raising the energy budget of birds in these colonies. (Photo by R. W. Schreiber.)
© 2002 by CRC Press LLC
450 Biology of Marine Birds
13.3.3.3 The Measurement of Water Influx Rates and Subsequent Conversion
to Energy Intake
Apart from metabolic water formation, food is the only other water source for most seabird chicks
(Gabrielsen et al. 1992, Konarzewski et al. 1993). Water fluxes can be measured in free-living
chicks following labeling with a heavy hydrogen isotope (i.e., water enriched with respect to
2
H
or
3
H). Its concentration decreases in relation to the water-influx level (Nagy and Costa 1980) and
can be measured on the basis of small blood samples (see Section 13.3.3.4). Food-water intake can
be calculated after correction for metabolic water formation (Gabrielsen et al. 1992, Konarzewski
et al. 1993). Finally, the amount of food eaten (in g) can be calculated after assuming a specific
water percentage in the chicks’ diet. This method has been validated in chicks of the Black-legged
Kittiwake (Gabrielsen et al. 1992) by comparing the quantity of gross energy provided to chicks
with concomitant determination of water influx with stable isotopes. On average, the validation
revealed an excellent agreement of both methods (the isotope method tended to underestimate the
true GEI level by only 2%). However, determinations on individual birds could differ by 34% at
maximum, which suggests that a considerable sample size is required for the construction of energy
budgets. The most critical steps of this method seem to be the estimation of the amount of metabolic-
water formation, and the conversion of water fluxes to levels of food intake, the latter conversion
being very sensitive to the hydration level of the food (plus attached water). The method cannot
be applied in chicks that have access to other sources of water.
13.3.3.3.1 The Doubly Labeled Water Method: Some General Principles
The doubly labeled water (DLW) method has frequently been used to measure the rate of energy
expenditure of adult and young seabirds under free-living conditions. Its principle is based on
labeling the bird’s body water pool with the heavy isotopes
2
H and
18
O, and the subsequent
determination of their fractional turnover rates (k
d
and k
o
, respectively, units d
–1
; Lifson and
McClintock 1966, Nagy 1980, Speakman 1997, Visser et al. 2000a). In the past, the radioactive
isotope
3
H has also been used instead of the stable
2
H isotope, but due to permit restrictions,
nowadays most DLW experiments on free-living seabirds are performed with
2
H. It is assumed
that, following labeling,
2
H leaves from the body water pool as water only, and
18
O both as water
and as carbon dioxide. Thus, the difference between
18
O and
2
H can be converted to a rate of carbon
dioxide production (rCO
2
, moles d
–1
):
rCO
2
= N/2 · (k
o
– k
d
) (13.8)
where N represents the size of the body-water pool (moles), which can be determined on the basis
of isotope dilution (Speakman 1997). The rate of carbon dioxide production can subsequently be
converted to a level of energy expenditure, after assuming a diet-specific energy equivalent of
carbon dioxide. For example, for seabird species with diets rich in proteins, it can be assumed that
the production of 1 l of carbon-dioxide per hour is equivalent to a level of energy expenditure of
27.3 kJ h
–1
(see Gessaman and Nagy 1988).
Concentrations of the heavy isotopes
2
H and
18
O in the body-water pool of animals are often
determined on the basis of three blood samples, stored in flame-sealed capillaries or vacutainers.
The first sample is taken prior to administration of the dose, to determine the natural abundance
of both heavy isotopes in the bird’s body-water pool (typically 0.015 and 0.20 atom percent for
2
H
and
18
O, respectively). The second sample is taken after equilibration of the pulse dose (often
referred to as “initial blood sample”), and the animal can be released. It needs to be recaptured
after 24 to 72 h to take the third blood sample (often referred to as “final blood sample”) to determine
the isotope concentrations at the end of the measurement period. Thus, the calculated rate of CO
2
production is related to the level of energy expenditure by the bird between the taking of the “initial”
and “final” blood sample.
© 2002 by CRC Press LLC
Chick Growth and Development in Seabirds 451
Another important assumption of the DLW method for its application in seabirds is that the
heavy
2
H and
18
O isotopes in the water molecule exhibit the same physical kinetics as the normal
1
H and
16
O isotopes (Lifson and McClintock 1966, Speakman 1997). This is true with respect to
fecal and urine water loss (Lifson and McClintock 1966, Visser et al. 2000b), but not with respect
to evaporative water loss: water molecules with the heavy
2
H or
18
O are less likely to evaporate
than those with the lighter isotopes
1
H or
16
O. This process is called fractionation. As a result, the
estimated fractional turnover rates of both isotopes (based on samples of the body-water pool) are
too low. Theoretically, this fractionation effect also affects the calculation of water fluxes based on
determinations of
2
H turnover (see Section 13.3.3.3), but an error analysis has revealed that a
maximum error of about 1% is made if a fractional evaporative water loss value of 0.25 is used
(Visser et al. 2000b). In contrast, the DLW method to estimate the rate of CO
2
production is much
more sensitive to the effects of fractionation. Because this fractionation effect is larger for the
2
H
isotope than for the
18
O isotope, this process also affects the difference between the
18
O and
2
H
turnover rate (i.e., the calculated level of CO
2
production). Therefore, to solve this fractionation
issue mathematically, the water efflux is considered to consist of one route subject to fractionation
(i.e., evaporative water loss), and another route not subject to fractionation (i.e., fecal and urine
water loss). After taking this effect into account, in combination with fractionation of the
18
O isotope
in the CO
2
molecule (Speakman 1997), Equation 13.8 can be rewritten as:
rCO
2
= N/2.078 · (k
o
– k
d
)– (r
G
· 0.0249 · N · k
d
) (13.9)
where r
G
(dimensionless) represents the fraction of the water efflux lost through evaporative
pathways.
13.3.3.3.2 Applications of the DLW Method in Adult Seabirds: The Need for
Standardization
After having collected and analyzed blood samples to determine N, k
o
, and k
d
, we only need to
estimate r
G
in order to calculate the rate of carbon-dioxide production (Equation 13.9). After
studying small mammals in the laboratory, Lifson and McClintock (1966) assumed that an r
G
value
of 0.5 was appropriate (i.e., 50% of the total water efflux is lost through evaporative pathways).
This value has been used for many terrestrial and aquatic species (see Speakman 1997). However,
for other seabird species, rates of carbon dioxide production were calculated with Equation 13.8,
thereby assuming that fractionation did not play a role (e.g., Nagy 1980). Speakman (1997)
recognized the fact that in many free-living species, the assumption of a fractional evaporative
water loss value of 0.5 was too high, and he proposed to use a value of 0.25 to be applied in
Equation 13.9.
To illustrate the importance of assumptions concerning fractional evaporative water loss in
adult seabirds, the levels of energy expenditure in adult Black-legged Kittiwakes were calculated
at two different types of behavior. In both cases fractional
2
H and
18
O turnover rates were measured
based on small blood samples. If the bird was foraging to feed its young, the rate of water efflux
was high (about 450 g d
–1
), and the calculated level of energy expenditure using Equation 13.8 was
1654 kJ d
–1
. However, if Equation 13.9 were applied with the same
2
H and
18
O turnover rates, but
after assuming that (1) fractional evaporative water loss was zero (r
G
= 0), (2) fractional evaporative
water loss was 0.25, and (3) fractional evaporative water loss was 0.5, calculated levels of energy
expenditure were 1584 kJ d
–1
, 1487 kJ d
–1
, and 1389 kJ d
–1
, respectively. This indicates that at high
water fluxes, the DLW method is very sensitive to the assumptions made, and calculated rates of
energy expenditure could differ by about 19%. In contrast, during incubation, water efflux was
much lower (about 55 g d
–1
), and the maximum difference in calculated levels of energy expenditure
was only 9%. This clearly indicates that the DLW method needs to be validated in adult seabirds
under different feeding conditions. Pending these results, the author proposes the use of Equation
13.9 in adult seabirds, with a fractional evaporative water loss value of 0.25.
© 2002 by CRC Press LLC
452 Biology of Marine Birds
13.3.3.3.3 Applications of the DLW Method in Seabird Chicks
Application of the DLW method in growing chicks has been hampered by uncertainties with respect
to the routes of
2
H (or
3
H) and
18
O loss from the chick’s body-water pool. Both isotopes may not
leave from the body-water pool exclusively as water (
2
H) or as water and carbon-dioxide gas (
18
O),
but they may also be incorporated in growing tissues (Williams and Nagy 1985, Weathers and
Sullivan 1991). Differential rates of isotope incorporation could potentially result in an underesti-
mation of the true rate of CO
2
production in the order of 10 to 25%.
In only two seabird species, the Arctic Tern (Sterna paradisaea; Klaassen et al. 1989) and
Kittiwake (Gabrielsen et al. 1992), has the DLW method been validated to estimate the rate of CO
2
production in growing chicks. After assuming a fractional evaporative water loss value of 0.5, it
was found that the DLW method underestimated the “true” rate of CO
2
production by about 10%
on average (Klaassen et al. 1989), which suggests that differential rates of isotope incorporation
did play a role. However, at a later stage it was demonstrated that the error of the DLW method
could be significantly reduced after assuming a fractional evaporative water loss value of 0.25
(Visser and Schekkerman 1999). This value was also found to yield the best results in growing
shorebird chicks (i.e., Northern Lapwing [Vanellus vanellus] and Black-tailed Godwit [Limosa
limosa], both belonging to the Charadriiformes; Visser and Schekkerman 1999) and Japanese Quail
(Coturnix c. japonica; Visser et al. 2000a). Therefore, to calculate energy expenditure in growing
seabird chicks, the author recommends the use of Equation 13.9, with a fractional evaporative water
loss value of 0.25. Because meals are often rich in fat and proteins, an energy equivalent of 27.33
kJ should be used per liter CO
2
produced (Gessaman and Nagy 1988). Unfortunately, in the past,
little effort has been made to standardize this conversion, and in many studies a lower value has
been employed.
As a last step in the construction of an energy budget, the level of metabolizable energy intake
of a chick is calculated from its level of energy expenditure (as measured with DLW) plus an added
component of tissue growth (see above). Of all methods described here, the DLW method is assumed
to be the most accurate (Weathers 1992, 1996).
13.3.4 ENERGY BUDGETS OF GROWING SEABIRD CHICKS: THE IMPORTANCE
OF
ASYMPTOTIC BODY MASS, DURATION OF THE NESTLING PERIOD,
AND LATITUDE
Weathers (1992, 1996) identified two important components of energy budgets of chicks: (1) the
total amount of energy metabolized until fledging (TME, kJ) and (2) the peak level of daily
metabolized energy during the growth period (peak-DME, kJ d
–1
). His analysis for birds in general
revealed significant effects of body mass at fledging (M, g) and the duration of the fledging period
(t
fl
, d) on the TME level
TME = 6.65 M
0.852
· t
fl
0.710
(13.10)
and also on the peak-DME level
peak-DME = 11.69 M
0.9082
· t
fl
–0.428
(13.11)
In other words, TME is highest in chicks with a high asymptotic body mass and a long nestling
period, and peak-DME is highest in chicks with a high asymptotic body mass, but with a short
nestling period. A compilation was made of published energy budgets of seabird chicks (Table
13.4). The analysis concentrated on the following questions: (1) Do energy budgets for seabird
chicks differ from patterns observed for birds in general? and (2) Are there other factors than
asymptotic body mass and duration of the fledging period that can explain variation in TME and
peak-DME?
© 2002 by CRC Press LLC
Chick Growth and Development in Seabirds 453
TABLE 13.4
Energy Budgets of Seabird Chicks
Species
A
(g)
T
fl
(d)
TME
(kJ)
Peak-DME
(kJ d
–1
)
Latitude
(deg) Source
Northern Gannet (Morus bassanus) 3700 91 144990 2760 48 Montevecchi et al. 1984
Cape Gannet (M. capensis) 3240 97 200346 2758 34 Cooper 1978
Double-crested Cormorant (Hypoleucos auritus) 1900 46 59517 1987 43 Dunn 1975
Herring Gull (Larus argentatus) 1016 42 43839 1620 54 Drent et al. 1992
Glaucus-winged Gull (L. glaucescens) 940 39 31390 49 Drent et al. 1992
Herring Gull (L. argentatus) 850 45 29240 920 43 Dunn 1980
Southern Fulmar (Fulmaris glacialoides) 808 52 50692 1480 69 Hodum and Weathers, manuscript
Antarctic Petrel (Thassaloica antarctica) 590 48 31657 854 69 Hodum and Weathers, manuscript
Great-winged Petrel (Pterodroma macroptera) 537 108 34498 47 Brown 1988
Cape Pigeon (Daption capense) 441 47 31728 942 69 Hodum and Weathers, manuscript
Pigeon Guillemot (Cepphus columba) 430 33 11390 904 49 Dunn 1980
Hawaiian Dark-rumped Petrel (Pterodroma sandwichensis) 426 111 54232 608 25 Simons and Whittow 1984, Brown 1988
Black-legged Kittiwake (Rissa tridactyla) 410 35 18400 852 79 Gabrielsen et al. 1992
Snow Petrel (Pagodroma nivea) 246 47 17637 455 69 Hodum and Weathers, manuscript
Sooty Tern (Sterna fuscata) 198 60 6882 135 25 Ricklefs and White 1981
Blue Petrel (Halobaena caerulea) 177 53 13273 47 Brown 1988
Salvin's Prion (Pachyptila salvini) 154 52 9267 47 Brown 1988
Georgian Diving-Petrel (Pelecanoides georgicus) 148 43 8680 204 53 Roby 1991
Common Diving-Petrel (P. urinatrix) 139 53.5 7400 178 53 Roby 1991
Antarctic Tern (S. vittata) 133 27 7150 398 62 Klaassen 1994
Arctic tern (S. paradisaea) 115 22 4628 277 79 Klaassen 1994
Dovekie (Alle alle) 115 27 5293 284 77 Konarzweski et al. 1993
Common Tern (S. hirundo) 114 25 4852 239 53 Klaassen 1994
Common Tern (S. hirundo) 110 30 4412 199 25 Ricklefs and White 1981
Arctic tern (S. paradisaea) 107 22 3996 233 53 Klaassen 1994
Least Auklet (Aethia pusilla) 96 26 3334 176 57 Roby 1991
Leach's Storm-Petrel (Oceanodroma leucorhoa) 67 60 4798 97 45 Ricklefs et al. 1980
Wilson's Storm-Petrel (Oceanites oceanicus) 54 60 8820 217 65 Obst and Nagy 1993
Note: A: Asymptotic body mass (g); T
fl
: duration of the fledging period (d); TME: total amount of energy metabolized until fledging (kJ); Peak-DME: peak
level of daily metabolized energy during the growth period (kJ d
–1
).
© 2002 by CRC Press LLC
454 Biology of Marine Birds
Using Equation 13.10 for the different seabird species, calculated residual TME values range
from –37.5% in the Sooty Tern (Sterna fuscata, Ricklefs and White 1981) to 142.2% in the Wilson’s
Storm-Petrel (Obst and Nagy 1993), with an average value of 25.1% (SD = 36.01, n = 28 cases)
which differs significantly from zero (t
27
= 3.62, p <0.001). In addition, values for peak-DME range
from –45.3% in the Sooty Tern (Ricklefs and White 1981) to 186.0% in the Wilson’s Storm-Petrel
(Obst and Nagy 1993), with an average value of 24.7% (SD = 44.45%, n = 24 cases) which also
differed significantly from zero (t
23
= 2.67, p <0.014). In conclusion, after correction for body mass
and duration of the fledging period, in seabird chicks both TME and peak-DME appear to be
significantly higher than values reported for birds in general. Thus, compared to most land birds,
seabird chicks exhibit both high TME and peak-DME levels, especially at high latitudes. Since
these chicks are parentally fed, adult seabirds need to collect more food than most land birds to
satisfy the energy requirements of each chick.
Apparently, seabird chicks need more energy to achieve the fledging stage than do landbirds.
Therefore, the data set presented in Table 13.4 was used by this author to derive predictive equations
for TME and peak-DME in seabirds:
TME = 11.09 A
0.771
· t
fl
0.747
(13.12)
(F
2, 25
= 211, r
2
= 0.939, p <0.001, standard error of the exponent for A: 0.053, standard error of
the exponent for t
fl
: 0.134), and
peak-DME = 14.06 A
0.848
· t
fl
–0.341
(13.13)
(F
2, 21
= 211, r
2
= 0.894, p <0.001, standard error of the exponent for A: 0.066, standard error of
the exponent for t
fl
: 0.177).
After having established these relationships for seabirds, for each case listed in Table 13.4, the
residual value was calculated using the measured value, and predicted values from Equations 13.12
and 13.13. Further analysis revealed a significant relationship between residual TME and latitude
(degrees):
Res-TME = –39.28 + 0.796 · latitude (13.14)
(r
2
= 0.21, p <0.015, n = 28 cases, standard error of the slope [s
b
] = 0.411; Figure 13.6), and also
between residual peak-DME and latitude:
Res-peak-DME = –45.30 + 0.927 · latitude (13.15)
(r
2
= 0.208, p <0.025, n = 24 cases, s
b
= 0.286, Figure 13.7). Thus, after correcting for differences
in asymptotic body masses and duration of the nestling period, TME and peak-DME are positively
related with latitude, and increase by about 1% per degree. Thus, rearing chicks at higher latitudes
is more costly than at lower latitudes. Interestingly, these trends seem to be also applicable at the
intraspecific level. For example, in Common and Arctic Tern chicks relative levels of TME and
peak-DME were highest at high latitudes (see Table 13.2; Ricklefs and White 1981, Klaassen 1994).
As can be seen from Figures 13.6 and 13.7, the highest residual value is observed in the energy
budget of the Wilson’s Storm-Petrel determined at Palmer station, Antarctica, with the “chick
weighing” method and “time-energy-budget” method (Obst and Nagy 1993). High TME and peak-
DME levels at high latitudes can be explained by the low ambient temperatures that prevail even
during the breeding season (e.g., see Obst and Nagy 1993), resulting in high thermoregulatory costs
for the chicks. This effect may be magnified in species that rear only one chick, resulting in a
permanent full exposure of the chick to low ambient temperatures.
© 2002 by CRC Press LLC
Chick Growth and Development in Seabirds 455
FIGURE 13.6 Relationship between residual total metabolizable energy intake during growth (residual-TME,
%) and degrees latitude in seabird chicks. Drawn diagonal line represents the relationship between residual-
TME (%) and degrees-latitude in seabird chicks (Equation 13.14).
FIGURE 13.7 Relationship between residual peak-daily metabolizable energy intake during growth (residual-
peak-DME, %) and degrees latitude in seabird chicks. Drawn diagonal line represents the relationship between
residual-peak-DME (%) and degrees-latitude in seabird chicks (Equation 13.15).
© 2002 by CRC Press LLC
456 Biology of Marine Birds
In species that rear more chicks in a single nest, chick may reduce thermoregulatory costs due
to huddling (Visser 1998, Figure 13.8). In young chicks, thermoregulatory costs are relatively low
because of parental brooding, but older, unbrooded chicks are permanently exposed to lower ambient
temperatures (Klaassen 1994). Due to these high thermoregulatory costs the overall growth effi-
ciency is low in chicks that grow at high latitudes. For example, in chicks of the Wilson’s Storm-
Petrel, only about 12% of the TME is converted to tissue, which is much lower than the average
value of 23.1% (SD = 4.45) reported for nine other seabird species (Drent et al. 1992).
13.4 DEVELOPMENT OF TEMPERATURE REGULATION
There is an intimate relationship between the chicks’ development of homeothermy and parental
time budgets. Until achievement of homeothermy of the chick(s) one parent needs to be at the nest
site to provide warmth (Coulson and Johnson 1993, Visser 1998). The time that adults spend brooding
considerably reduces their foraging time, which possibly affects the upper limit of the amount of
food that can be brought to the nest. After achievement of homeothermy of the chick(s), both parents
can leave resulting in an increase in the amount of food collected (Ricklefs and Roby 1983). Therefore,
it seems advantageous for the chick to develop homeothermy at an early age. However, in some
tropical seabird species, such as the Red-tailed Tropicbird and Red-footed Booby, adults brood the
chick for a long time beyond its achievement of homeothermy (Figure 13.9; Schreiber and Schreiber
1993, Schreiber et al. 1996), which suggests that at these latitudes parental time budgets are not as
tight as in birds breeding in polar regions. It has to be noted that the achievement of homeothermy
of the chick and being left unbrooded incur energetic costs for temperature regulation, which affects
the chicks’ growth efficiency (e.g., Gabrielsen et al. 1992, Klaassen 1994; see below). Furthermore,
it has been hypothesized that the development of tissues with high levels of functional maturity occurs
at the expense of a high possible growth rate (i.e., the growth rate–maturity trade-off, Ricklefs 1979).
In addition, costs of chicks being unattended can include an elevated predation risk from natural or
human-introduced predators in some colonies. Given these costs and benefits of early or late acqui-
sition of homeothermy, it is not surprising that in seabirds a range of developmental strategies exists
with respect to the timing of the chicks’ homeothermy.
The body temperature that can be maintained by a seabird chick (T
b
, °C) above ambient
temperature (T
a
, °C) can be considered to be a function of its maximum level of thermogenic heat
production (PMR, W) and its minimum thermal conductance (K, mW °C
–1
):
FIGURE 13.8 Three Brown Pelican siblings huddle in their nest, possibly reducing thermoregulatory costs
over that of single chicks in a nest. (Photo by R. W. Schreiber.)
© 2002 by CRC Press LLC
Chick Growth and Development in Seabirds 457
(T
b
– T
a
) = PMR/K (13.16)
Thus, at a given ambient temperature, a large temperature gradient can be maintained by a
chick if it exhibits a high peak metabolic rate level and/or a low minimal thermal conductance.
Visser (1998) reviewed the literature with respect to RMR, PMR, and K in neonates of bird species.
For birds, in general, allometric relationships were derived to predict the values for these parameters
on the basis of neonatal body mass (M
n
, g):
RMR = 0.0112 · M
n
0.861
(13.17)
PMR = 0.0139 · M
n
1.010
(13.18)
K = 6.57 · M
n
0.501
(13.19)
Thus, because PMR allometrically scales with the body mass to the power 1.01, and minimal
thermal conductance with the power 0.501, the ratio of PMR/K allometrically scales with the power
0.509. Consequently, larger neonates exhibit a more favorable ratio of heat production to heat loss,
resulting in a larger temperature difference that can be maintained by the chick. Therefore, the
production of relatively large eggs as observed in seabirds (see Chapter 12) gives their chicks
considerable thermal advantage.
To facilitate comparison between seabirds and other bird species, for each seabird species listed
in Visser (1998), residual values were calculated for RMR, PMR, and K, using the predictive
Equations 13.17, 13.18, and 13.19, respectively, and Equation 13.3.
In neonates of the Laridae, after correction for body mass as outlined above, average residual
values for RMR, PMR, and K were +18.0% (SD = 23.7, n = 19 species, being significantly higher
than zero, p <0.004), +4.1% (SD = 19.1, n = 12 species, not being significantly different from zero,
p <0.49), and +4.9% (SD = 20.7, n = 11 species, not being significantly different from zero, p <0.50).
In neonates of the Alcidae, average residual values for RMR, PMR, and K were +26.3% (SD
= 29.5, n = six species), 27.9% (SD = 79.2, n = four species), and +23.9 (SD = 48.9, n = five
FIGURE 13.9 Red-tailed Tropicbird chicks are sometimes brooded well past attaining homeothermy, as is
this 3 1/2-week-old chick. Brooding still may offer some energetic savings to the chick. (Photo by E. A.
Schreiber.)
© 2002 by CRC Press LLC
458 Biology of Marine Birds
species), none of these differences being significantly different from zero. To some extent, the large
standard error for PMR residuals is caused by the value of the Xantus’ Murrelet (Endomychura
hypoleuca, Eppley 1984) which exhibits very high residual PMR value (145% above prediction),
resulting in a relatively high degree of homeothermy (Epply 1984). This physiological adaptation
enables these chicks to leave the nest at a very early age to join their parents at sea (Eppley 1984).
No PMR values are available for neonates of cormorants, pelicans, or boobies. However, because
of their altricial mode of development, it can be assumed that newly hatched chicks of these
taxonomic groups lack the ability of thermogenic heat production and require parental brooding.
Cormorant and pelican chicks appear to achieve homeothermic status when weighing approximately
30 and 18% of their asymptotic body mass, respectively (Visser 1998). However, chicks of these
species are being parentally brooded beyond this stage (Schreiber 1976, Hatch and Weseloh 1999).
In neonates of the Spheniscidae, average residual values for RMR and PMR were +0.8% (SD
= 21.5, n = four species) and –47.2% (SD = 6.9, n = three species), only the latter being significantly
different from zero (t
2
= 9.6, p <0.01). Apparently, penguin neonates exhibit a low level of
thermogenic heat production and require parental brooding. Penguin chicks attain the homeothermic
state after having achieved about 7% of the asymptotic body mass, but they are being frequently
brooded at higher body masses (Visser 1998).
In neonates of the Procellariidae, average residual values for RMR, PMR, and K were +10.9%
(SD = 26.0, n = 23 species), +15.1% (SD = 63.0, n = 14 species), and –20.2% (SD = 27.4, n = 12
species), none of these differences being significantly different from zero. Antarctic Prion (Pac-
hyptila desolata) neonates exhibit a high level of thermogenic heat production (PMR = 2.6 × RMR)
compared to chicks of Common Diving-petrels (Pelecanoides urinatrix: PMR = 1.2 × RMR). In
addition, chicks of Antarctic Prions achieve the homeothermic state at an earlier age than do those
of the Common Diving-petrel; as a result Prion chicks are left unattended at an earlier age (Ricklefs
and Roby 1983). As chicks grow, PMR levels increase rapidly due to the accumulation of more
muscle tissue, as well as the increase of metabolic heat production per unit of muscle tissue (Ricklefs
1979). In addition, whole-body minimal thermal conductance values increase at a lower rate than
the increase of the surface area of the chicks. This is to some extent due to the development of
vasomotor control in the legs, resulting in a reduction of heat loss (e.g., Eppley 1984). In general,
chicks of larger species achieve homeothermy at an earlier age, permitting both parents to leave
the nest unattended. Homeothermy is achieved at a later stage in chicks of pelicans (at achievement
of approximately 18% of their asymptotic body mass), cormorants (at 30% of A), gannets (at 16%
of A), and in penguins (at about 7% of A; see Visser 1998).
As mentioned before, thermoregulatory costs of chicks in the field can be offset by parental
brooding, through which a chick can save energy for growth. To estimate the costs for temperature
regulation in the field, uncorrected for parental brooding, heated taxidermic mounts were positioned
in Black-legged Kittiwake (Gabrielsen et al. 1992) and tern colonies at different latitudes (Klaassen
1994). In addition, at these study sites the DLW method was also applied to construct energy budgets
in growing chicks under free-living conditions. The comparison revealed energy savings from parental
brooding to be on the order of 80% in the Kittiwake at Spitsbergen (latitude 79ºN), 67 and 38% for
the Arctic Tern in The Netherlands (53ºN) and Spitsbergen, respectively, 38% for the Common Tern
in The Netherlands, and 46 to 81% for the Antarctic tern on King George Island (63ºS). Clearly, these
energy-saving mechanisms will also hold for chicks of other species that are brooded, particularly at
higher latitudes. A research topic that needs further investigation is the contribution of parental brooding
in low-latitude colonies to protect chicks from overexposure to sunny conditions. Some species have
circumvented the problem of overheating by digging burrows or nesting in the shade.
13.5 PHYSIOLOGICAL EFFECTS OF FOOD RESTRICTION
As shown above, if less food is provided by parents, the growth rate is lower than normal, which
can be reflected by achievement of a lower value for the logistic growth constant and/or the
© 2002 by CRC Press LLC
Chick Growth and Development in Seabirds 459
achievement of a lower asymptotic body mass. In the preceding section it was demonstrated that
achievement of homeothermy is to a large extent the product of an increase of muscle mass as well
as an increase in muscle-mass-specific thermogenic heat production (Ricklefs 1979). Little is known
about differences in carcass composition between well-fed and underfed chicks. However, Klaassen
and Bech (1992) found strong reductions in levels of thermogenic heat production in Arctic Tern
chicks weighing 25% or more below normal. Apparently, at these reduced growth levels, develop-
ment of normal physiological function is impaired. As a consequence of stunted thermoregulatory
development, chicks may require more parental brooding, reducing potential parental foraging time
and, consequently, the potential amount of food delivered to the nest (Schew and Ricklefs 1998).
In the longer term, food restriction and the subsequent growth retardation can potentially result in
reduced survival (e.g., in the Common Murre, Harris et al. 1992), reduced tolerance to starvation
(e.g., in the Lesser Black-backed Gull, Griffiths 1992), and reduced recruitment rate (e.g., in the
Black-legged Kittiwake, Coulson and Porter 1985).
13.6 TOWARD THE CONSTRUCTION OF ENERGY BUDGETS
OF ENTIRE FAMILY UNITS DURING THE PEAK DEMAND
OF THE BROOD
In Section 13.3.4, it was shown that, after correction for asymptotic body mass and the duration
of the nestling period, peak-DME levels of growing seabird chicks exceed average values for land
birds by about 25%. As a consequence, adult seabirds need to collect more food per chick than
land birds, which potentially has a major impact on the planning of the optimal brood size in
seabirds. In addition, after correcting for asymptotic body mass and the duration of the nestling
period, peak-DME appeared to increase by about 0.9% per degree latitude (Equation 13.15). It was
postulated that during peak demand of the brood, adults work at a maximum physiological capacity
of about four times their basal metabolic rate (Drent and Daan 1980). At this specific “work load,”
parents are supposed to collect sufficient food to cover their own expenses plus that of their brood.
Tieleman and Williams (2000) report values for parental daily energy expenditure during chick-
rearing (DEE
par
, kJ d
–1
individual
–1
) for a range of bird species, including ten seabird and eight
landbird species for which energy budgets are available for growing chicks (Table 13.5). Using
their predictive equation for the level of parental energy expenditure for all birds (their Table 13.2
and Equation 13.7, prediction based on body mass), and Equation 13.3 of this chapter, this author
calculated residual levels of parental energy expenditure for each species (Table 13.5). As can be
seen, seabird parents exhibit levels of daily energy expenditure which are on average 54.4% higher
than predicted. In addition, for the landbird subset, the average residual value was only 3.7%. Based
on this data set it can be concluded that after correction for body mass, seabird parents exhibit
much higher levels of energy expenditure than landbirds.
To break down the energy budgets of entire family units during the peak demand of the brood,
the following components can be identified: (1) the level of parental metabolizable energy intake,
which must be equal to the level of parental energy expenditure if parental body mass remains
constant (DEE
par
, kJ d
–1
individual
–1
), and (2) the peak level of metabolizable energy intake of the
entire brood (peak-DME
br
, kJ d
–1
brood
–1
). Thus at this particular stage of maximum energy demand
of the brood, the overall foraging efficiency of the parents (FE
par
, units: kJ d
–1
of food collected
per kJ d
–1
of energy spent, i.e., dimensionless) for species with biparental care (assuming equal
DEE
par
for both parents) can be calculated as:
FE
par
= (2 · DEE
par
+ peak-DME
br
) /(2 · DEE
par
) (13.20)
Thus, if FE
par
= 1 (for example, during periods with high wind [short-term effect] or during El
Niño–Southern Oscillation events [longer-term effect], making it difficult for the parents to collect
© 2002 by CRC Press LLC
460 Biology of Marine Birds
TABLE 13.5
Comparison of Energy Budgets of Family Units between Seabirds and Landbirds
Species
A
(g)
Peak-DME
(kJ d
–1
per chick)
Parental
Mass
(g)
Parental
DEE
(kJ d
–1
)
Res-
parental
DEE (%)
Average
No. of
Chicks
Peak
Demand
Brood (kJ/d)
Parental
Foraging
Efficiency Source
Seabirds
Northern Gannet (Morus bassanus) 3700 2760 3120 4865 76.8 1 2760 1.28 Montevecchi et al. 1984, Birt-Friesen et
al. 1989
Cape Gannet (M. capensis) 3240 2758 2620 4670 91.9 1 2758 1.30 Cooper 1978, Adams et al. 1991
Black-legged Kittiwake (Rissa tridactyla) 410 852 391.6 995 55.6 1 852 1.43 Gabrielsen et al. 1987, Gabrielsen et al.
1991
Sooty Tern (Sterna fuscata) 198 135 184 340.4 –9.5 1 135 1.20 Ricklefs and White 1981, Flint and Nagy
1984
Georgian Diving-Petrel (Pelecanoides georgicus) 148 204 119.2 463.5 67.2 1 204 1.22 Roby and Ricklefs 1986, Roby 1991
Common Diving-Petrel (P. urinatrix) 139 178 132.3 556.6 86.6 1 178 1.16 Roby and Ricklefs 1986, Roby 1991
Dovekie (Alle alle) 115 284 163.7 696.1 100.9 1 284 1.20 Gabrielsen et al. 1991, Konarzewski et al.
1993
Least Auklet (Aethia pusilla) 96 176 83.5 357.9 65.8 1 176 1.25 Roby and Ricklefs 1986, Roby 1991
Leach's Storm-Petrel (Oceanodroma leucorhoa) 67 97 46.8 131.8 –8.3 1 97 1.37 Ricklefs et al. 1980, Ricklefs et al. 1986
Wilson's Storm-Petrel (Oceanites oceanicus) 54 217 42.2 157 17.5 1 217 1.69 Obst et al. 1987, Obst and Nagy 1993
Average
54.5 1.31
Landbirds
Eurasian Kestrel (Falco tinnunculus) 238 351 215.5 328 –22.0 5.1 1790.1 3.73 Masman et al. 1988, Visser et al.
unpublished
Common Starling (Sturnus vulgaris) 65 135 75.5 299.5 48.9 5 675 2.13 Westerterp 1973, Ricklefs and Williams
1984
Blue-throated Bee-eater (Merops viridis) 33 57.5 33.8 77.4 –32.3 3.9 224.25 2.45 Bryant and Hails 1983, Bryant et al. 1984
Western Bluebird (Sialia mexicana) 27.5 66.1 27.5 95 –3.9 5 330.5 2.74 Mock et al. 1991, Mock 1991
Yellow-eyed Junco (Junco phaeonotus) 18.5 54.1 19.6 71.7 –8.0 4 216.4 2.51 Weathers and Sullivan 1991, Weathers
and Sullivan 1993
House Martin (Delichon urbica) 17.4 45.3 18.1 87.2 18.4 4 181.2 2.04 Bryant and Gardiner 1979, Westerterp and
Bryant 1984
Savannah Sparrow (Passerculus sandwichensis) 15.7 46.6 18.3 77.8 4.8 3.2 149.12 1.96 Williams and Prints 1986, Williams 1987
Pacific Swallow (Hirundo tahitica) 14.6 31.7 14.1 76.6 23.9 3 95.1 1.62 Bryant and Hails 1983, Bryant et al. 1984
Average
3.7 2.40
Note: A: Asymptotic body mass (g); Peak-DME: peak level of daily metabolized ener
gy during the growth period (kJ d
–1
per chick); Parental DEE: parental level of daily energy expenditure
(kJ d
–1
); Res-parental DEE: residual value of parental daily energy expenditure (%).
© 2002 by CRC Press LLC
Chick Growth and Development in Seabirds 461
food), no energy is available for chicks and, consequently, they lose mass. Another short-term
option under these conditions is that parents bring some food to chicks at the expense of their own
consumption, resulting in parental body mass loss. If the FE
par
value exceeds 1, some food is left
to cover the demand of the brood, and the higher this value the more food is available for the brood.
For ten species of seabirds, DEE
par
, peak-DME
br
, and FE
par
values were compiled from literature
data (Table 13.5). As can be seen, values for parental foraging efficiency range from a low 1.16 in
the Common Diving-petrel, to a high 1.69 in the Wilson’s Storm-petrel, with an average value of
1.31 for all seabird species. This average value for seabirds is particularly low compared to the
average value of 2.40 found for eight species of land birds (Table 13.5). Thus, in seabirds, per unit
of parental energy spent during foraging, the amount of energy obtained is only 55% of that for
land birds. This low foraging efficiency observed in seabirds may result from (1) relatively long
parental flying distances to forage during the breeding season, and (2) from low food densities in
the sea (Ricklefs et al. 1986, Roby and Ricklefs 1986). Possibly as a result of the low foraging
efficiencies experienced by adult seabirds, in many species sufficient energy is collected to cover
the energetic needs of only one chick. In other inshore feeding species, foraging efficiencies may
be higher permitting parents to rear more than one chick (such as the Black-legged Kittiwake;
Gabrielsen et al. 1992; and gull, tern, cormorant, and pelican species). Clearly, more research is
needed to quantify the effects of flying distance, food availability, and weather on parental foraging
efficiency and, thus, on the overall growth rate of the chicks.
ACKNOWLEDGMENTS
David Goldstein, Erpur Hansen, and Bob Ricklefs gave many valuable comments on earlier drafts
of this manuscript. Peter Hodum and Wes Weathers generously made available data on energy
budgets of some Antarctic petrels.
LITERATURE CITED
ADAMS, N. J., R. W. ABRAMS, W. R. SIEGFRIED, K. A. NAGY, AND I. R. KAPLAN. 1991. Energy
expenditure and food consumption by breeding Cape Gannets (Morus capensis). Marine Ecology Progress
Series 70: 1–9.
BAKKEN, G. S. 1976. A heat transfer analysis of animals: unifying concepts and the application of metabolism
chamber data to field ecology. Journal of Theoretical Biology 60: 337–384.
BATCHELOR, A. L. 1982. The Diet of the Cape Gannet (Sula capensis) Breeding on Bird Island, Algoa Bay.
M.Sc. thesis, University of Port Elisabeth, Port Elisabeth, South Africa.
BIRT-FRIESEN, V. L., W. A. MONTEVECCHI, D. K. CAIRNS, AND S. A. MACKO. 1989. Activity-specific
metabolic rates of free-living Northern Gannets and other seabirds. Ecology 70: 357–367.
BOERSMA, P. D. 1986. Body temperature, torpor, and growth of chicks of Fork-tailed Storm-Petrels (Ocean-
odroma furcata). Physiological Zoology 59: 10–19.
BOERSMA, P. D., D. L. STOKES, AND P. M. YORIO. 1990. Reproductive variability and historical change
of Magellanic Penguins (Spheniscus magellanicus) at Punta Tombo, Argentina. Pp. 15–43 in Penguin
Biology (L. S. Davis, and J. T. Darvy, Eds.). Academic Press, New York.
BROOKE, M.
DE L. 1986. Manx Shearwater chicks: seasonal, parental, and genetic influences on the chick’s
age and weight at fledging. Condor 88: 324–327.
BROWN, C. R. 1988. Energy requirements for growth of Salvin’s Prions Pachyptila vittata salvini, Blue
Petrels Halobaena caerulea and Great-winged Petrels Pterodroma macroptera. Ibis 130: 527–534.
BRYANT, D. M., AND A. GARDINER. 1979. Energetics of growth in House Martins (Delichon urbica).
Journal of Zoology, London 189: 275–304.
BRYANT, D. M., AND C. J. HAILS. 1983. Energetics and growth patterns of three tropical bird species. Auk
100: 425–439.
BRYANT, D. M., C. J. HAILS, AND P. TATNER. 1984. Reproductive energetics of two tropical bird species.
Auk 101: 25–37.
© 2002 by CRC Press LLC
462 Biology of Marine Birds
CASTRO, G., N. STOYAN, AND J. P. MYERS. 1989. Assimilation efficiency in birds: a function of taxon
or food type? Comparative Biochemistry and Physiology 92A: 271–278.
CATRY, P., N. RATCLIFFE, AND R. W. FURNESS. 1998. The influence of hatching date on different life-
history stages of Great Skuas Catharacta skua. Journal of Avian Biology 29: 299–304.
CLARKE, A., AND P. A. PRINCE. 1980. Chemical composition and calorific value of food fed to Mollymauk
chicks Diomeda melanophris and D. chrysostoma at Bird Island, South Georgia. Ibis 122: 488–494.
CLARKE, A., M. R. CLARKE, J. L. HOLMES, AND T. D. WATERS. 1985. Calorific values and elemental
analysis of eleven species of oceanic squids (Mollusca: Cephalopoda). Journal of Marine Biology
Assessment U.K. 65: 983–986.
COOPER, J. 1978. Energetic requirements for growth of the Jackass Penguin. Zoologica Africana 12: 201–213.
COULSON, J. C., AND J. M. PORTER. 1985. Reproductive success of the Kittiwake Rissa tridactyla: The
role of clutch size, chick growth rates, and parental quality. Ibis 127: 450–466.
COULSON, J. C., AND M. P. JOHNSON. 1993. The attendance and absence of adult Kittiwakes Rissa
tridactyla from the nest site during the chicks stage. Ibis 135: 372–378.
CRAWFORD, R. J. M., AND B. M. DYER. 1995. Responses by four seabird species to a fluctuating availability
of Cape Anchovy Engraulis capensis off South Africa. Ibis 137: 329–339.
DAAN, S., AND J. M. TINBERGEN. 1979. Young Guillemots (Uria lomvia) leaving their arctic breeding
cliffs: a daily rhythm in numbers and risk. Ardea 67: 96–100.
DANCHIN, E. 1992. Food shortage as a factor in the 1988 Kittiwake Rissa tridactyla breeding failure in
Shetland. Ardea 80: 93–98.
DAVIS, R. W., J. P. CROXALL, AND M. J. O’CONNELL. 1989. The reproductive energetics of Gentoo
(Pygoscelis papua) and Macaroni (Eudyptes chrysolophus) Penguins at South Georgia. Journal of Animal
Ecology 58: 59–74.
DRENT, R., AND S. DAAN. 1980. The prudent parent: energetic adjustments in avian breeding. Ardea 68: 225–252.
DRENT, R. H., M. KLAASSEN, AND B. ZWAAN. 1992. Predictive growth budgets in terns and gulls. Ardea
80: 5–17.
DUNN, E. H. 1975. Caloric intake of nestling Double-crested Cormorants. Auk 92: 553–565.
DUNN, E. H. 1980. On the variability in energy allocation of nestling birds. Auk 97: 19–27.
EPPLEY, Z. A. 1984. Development of thermoregulatory abilities in Xantus’s Murrelet chicks (Synthliboram-
phus hypoleucus). Physiological Zoology 57: 307–317.
FLINT, E. N., AND K. A. NAGY. 1984. Flight energetics of free-living Sooty Terns. Auk 101: 288–294.
FRANK, D. The influence of feeding conditions on food provisioning of chicks in Common Terns Sterna
hirundo nesting in the German Wadden Sea. Ardea 80: 45–56.
FRANK, D., AND P. H. BECKER. 1992. Body mass and nest reliefs in Common Terns Sterna hirundo
exposed to different feeding conditions. Ardea 80: 57–70.
GABRIELSEN, G. W., F. MEHLUM, AND K. A. NAGY. 1987. Daily energy expenditure and energy
utilization of free-ranging Black-legged Kittiwakes. Condor 89: 126–132.
GABRIELSEN, G. W., J. R. E. TAYLOR, M. KONARZEWSKI, AND F. MEHLUM. 1991. Field and
laboratory metabolism and thermoregulation in Dovekies (Alle alle). Auk 108: 71–78.
GABRIELSEN, G. W., M. KLAASSEN, AND F. MEHLUM. 1992. Energetics of Black-legged Kittiwake
(Rissa tridactyla) chicks. Ardea 80: 29–40.
GASTON, A. J. 1985. Development of the young in the Atlantic Alcidae. Pp. 319–354 in The Atlantic Alcidae
(D. N. Nettleship and T. R. Birkhead, Eds.). Academic Press, London.
GASTON, A. J. 1992. The Ancient Murrelet. A Natural History in the Queen Charlotte Islands. Poyser, London.
GESSAMAN, J. A., AND K. A. NAGY. 1988. Energy metabolism: errors in gas-exchange conversion factors.
Physiological Zoology 61: 507–513.
GRIFFITHS, R. 1992. Sex-biased mortality in the Lesser Backed Gull Larus fuscus during the nestling stage.
Ibis 134: 237–244.
HARRIS, M. P., D. J. HALLEY, AND S. WANLESS. 1992. The post-fledging survival of young Guillemots
Uria aalge in relation to hatching date and growth. Ibis 134: 335–339.
HATCH, J. H., AND D. V. WESELOH. 1999. The Double-crested Cormorant (Phalacrocorax auritus). No.
441 in The Birds of North America (A. Poole and F. Gill, Eds.). The Birds of North America, Inc.,
Philadelphia.
HEATH, R. G. M., AND R. M. RANDALL. 1985. Growth of Jackass Penguin chicks (Spheniscus demersus)
hand reared on different diets. Journal of Zoology, London 205: 91–105.
© 2002 by CRC Press LLC
Chick Growth and Development in Seabirds 463
HODUM, P. J., AND W. W. WEATHERS. Submitted. Ecological energetics and prey consumption of an
Antarctic seabird community. Submitted to Journal of Animal Ecology.
HUIN, N., P. A. PRINCE, AND D. R. BRIGGS. 2000. Chick provisioning rates and growth in Black-browed
Albatross Diomedea melanophris and Grey-headed Albatross D. chrysostoma at Bird Island, South
Georgia. Ibis 142: 550–565.
JACKSON, S. 1986. Assimilation efficiencies of White-chinned Petrels (Procellaria aequinoctialis) fed dif-
ferent prey. Comparative Biochemistry and Physiology 85A: 301–303.
JOUVENTIN, P., J. MARTINEZ, AND J. P. ROUX. 1989. Breeding biology and current status of the
Amsterdam Island Albatross, Diomedea amsterdamensis. Ibis 131: 171–182.
KLAASSEN, M. 1994. Growth and energetics of tern chicks from temperate and polar environments. Auk
111: 525–544.
KLAASSEN, M., AND C. BECH. 1992. Resting and peak metabolic rates of arctic Tern nestlings and their
relations to growth rate. Physiological Zoology 65: 803–814.
KLAASSEN, M., C. BECH, D. MASMAN, AND G. SLAGSVOLD. 1989. Growth and energetics of Arctic
Tern chicks (Sterna paradisaea). Auk 106: 240–248.
KLAASSEN, M., B. ZWAAN, P. HESLENFELD, P. LUCAS, AND B. LUIJCKX. 1992. Growth rate asso-
ciated changes in the energy requirements of tern chicks. Ardea 80: 19–28.
KONARZEWSKI, M. 1994. Allocation of energy to growth and respiration in avian postembryonic develop-
ment. Ecology 76: 8–19.
KONARZEWSKI, M., AND J. R. E. TAYLOR. 1989. The influence of weather conditions on growth of Little
Auk (Alle alle) chicks. Ornis Scandinavica 20: 112–115.
KONARZEWSKI, M., J. R. E. TAYLOR, AND G. W. GABRIELSEN. 1993. Chick energy requirements of
Dovekies (Alle alle). Auk 110: 343–353.
LACK, D. 1968. Ecological adaptations for breeding in birds. Methuen, London.
LIFSON, N. A., AND R. M. McCLINTOCK 1966. Theory of use of the turnover rates of body water for
measuring water and energy balance. Journal of Theoretical Biology 12: 46–74.
MASMAN, D., S. DAAN, AND H. J. A. BELDHUIS. 1988. Ecological energetics of the kestrel: daily energy
expenditure throughout the year based on time-energy budget, food intake and doubly labeled water
methods. Ardea 76: 64–81.
MOCK, P. J. 1991. Daily allocation of time and energy of Western Bluebirds feeding nestlings. Condor 93:
598–611.
MOCK, P. J., M. KHUBESRIAN, AND D. M. LARCHEVEQUE. 1991. Energetics of growth and maturation
in sympatric passerines that fledge at different ages. Auk 108: 34–41.
MONTEVECCHI, W. A., R. E. RICKLEFS, I. R. KIRKHAM, AND D. GABALDON. 1984. Growth energetics
of nestling Northern Gannets (Sula bassanus). Auk 101: 334–341.
MYRCHA, A., AND P. KAMINSKI. 1982. Changes in body calorific values during nestling development of
penguins of the genus Pygoscelis. Polish Polar Research 3: 81–88.
NAGY, K. A. 1980. CO
2
production in animals: an analysis of potential errors of the doubly labeled water
technique. American Journal of Physiology 238: R466–R473.
NAGY, K. A., AND D. P. COSTA. 1980. Water flux in animals: analyses of potential errors in the tritiated
water method. American Journal of Physiology 238: R454–R465.
NICE, M. M. 1962. Development of behavior in precocial birds. Transactions of the Linnean Society, New
York 8: 1–211.
OBST, B. S., K. A. NAGY, AND R. E. RICKLEFS. 1987. Energy utilization by Wilson’s Storm-Petrel
(Oceanites oceanicus). Physiological Zoology 60: 200–210.
OBST, B. S., AND K. A. NAGY. 1993. Stomach oil and the energy budget of Wilson’s Storm-Petrel nestlings.
Condor 95: 792–805.
PETTIT, T. N., G. S. GRANT, AND G. C. WHITTOW. 1982. Body temperatures and growth of Bonin Petrel
chicks. Wilson Bulletin 94: 358–361.
PHILLIPS, R. A., AND K. C. HAMER. 2000. Periodic weighing and the assessment of meal mass and feeding
frequency in seabirds. Journal of Avian Biology 31: 75–80.
PRINCE, P. A., AND C. RICKETTS. 1981 Relationships between food supply and growth in albatrosses: an
interspecies chick fostering experiment. Ornis Scandinavica 12: 207–210.
PRINCE, P. A., AND D. W. H. WALTON. 1984. Automated measurement of meal sizes and feeding frequency
in albatrosses. Journal of Applied Ecology 21: 789–794.
© 2002 by CRC Press LLC