Wastewater Purification: Aerobic Granulation in Sequencing Batch Reactors - Chapter 7 docx
Bạn đang xem bản rút gọn của tài liệu. Xem và tải ngay bản đầy đủ của tài liệu tại đây (439.76 KB, 20 trang )
111
7
Growth Kinetics of
Aerobic Granules
Qi-Shan Liu and Yu Liu
CONTENTS
7.1 Introduction 111
7.2 A Simple Kinetic Model for the Growth of Aerobic Granules 112
7.2.1 GrowthofAerobicGranulesatDifferentOrganic
Loading Rates 113
7.2.2 Growth of Aerobic Granules at Different Shear Forces 114
7.2.3 GrowthofAerobicGranulesatDifferentSubstrate
N/COD Ratios 116
7.3 Effect of Surface Loading on Kinetic Behavior of Aerobic Granules 117
7.3.1 Effect of Surface Loading on Growth Rate 117
7.3.2 Effect of Surface Loading on Substrate Biodegradation Rate 118
7.3.3 RelationshipofSurfaceGrowthRatetoSubstrate
Biodegradation Rate 120
7.4 Substrate Concentration-Associated Kinetic Behaviors of
Aerobic Granules 123
7.5 A General Model for Aerobic Granular Sludge SBR 124
7.5.1 Description of Substrate Utilization 125
7.5.2 Description of Oxygen Transfer 125
7.5.3 Description of Diffusion of Substance 126
7.5.4 Description of Biological Reactions 128
7.6 Conclusions 128
References 128
7.1 INTRODUCTION
In biolm culture, biolm thickness has been commonly used to describe the growth
behaviorsofxedbacteriaatthesurfaceofthebiocarrier,andanumberofgrowth
models have been developed for biolm culture. However, these models may not be
suitableforthedescriptionofthegrowthofaerobicgranules.Ithasbeenshownthat
aerobicgranulescangrowinawiderangeofsizes,from0.2to16.0mminmean
diameter,asdescribedinchapter1.Granulesizedeterminesthetotalsurfacearea
availableforthebiodegradationofsubstrate,andsubsequentlythesubstratesurface
loading. In biolm culture, microbial growth kinetics has been reported to be surface
loading-dependent(Trinetetal.1991).Infact,microbialsurfacegrowthrateandbio-
degradationrateofaerobicgranulesarefairlyrelatedtothesubstratesurfaceloading,
53671_C007.indd 111 10/29/07 7:18:11 AM
© 2008 by Taylor & Francis Group, LLC
© 2008 by Taylor & Francis Group, LLC
112 Wastewater Purification
andcanbedescribedbytheMonod-typeequation(Y.Liuetal.2005).Thischapterdis-
cusses the growth kinetics of aerobic granules associated with substrate utilization.
7. 2 A SIMPLE KINETIC MODEL FOR THE GROWTH OF
AEROBIC GRANULES
Thegrowthofaerobicgranulesaftertheinitialcell-to-cellself-attachmentissimilar
to the growth of biolm, and can be regarded as the net result of interaction between
bacterial growth and detachment (Y. Liu et al. 2003). The balance between the
growth and detachment processes in turn will lead to an equilibrium size of aerobic
granules (Y. Liu and Tay 2002). Compared with biolm process, aerobic granula
-
tion is a process of cell-to-cell self-immobilization instead of cell attachment to a
solidsurface.Thus,sizeevolutionofmicrobialaggregatescanbeusedtodescribe
gradualprocessfromdispersedsludgetomatureaerobicgranuleswithaspherical
outershapeandastablesize.Undergivengrowthanddetachmentconditions,the
equilibrium size (
D
eq
) of aerobic granules exists when the growth and detachment
forces are balanced, that is, the size of aggregate (D) gradually approaches its equi-
libriumsize(D
eq
).AccordingtoAtlasandBartha(1998),thechangerateofpopula-
tiondensityintermsofsizeorconcentrationofamicrobialcommunityisafunction
of the difference between its density at growth equilibrium and that at time
t. Thus,
the difference between D
eq
and D represents the growth potential of aerobic granules
undergivenconditions(Yangetal.2004).
The linear phenomenological equation (LPE) shows that a ux term and a driving
forcetermfortransportphenomenaarelinearlyrelated(DeGroofandMazur1962).
The unqualied success of this linear assumption has been universally recognized
as the basis of thermodynamics of transport phenomena (Prigogine 1967; Garnkle
2002),whilethelinearrelationshipbetweentherateofamicrobialprocessandits
driving force had been conrmed (Rutgers, Balk, and Van Dam 1989; Heijnen and
van Dijken, 1992). It must be realized that the LPE indeed reveals that the change
rateofpopulationdensitywouldbearst-orderfunctionofthedrivingforceor
growth potential. As an analogue to the LPE, Yang et al. (2004) proposed that the
growthofaerobicgranulesinsizecanbedescribedbythefollowingequation:
dD
dt
DD
eq
M() (7.1)
where µ is the specic growth rate of aggregate by size (day
–1
). Equation (7.1) can be
rearranged to:
dD
DD
dt
eq
M (7.2)
Ingeneral,anewlyinoculatedculturedoesnotgrowimmediatelyoveratime,
whichisoftenreferredtoasthelagphase(GaudyandGaudy1980).Thelagphase
isthetimerequiredforbacteriatoadapttonewlivingconditionsinsteadofgrowth,
andisnotincludedinequation7.1.Thus,onlythesizeofmicrobialaggregatesatthe
53671_C007.indd 112 10/29/07 7:18:13 AM
© 2008 by Taylor & Francis Group, LLC
© 2008 by Taylor & Francis Group, LLC
thegrowthofaerobicgranules.Aspresentedinchapter1,aerobicgranulationisa
Growth Kinetics of Aerobic Granules 113
endofthelagphasecanbeusedastheinitialvalueformicrobialgrowth.Integration
of equation 7.2 gives:
DD D D e
oeq
tt
o
()
()
1(7.3)
where
t
0
isthetimeattheendofthelagphase,andD
0
is the size of microbial aggre-
gates at time
t
0
. D
eq
, µ, D
0
,andt
0
canbedeterminedexperimentallybyusingthe
method proposed by Gaudy and Gaudy (1980).
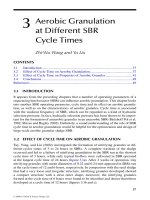
7. 2.1 GROWTH OF AEROBIC GRANULES AT DIFFERENT ORGANIC LOADING RATES
The formation of aerobic granules was demonstrated in sequencing batch reactors
(SBRs)suppliedwithdifferentorganicloadingrates,from1.5to9.0kgCODm
–3
d
–1
(see chapter 1). Figure 7.1 shows the evolution of microbial aggregates in terms of
mean size at different organic loading rates. The size of microbial aggregates gradu
-
allyincreaseduptoastablevalue,theso-calledequilibriumsize,duringtheSBR
operation.Itcanbeseenthatequation7.3canprovideagoodpredictiontothegrowth
dataofaerobicgranulesobtainedatdifferentorganicloadingrates,indicatedbya
correlation coefcient greater than 0.95 (gure 7.1). The effects of organic loading
rate on the equilibrium size (
D
eq
) of aerobic granules and the size-dependent specic
Lag phase
0.00
0.30
0.60
0.90
1.20
1.50
1.80
Size (mm)
Lag phase
Loading Rate: 3.0 kg m
–3
d
–1
Loading Rate: 1.5 kg m
–3
d
–1
Loading Rate: 9.0 kg m
–3
d
–1
Loading Rate: 6.0 kg m
–3
d
–1
0.00
0.50
1.00
1.50
2.00
0 1020304050
Time (days)
0 1020304050
Time (days)
0 1020304050
Time (days)
0 1020304050
Time (days)
Size (mm)
0.00
0.50
1.00
1.50
2.00
Size (mm)
Lag phase
0.00
0.50
1.00
1.50
2.00
2.50
Size (mm)
Lag phase
FIGURE 7.1 Size evolution of microbial aggregates cultivated at different organic loading
rates.Thepredictiongivenbyequation7.3isshownbyasolidline.(DatafromYang,S.F.,
Liu, Q. S., and Liu, Y. 2004. Lett Appl Microbiol 38: 106–112.)
53671_C007.indd 113 10/29/07 7:18:15 AM
© 2008 by Taylor & Francis Group, LLC
© 2008 by Taylor & Francis Group, LLC
114 Wastewater Purification
growth rate (µ)arepresentedingure7.2.Itwasfoundthatboththesizeofthe
microbial aggregate at equilibrium (
D
eq
) and the size-dependent specic growth rate
(µ)tendedtoincreasewiththeincreaseoforganicloadingrateintherangestudied.
A similar phenomenon was also observed by Moy et al. (2002). Obviously, the rela
-
tionship observed between the growth rate of aerobic granules and the organic load
-
ingrateissubjecttothebest-knownMonodequation,thatis,ahighsubstrateloading
resultsinahighmicrobialgrowthrate.Thedevelopmentofbiggeraerobicgranules
atthehigherorganicloadingrateissimplyduetoitsloading-associatedgrowthrate.
Inthebiolmprocess,biolmthicknesswasalsofoundtobeproportionallyrelated
to the applied organic loading rate (Tijhuis et al. 1996; Kwok et al. 1998).
InacolumnSBR,hydrodynamicshearforceismainlycreatedbyaerationthatcan
bequantiedbysupercialupowairvelocity(seechapter2).Theeffectofshear
forceintermsofsupercialupowairvelocityonthegrowthofaerobicgranules
goodagreementwiththeexperimentaldataobtainedatdifferentshearforces.Both
the size of the microbial aggregate at equilibrium and the size-dependent specic
growth rate show decreasing trends as the shear force increases (gure 7.4).
It is known that high shear force would lead to more collision among particles,
andfrictionbetweenparticleandliquid,leadingtoahighdetachmentforce.This
mayinpartexplainwhysmalleraerobicgranulesweredevelopedathighershear
force. A similar phenomenon was also observed in the biolm culture where
thinnerbiolmwascultivatedathighershearforce(vanLoosdrechtetal.1995;
Gjaltema,vanLoosdrecht,andHeijnen1997;Y.LiuandTay2001;Horn,Reiff,
andMorgenroth2003).Y.Liuetal.(2003)proposedthatthegrowthkineticsof
biolmishighlydependentontheratioofgrowthforcenormalizedtodetachment
force.Atagivenorganicloadingrate,amicrobialcommunitycanregulateitsmeta
-
bolicpathwaysinresponsetochangesinexternalshearforce,forexamplemore
0.07
0.09
0.11
0.13
0.0 2.0 4.0 6.0 8.0
10.0
Specific Growth Rate (d
–1
)
1.55
1.60
1.65
1.70
1.75
1.80
1.85
1.90
Granule Size at Equilibrium (mm)
Organic Loading Rate (kg COD m
–3
d
–1
)
FIGURE 7.2 Effect of organic loading rate on size of microbial aggregate at equilibrium ($)
and specic growth rate by size (D).(DatafromYang,S.F.,Liu,Q.S.,andLiu,Y.2004.Lett
Appl Microbiol 38: 106–112.)
53671_C007.indd 114 10/29/07 7:18:16 AM
© 2008 by Taylor & Francis Group, LLC
© 2008 by Taylor & Francis Group, LLC
7. 2. 2 GROWTH OF AEROBIC GRANULES AT DIFFERENT SHEAR FORCES
isillustratedingure7.3.Itcanbeseenthatthepredictionbyequation7.3isin
Growth Kinetics of Aerobic Granules 115
0.00
0.09
0.18
0.27
0.36
0.45
03
6
91215
Size (mm)
Lag phase
Time (days)
0 5 10 15 20 25 30
Time (days)
Superficial Upflow Air Velocity: 1.2 cm s
–1
Superficial Upflow Air Velocity: 2.4 cm s
–1
0.00
0.09
0.18
0.27
0.36
0.45
Size (mm)
Lag phase
Superficial Upflow Air Velocity: 3.6 cm s
–1
0.00
0.09
0.18
0.27
0.36
0.45
0 5 10 15 20 25 30
Time (days)
Size (mm)
Lag phase
FIGURE 7.3 Size evolution of microbial particles at different shear forces. The prediction
givenbyequation7.3isshownbyasolidline.(DatafromYang,S.F.,Liu,Q.S.,andLiu,Y.
2004. Lett Appl Microbiol 38: 106–112.)
0.1
0.2
0.3
0.4
0.5
0.0 1.0 2.0 3.0 4.0
Specific Growth Rate (d
–1
)
0.25
0.30
0.35
0.40
Granule Size at Equilibrium (mm)
Superficial Upflow Air Velocity (cm s
–1
)
FIGURE 7.4 Effect of shear force on size of microbial aggregate at equilibrium ($)and
specicgrowthratebysize(D).(DatafromYang,S.F.,Liu,Q.S.,andLiu,Y.2004.Lett Appl
Microbiol 38: 106–112.)
53671_C007.indd 115 10/29/07 7:18:18 AM
© 2008 by Taylor & Francis Group, LLC
© 2008 by Taylor & Francis Group, LLC
116 Wastewater Purification
extracellularpolysaccharideswouldbeproduced(seechapter2).Thisisthereason
behindareducedequilibriumsizeandgrowthratewiththeincreaseofshearforce.In
fact, it has been demonstrated that suspended bacteria can respond to hydrodynamic
shearbyalteringtheirgrowthrate,celldensity,andmetabolism(Meijeretal.1993;
ChenandHuang2000;Q.S.Liuetal.,2005).
7. 2. 3 GROWTH OF AEROBIC GRANULES AT DIFFERENT SUBSTRATE
N/COD R
ATIOS
AerobicgranulescanforminawiderangeofdifferentsubstrateN/CODratios
attheN/CODratiosof0.05to0.3isshowningure7.5.Itcanbeseenthatthe
prediction of equation 7.3 tted the experimental data very well, indicated by a cor
-
aggregate at equilibrium, the size-dependent specic growth rate, and the substrate
N/COD ratio are presented in gure 7.6. Both the size of the microbial aggregate at
equilibrium and the size-dependent specic growth rate were found to decrease with
the increase of substrate N/COD ratio. This seems to imply that the substrate N/COD
N/COD: 0.3
0.00
0.15
0.30
0.45
Size (mm)
Lag phase
N/COD: 0.1
0.00
0.30
0.60
0.90
1.20
1.50
1.80
Size (mm)
Lag phase
N/COD: 0.05
0.00
0.50
1.00
1.50
2.00
2.50
0 20 40 60 80 0 20 40 60 80
Time (days)
020406080
Time (days)
Time (days)
0 20406080
Time (days)
Size (mm)
Lag phase
N/COD: 0.2
0.00
0.10
0.20
0.30
0.40
0.50
0.60
Size (mm)
Lag phase
FIGURE 7.5 Size evolution of microbial particles at different substrate N/COD ratios. The
predictiongivenbyequation7.3isshowninasolidline.(DatafromYang,S.F.,Liu,Q.S.,
andLiu,Y.2004.Lett Appl Microbiol 38: 106–112.)
53671_C007.indd 116 10/29/07 7:18:19 AM
© 2008 by Taylor & Francis Group, LLC
© 2008 by Taylor & Francis Group, LLC
relation coefcient greater than 0.97. The relationships between the size of microbial
fornutrientandcarbonremoval(seechapter1).Thegrowthofaerobicgranules
Growth Kinetics of Aerobic Granules 117
ratio might select microbial populations in aerobic granules, that is, high substrate
N/CODratiowillpromotethegrowthofnitrifyingpopulations(Yang,Tai,andLiu
2004,2005).Itiswellknownthatanitrifyingpopulationgrowsmuchslowerthan
heterotrophs do. Consequently, an enriched nitrifying population in aerobic granules
developedathighsubstrateN/CODratiowouldberesponsiblefortheoveralllow
growth rate of granular sludge and smaller size, as shown in gure 7.6.
7. 3 EFFECT OF SURFACE LOADING ON
KINETIC BEHAVIOR OF AEROBIC GRANULES
7. 3.1
EFFECT OF SURFACE LOADING ON GROWTH RATE
Y.Liuetal.(2005)studiedtheeffectofsurfaceloadingrateonthegrowthofaerobic
granules,andfoundthatthespecicsurfaceareaofaerobicgranulesisinversely
correlatedtothemeandiameteroftheaerobicgranules,thatis,biggergranuleshave
a smaller specic surface area (gure 7.7). According to the specic surface area of
aerobic granules, the substrate surface loading of aerobic granules can be calculated
based on the volumetric organic loading rate applied. Figure 7.8 further exhibits the
effect of substrate surface loading on the surface growth rate of aerobic granules.
Itappearsthatahighersurfaceloadingresultsinfastergrowthofaerobicgranules,
andtherelationshipbetweenthesurfacegrowthrateofaerobicgranulesandthe
substrate surface loading is subject to the Monod-type equation:
MM
SS
S
SS
L
LK
,max
(7.4)
where
µ
S
and µ
S,max
are,respectively,thesurfacegrowthrateandthemaximumsur-
face growth rate of aerobic granules (g biomass m
–2
h
–1
)andL
s
is the surface loading
(g COD m
–2
), while K
s
is the Monod constant. Equation 7.4 can satisfactorily describe
0.04
0.05
0.06
0.07
0.08
0.09
0 0.1 0.2 0.3
Specific Growth Rate (d
–1
)
0.0
0.8
1.6
2.4
3.2
Granule Size at Equilibrium (mm)
Substrate N/COD Ratio (mg mg
–1
)
FIGURE 7.6 Effect of substrate N/COD ratio on size of microbial aggregate at equilibrium
($)andspecicgrowthratebysize(D). (Data from Yang, S. F., Liu, Q. S., and Liu, Y. 2004.
Lett Appl Microbiol 38: 106–112.)
53671_C007.indd 117 10/29/07 7:18:21 AM
© 2008 by Taylor & Francis Group, LLC
© 2008 by Taylor & Francis Group, LLC
118 Wastewater Purification
the experimental data, indicated by a correlation coefcient of 0.99 (gure 7.8). In
addition,gure7.9showstheeffectofthesubstratesurfaceloadingonthesurface
oxygenutilizationrate(SOUR)ofaerobicgranules.Atrendsimilartoµ
S
is observed
in gure 7.9. It seems that the microbial activity of aerobic granules increases with
the increase of substrate surface loading rate.
7. 3. 2 EFFECT OF SURFACE LOADING ON SUBSTRATE BIODEGRADATION RATE
The surface COD removal rate (q
s
)byaerobicgranulesversusthesubstratesurface
loadingispresentedingure7.10,showingthatanincreasedsubstratesurfaceload-
ing leads to a higher surface COD removal rate until a maximum value is reached.
Analogous to equation 7.4, q
s
versus L
s
canbedescribedbyaMonod-typeequation:
0
0.1
0.2
0.3
0.4
0.5
0.0 0.5 1.0 1.5 2.0 2.5
Mean Diameter (mm)
Specific Surface Area (m
2
g
–1
)
FIGURE 7.7 Specicsurfaceareaversusthemeandiameterofaerobicgranules.(From
Liu, Y. et al. 2005. Appl Microbiol Biotechnol 67:484–488.Withpermission.)
FIGURE 7.8 Effect of the substrate surface loading (L
s
) on the surface growth rate (µ
s
)of
aerobicgranules.Thepredictiongivenbyequation7.4isshownbyasolidcurve.µ
s,max
=
0.62 g biomass m
–2
h
–1
; K
s
=9.6gCODm
–2
;andcorrelationcoefcient=0.994.(FromLiu,Y.
et al. 2005. Appl Microbiol Biotechnol 67:484–488.Withpermission.)
53671_C007.indd 118 10/29/07 7:18:23 AM
© 2008 by Taylor & Francis Group, LLC
© 2008 by Taylor & Francis Group, LLC
Growth Kinetics of Aerobic Granules 119
L
LK
SS
S
SS
,max
(7.5)
where q
s,max
is the maximum substrate surface removal rate by aerobic granules (g
COD m
–2
h
–1
).Itisobviousthattheequation7.5predictionisingoodagreementwith
the experimental data (gure 7.10). It is known that the kinetic behavior of a micro
-
bialcultureisassociatedwiththeinteractionbetweenanabolismandcatabolism,
and catabolism is coupled to anabolism (Lehninger 1975). This implies that sub-
strate oxidation is tied up with oxygen reduction during the aerobic culture of micro-
organisms. Figure 7.11 shows the close correlation of q
s
toSOUR,whichrevealsthat
1.0gsubstrate-CODoxidizedbyaerobicgranulesrequires0.68goxygen.
0.0
0.5
1.0
1.5
2.0
0 5 10 15 20 25 30
L
s
(g COD m
–2
)
SOUR (g O
2
m
–2
h
–1
)
FIGURE 7.9 Effect of substrate surface loading (L
s
) on the surface oxygen utilization rate
(SOUR)ofaerobicgranules.(FromLiu,Y.etal.2005.Appl Microbiol Biotechnol 67: 484–488.
With permission.)
0.0
1.0
2.0
3.0
0 5 10 15 20 25
L
s
(g COD m
–2
)
q
s
(g COD m
–2
h
–1
)
FIGURE 7.10 Effect of the substrate surface loading (L
s
) on the substrate surface removal
rate (q
s
)byaerobicgranules.Thepredictiongivenbyequation7.5isshownbyasolidcurve.
q
s,max
=4.67gCODm
–2
h
–1
; K
s
=14.2gCODm
–2
;andcorrelationcoefcient=0.991.(From
Liu, Y. et al. 2005. Appl Microbiol Biotechnol 67:484–488.Withpermission.).
53671_C007.indd 119 10/29/07 7:18:25 AM
© 2008 by Taylor & Francis Group, LLC
© 2008 by Taylor & Francis Group, LLC
120 Wastewater Purification
7. 3. 3 RELATIONSHIP OF SURFACE GROWTH RATE TO
SUBSTRATE BIODEGRADATION RATE
It has been recognized that aerobic granules can be differentiated from suspended
activated sludge by their size, spherical shape, excellent settleability, and highly orga
-
nizedmicrobialstructure(Y.LiuandTay2002).Figure7.7showsthatthespecic
surfaceareaofaerobicgranulesiscloselyrelatedtotheirmeandiameter,while
gures7.8to7.10clearlyindicatethatthesurfacegrowthrateandthesubstratesur
-
face biodegradation rate of aerobic granules in terms of
µ
S
, q
s
, and SOUR increase
with the substrate surface loading, that is, the kinetic behavior of aerobic granules
isdependentonthesubstratesurfaceloading.AccordingtoTempestandNeijssel
(1978),thePirtmaintenanceequationcanbelinearizedasfollows:
qm
Y
SS
G
S
1
M (7.6)
where
m
s
is the Pirt maintenance coefcient and Y
G
is the theoretical maximum
growth yield. Figure 7.12 shows the linear relationship of
q
s
to µ
S
with a m
s
value of
0.24gCODm
–2
h
–1
and a Y
G
valueof0.2gbiomassg
–1
COD. At the lowest substrate
surface loading of 2.2 g COD m
–2
,about40%oftheinputsubstrateisconsumed
throughthemaintenancemetabolism,whileonly10%ofinputsubstrategoesintothe
maintenanceatthehighestsubstratesurfaceloading(24gCODm
–2
). In fact, these
areingoodagreementwiththePirtmaintenancetheory,statingthatmoresubstrate
will be used for maintenance purposes at lower substrate availability (Pirt 1965).
Compared with conventional activated sludge with a typical growth yield of 0.4 to
0.6gbiomassg
–1
COD(Droste1997),thetheoreticalmaximumgrowthyieldof
aerobicgranulesislow.Infact,thereisevidenceshowingthattheproductivityof
aerobicgranulesfellintoarangeof0.1to0.2gbiomassg
–1
COD (Pan 2003).
As discussed earlier, the rate of substrate utilization is well expressed as a Monod
equation, and can be used to describe the relationship between the bacterial growth
SOUR = 0.68q
s
R
2
= 0.99
0.0
0.5
1.0
1.5
2.0
0.0 0.5 1.0 1.5 2.0 2.5 3.0
q
s
(g COD m
–2
h
–1
)
SOUR (g O
2
m
–2
h
–1
)
FIGURE 7.11 Correlation of SOUR to q
s
.(FromLiu,Y.etal.2005.Appl Microbiol
Biotechnol 67:484–488.Withpermission.).
53671_C007.indd 120 10/29/07 7:18:27 AM
© 2008 by Taylor & Francis Group, LLC
© 2008 by Taylor & Francis Group, LLC
Growth Kinetics of Aerobic Granules 121
rate and the concentration of growth-limiting substrate. L. Liu et al. (2005) deter-
minedtheMonodkineticscoefcientsforaerobicgranulescultivatedfromglucose
substrateinanSBRoperatedatameancellresidencetimeof10days(table7.1).
Itcanbeseenthatbycomparingwithaconventionalactivatedsludgesystemandan
upowanaerobicsludgeblanket(UASB)reactor,theaerobicgranularsludgesystem
hadashorterstart-upperiod,highsubstrateutilizationrate,lesssurplussludgepro-
duction, and low efuent COD. These results further demonstrated the excellence of
aerobic granules for wastewater treatment.
Lubken, Schwarzenbeck, and Wilderer (2004) applied Activated Sludge Model
No.3(ASM3)todescribeanaerobicgranularsludgeSBRsystem.ASM3isamodel
FIGURE 7.12 Surface growth rate (µ
s
) versus substrate surface biodegradation rate (q
s
).
(FromLiu,Y.etal.2005.Appl Microbiol Biotechnol 67:484–488.Withpermission.)
TABLE 7.1
Kinetic Comparison of Aerobic Granules, Activated Sludge, and
Anaerobic Granules
Activated
Sludge
Anaerobic
Granules
from UASB
Aerobic
Granules
from SBR
Start-up period Several weeks 3 months Several days
MLSS (g L
–1
)
a
1–2 15–25 8
OLR (g COD L
–1
d
–1
)
b
0.5–1 10 4
Efuent COD (mg L
–1
) <40 >100 <30
Maximum specic substrate utilization rate (d
–1
) 2–10 0.9–3 23.65
Half-velocity coefcient (mg L
–1
) 15–70 100–250 3367.05
Growth yield coefcient (mg MLSS mg
–1
COD) 0.25–0.4 0.04–0.10 0.1927–0.2022
Bacteria decay rate coefcient (d
–1
) 0.04–0.075 0.02–0.04 0.00845–0.0135
a
MLSS, mixed liquor suspended solids.
b
OLR, organic loading rate.
Source: Data from L. Liu et al. 2005. Enzyme Microb Technol 36: 307–313.
53671_C007.indd 121 10/29/07 7:18:28 AM
© 2008 by Taylor & Francis Group, LLC
© 2008 by Taylor & Francis Group, LLC
122 Wastewater Purification
developed for the activated sludge process to simulate oxygen consumption, sludge
production, nitrication, and denitrication. However, it was shown that the model
couldalsobeusedforthesimulationofnutrientremovalwithaerobicgranularsludge
after adjusting some biological parameters. It was shown that this model can provide
a good control as well as the design basis for aerobic granular sludge reactors.
Figure 7.11 shows that the unit oxygen requirement of aerobic granules is
0.68gO
2
g
–1
CODoxidized.Inaconventionalactivatedsludgeprocess,theunit
oxygenuptakemayvaryoverawiderangeof0.21to0.54gO
2
g
–1
COD (Burkhead
andMcKinney1969).Forcomparison,itisassumedthataerobicgranuleswould
have a similar empirical formula to that of activated sludge, that is, C
5
H
7
NO
2
.Based
onthevaluesoftheunitoxygenuptakebyaerobicgranulesandthegrowthyieldof
aerobic granules as given earlier, it is possible to generate an oxidative assimilation
equation of aerobic granules grown on acetate, that is:
C
2
H
4
O
2
+1.36O
2
+0.1NH
3
n 0.1C
5
H
7
NO
2
+1.5CO
2
+1.52H
2
O (7.7)
Itappearsfromequation7.7that75%oftheinputacetatecarbonischanneledto
carbon dioxide-carbon during aerobic granular culture. The respirometric tests with
aerobicgranulesshowedthatabout74%ofacetate-carbonisconvertedtocarbon
dioxide,whichisfairlyconsistentwithequation7.7.Whenmoresubstrate-carbon
goes to carbon dioxide, less sludge is produced, that is, the input substrate can be
nally respired to carbon dioxide and water, resulting in a lower biomass produc
-
tion(equation7.7).Thehighercarbondioxideproductioninaerobicgranularculture
offersaplausibleexplanationforthelowergrowthyieldofaerobicgranules.
Basically, metabolism is the sum of biochemical transformation, which includes
interrelated catabolic and anabolic reactions; and the behavior of a microbial culture
is determined by catabolism and anabolism (Lehninger 1975). As discussed earlier,
aerobicgranuleshavealowgrowthyieldandhighcarbondioxideproduction.This
may imply that the energy generated from catabolism cannot be mainly used for the
growth of aerobic granules; and aerobic granules seem to expend energy on func
-
tions that are not readily growth-associated. One major difference between aerobic
granules and activated sludge is the highly organized three-dimensional structure of
theaerobicgranules(Tay,Liu,andLiu2001).Comparedwithlooseandnonorga
-
nized activated sludge, it is likely that, for aerobic granules, part of the energy gener
-
ated from the oxidation of organic substrate is used to maintain the highly organized
three-dimensional microbial structure and integrity of the aerobic granule, which in
turnleadstohighcarbondioxideproductionandthesubsequentlowgrowthyieldof
aerobicgranules.Inordertointerpretthelowgrowthyieldofabiolm,Y.Liuand
Tay (2001) proposed a hypothesis showing that the biolm community would have to
regulate its metabolic pathway so as to maintain its structural integrity and stability
through consuming nongrowth-associated energy.
According to Burkhead and McKinney (1969), the oxidative assimilation equa
-
tion of activated sludge grown on acetate can be roughly determined, that is:
C
2
H
4
O
2
+0.95O
2
+0.21NH
3
n 0.21C
5
H
7
NO
2
+ 0.95CO
2
+1.58H
2
O (7.8)
53671_C007.indd 122 10/29/07 7:18:28 AM
© 2008 by Taylor & Francis Group, LLC
© 2008 by Taylor & Francis Group, LLC
Growth Kinetics of Aerobic Granules 123
The above equation shows that 1 mol acetate oxidized by activated sludge requires
only0.95moloxygen,whiletooxidize1molacetatebyaerobicgranules,1.36mol
oxygen must be provided (equation 7.7). This implies that the oxygen requirement
in aerobic granular culture is almost 1.4-fold higher than that in the activated sludge
process.Intheaerobicoxidationprocess,ATPisgeneratedbyoxidativephosphory
-
lation,duringwhichprocesselectronsaretransportedthroughtheelectrontransport
system from an electron donor (substrate) to a nal electron acceptor (oxygen). More
-
over,aclearlinkageofoxygenreductiontoprotontranslocationhasbeenshown
(BabcockandWikstrom1992;Wolfe1993).Therefore,thehighunitoxygenuptake
byaerobicgranulesandlowgrowthyieldofaerobicgranulesseemtoindicatean
enhanced catabolic activity over anabolism, that is, more energy is generated, but
lessbiomassisproduced.Itappearsfromequations7.7and7.8thattheanabolism
ofactivatedsludgeishighlycoupledtoitscatabolism.However,asignicantdis
-
crepancy between the energy production by catabolism and the energy utilization by
anabolism occurs during aerobic granular culture. Equations 7.7 and 7.8 also show
that, for 1 mol acetate oxidized, 1.5 mol carbon dioxide are produced in aerobic
granular culture, while only 0.95 mol carbon dioxide is generated in activated sludge
culture.Infact,abnormallyhighcarbondioxideproductionisagoodindication
ofenergyuncouplinginaerobicsystems(RussellandCook1995).Inastudyon
the energy metabolism of
Saccharomyces cerevisiae, Lagunas (1976) found that
asmuchas60%oftheenergygeneratedfromcatabolismwasspentinfunctions
other than net biosynthesis, while it is reported that the provision of support matrices
withinmicrobialstructurecouldresultinhighmaintenanceenergy(Mayhewand
Stephenson 1997). Therefore, it is believed that the energy metabolism of aerobic
granulesisdissociatedand,tosomeextent,granulestructure-related.However,
further study is required to demonstrate the structure-energy metabolism relation
-
shipofaerobicgranulesfromboththeoreticalandexperimentalaspects.
7.4 SUBSTRATE CONCENTRATION-ASSOCIATED
KINETIC BEHAVIORS OF AEROBIC GRANULES
L. Liu et al. (2005) correlated the kinetic behaviors of aerobic granules to substrate
concentrationintermsofmilligramsCODperliter,andsomekeykineticconstants
were also determined. In general, the rate of substrate utilization is a function of
the biomass concentration as well as available substrate concentration for microbial
growth.InastudyofaerobicgranulationinSBRs,L.Liuetal.(2005)appliedthe
well-known Monod equation to describe the relationship between substrate utiliza
-
tion rate and substrate concentration. The maximum specic substrate utilization
ratewasestimatedas23.6mgCODmgMLSS
–1
day
–1
, while an extremely high
Monodconstantof3367mgL
–1
was obtained. This indicates that the afnity of
aerobic granules to substrates is low, that is, the biodegradation rate depends closely
onthemasstransferofmoleculesfromthebulksolutiontoaerobicgranules,as
discussed in chapter 8.
AccordingtoMetcalfandEddy(2003),thesubstrateutilizationrate(
U
s
)canbe
related to sludge retention time (
R)inawaysuchthat:
53671_C007.indd 123 10/29/07 7:18:29 AM
© 2008 by Taylor & Francis Group, LLC
© 2008 by Taylor & Francis Group, LLC
124 Wastewater Purification
1
Q
YU K
Sd
(7.9)
where
Y istheobservedgrowthyieldandK
d
is a decay rate coefcient. On the other
hand,
U
s
issubjecttoaMonod-typeequation:
U
kS
KS
SS
Xt
S
e
Se
e
0
(7.10)
where
k is the maximum value of U
s
, K
s
is the Monod constant, X is biomass concen-
tration,
t is time, S
0
and S
e
are initial and efuent substrate concentrations, respec-
tively. According to equation 7.9, the observed growth yield (
Y)andthemicrobial
decay rate coefcient (
K
d
) can be determined (table 7.2). It was found that U
s
was
much lower than its maximum value of 23.6 mg COD mg MLSS
–1
day
–1
.This
mayimplythattheaerobicgranularsludgeSBRhasagreaterpotentialtohandle
wastewater with higher COD concentration or organic loading rate (OLR) than was
appliedinthestudy(L.Liuetal.2005).
7. 5 A GENERAL MODEL FOR AEROBIC GRANULAR SLUDGE SBR
SuandYu(2006)developedageneralmodelforaerobicgranularsludgeSBR,
comprising reactor hydrodynamics, oxygen transfer, diffusion within granules, and
biologicalreactions.Inthisapproach,aerobicgranuleswereclassiedintovarious
fractionsaccordingtotheirsizes,andeachgranulewascomposedofanumberof
specic slices. The model development is based mainly on the following assump
-
tions:(1)theSBRisoperatedatsteadystate;aerobicgranulesaresphericalinshape
andhaveaconstantsizedistributioninonecycleofoperation;(2)theliquidphaseis
completelymixedintheSBR,andsuspendedocsareintegratedwithtinygranules;
(3)onlyradialdiffusionistakenintoaccountanditissubjecttoFick’slaw;(4)the
kineticconstantsanddensityofaerobicgranuleswithdifferentsizesareconstant;
(5)theeffectivediffusivityofasubstanceisconstant;and(6)nobiologicalreaction
TABLE 7.2
Kinetic Constants Determined from Aerobic Granular Sludge SBR
Time (days) 123456
S
0
(mg COD L
–1
) 559.7 560.8 564.0 560.3 561.5 558.9
S
e
(mg COD L
–1
) 27.5 30.7 27.0 24.1 27.2 25.6
X (g MLSS L
–1
) 7.56 7.59 7.57 7.6 7.61 7.6
Y (mg MLSS mg
–1
COD) 0.20 0.195 0.20 0.20 0.193 0.20
U
s
(mg COD mg
–1
MLSS d
–1
) 0.56 0.560 0.56 0.56 0.56 0.56
K
d
(d
–1
) 0.014 0.0093 0.013 0.012 0.0085 0.012
Source: Data from L. Liu et al. 2005. Enzyme Microb Technol 36: 307–313.
53671_C007.indd 124 10/29/07 7:18:31 AM
© 2008 by Taylor & Francis Group, LLC
© 2008 by Taylor & Francis Group, LLC
Growth Kinetics of Aerobic Granules 125
occursinlling,settling,anddecantingperiodsoftheSBRoperation.Itiswell
knownthatanSBRisadiscontinuousbiosystem,thatis,therearedynamicchanges
in both biomass and substrate concentrations within each operation cycle. This
seemstoimplythattherstassumptiongivenabovemightnotbevalid.Because
of different kinetic behaviors and physical properties of aerobic granules over sus
-
pendedocs,integrationofsuspendedocswithtinygranulessoundsunreasonable.
In addition, density of aerobic granules will vary with granule size, and cannot be
simply attributed to a constant regardless of size.
7. 5.1 DESCRIPTION OF SUBSTRATE UTILIZATION
SuandYu(2006)thoughtthatanSBRcanberegardedasaseriesofcontinuous
stirred tank reactor (CSTRs) in time sequence. In each CSTR, the hydraulic resident
timeis∆
t.ForaCSTRattimet, the inuent substrate concentration and efuent
substrate concentration are
S
i
(t -∆t)
and S
i
(t)
, respectively. A mass balance on substrate
gives equation 7.11.
SS k t
i
t
i
tt
i
t() ( ) ()
s
$
$
(7.11)
S
i
(0)
=S
i
o
for t =0
S
o
is the initial substrate concentration at the beginning of each cycle. In order to
estimate the reaction rate
k
i
(t),
S
i
(t)
is considered to be equal to S
i
(t - ∆t)
if ∆t was short
enough. The overall reaction rate of granule
i inthebulkliquidisthesumofthe
reactionratesofallslicesinallgranules:
kt k f f
i
mn
i
Vmn
n
N
Vm
m
()
,,, ,
¥
§
¦
¦
´
¶
µ
µ
¥
§
¦
¦
´
¶
µ
µ
¤
1
¤
1
M
(7.12)
where
N isthenumberofslicesforagranule,andM is the number of granule size
fractions,
f
V,m
and f
V,m,n
arethevolumefractionsofthegranulesbelongingtothemth
size fraction and those of the
nth slice. k
i
m,n
is the reaction rate of the nth slice of
granules with the
mth size fraction.
7. 5. 2 DESCRIPTION OF OXYGEN TRANSFER
The rates of gas-liquid oxygen transfer are assumed to be proportional to the differ-
ence in the oxygen concentration between gas and liquid interfaces, and the propor
-
tionalityfactorisgivenbythevolumetricoxygentransfercoefcient
k
L
B (Nicolella,
vanLoosdrecht,andHeijnen1998
).Ifoxygentransferredfromthegasphaseisequal
to that diffused into granules at the granule surface, then,
D
S
r
JkSS
e r R sur L gas sur
AAA
u
u
() (7.13)
where
S
gas
istheoxygenconcentrationinthegasphase,S
sur
is the oxygen concentra-
tiononthegranulesurface,equaltothatinbulkliquidwhentheliquid-solidoxygen
transfer resistance is ignored.
D
s
isthediffusioncoefcientofoxygeninwater.S is
53671_C007.indd 125 10/29/07 7:18:33 AM
© 2008 by Taylor & Francis Group, LLC
© 2008 by Taylor & Francis Group, LLC
126 Wastewater Purification
the oxygen concentration at the radius of r.J
sur
isoxygenuxonthegranulesurface,
and
B is the gas-liquid interfacial coefcient.
The volumetric oxygen transfer coefcient (
k
L
B)hasbeenfoundtobepropor-
tional to the gas holdup, which is affected by operating conditions and sludge char
-
acteristics, such as solid fraction and supercial gas velocity (
U
g
) (Nicolella, van
Loosdrecht, and Heijnen 1998):
kC(U10)C
L1
C
g
2
C
4
2
3
AEs& (7.14)
where
F is gas holdup, C
1
, C
2
, C
3
,andC
4
areconstants(SuandYu2005).Thus,oxy-
genconcentrationonthegranulesurfacecanbedeterminedandusedinthecalcula
-
tion of the oxygen proles within granules.
7. 5. 3 DESCRIPTION OF DIFFUSION OF SUBSTANCE
Aerobic granules can be classied into various size fractions. In various-sized aero-
bic granules, the substance concentration proles and reaction rates are different. In
theapproachbySuandYu(2006),granulesizeisclassiedinto
M fractions, and the
radiusofgranulesinthe
mth size fraction is expressed as follows:
RR m
RR
M
mM
m
¥
§
¦
´
¶
µ
min
max min
() , ,,,
1
2
21 121 (7.15)
where
R
min
and R
max
aretheminimumandmaximumradiusofthegranules,
respectively.
Based on the normal distribution of granule sizes, the frequency of granules for the
mth size fraction (f
num,m
) can be calculated from equation (7.16) (Su and Yu 2006):
f
A
R
e
num m
RR R
mmean
,
var
()/
var
2
22
2
P
(7.16)
where
R
m
is radius of the mth fraction calculated from equation 7.15, R
mean
is the
mathematical expectations,
R
var
is variance, and A isaconstant.Ifthesuspended
solids (SS) concentration and wet density (
S
w
)ofgranulesareknown,thevolume
fraction of the granules belonging to the
mth fraction is given by:
f
fR
fR
Vm
num m m
num m
m
M
m
,
,
,
¤
3
1
3
(7.17)
SuandYu(2006)appliedequation7.18todescribechangesinconcentra
-
tion of the substances (O
2
, S
S
,NH
4
+
,NO
3
-
)involvedinthebiologicalreactions.
Equation7.18isobtainedfromamassbalanceofsubstance
i for a slice of granule
in the
mth size fraction:
53671_C007.indd 126 10/29/07 7:18:35 AM
© 2008 by Taylor & Francis Group, LLC
© 2008 by Taylor & Francis Group, LLC
Growth Kinetics of Aerobic Granules 127
u
u
u
u
u
u
p
S
t
S
r
r
S
r
k
D
m
i
m
i
m
i
m
i
e
i
2
2
2
(7.18)
with the boundary conditions of:
SSatrR
m
i
sur
i
m
,
u
u
S
r
at r
m
i
m
i
0, D
where E
m
i
is the penetration depth of component i into the mth size fraction granules,
in which the gradient of component concentration vanishes by symmetry;
r is the
distance of the slice from the granule center. S
i
m
is the concentration of component
i at the distance of r,andS
i
sur
is the concentration of component i at the surface of
granule.
R
m
is the average radius of aerobic granules of one slice, which is the same
as in equation 7.16. Equation 7.18 is the central equation in the approach by Su and
Yu(2006),butinfactitissimilartothatproposedbyLiandLiu(2005).
IftheSBRisoperatedatsteadystate,andcanberegardedasaseriesofCSTRs,
the left-hand side of equation 7.18 becomes zero. In order to determine
E
m
i
, which
is essential for solving equation 7.18 numerically, Nicolella, van Loosdrecht, and
Heijnen(1998)proposedthatthesubstancetransitioncanbecharacterizedwitha
biological penetration rate (
C
m
i
):
B
m
i
e
i
sur
i
im
DS
kR
2
2
(7.19)
where
D
e
i
isthediffusioncoefcientofcomponenti inside aerobic granules, k
i
is the
reaction rate of component
i in aerobic granules, S
i
sur
is the concentration of compo-
nent
i at the surface of a granule whose average radius is R
m
.
For
C
m
i
<1,theithsubstanceispartiallypenetratedinagranulewithradiusof
mth size fraction (R
m
). Thus,
D
m
i
e
i
sur
i
i
DS
k
¥
§
¦
´
¶
µ
2
12
(7.20)
For
C
m
i
>1,theith substance is completely penetrated, that is, E
m
i
=0.The
granuleofthe
mth size fraction is taken as N slices. The concentrations of substances
withineachslicewasassumedtobeuniformovertheentirecrosssectionofthe
slice(SuandYu2006).Inthiscase,theconcentrationofsubstanceineachsliceof
granule can be calculated by equation 7.18, thus concentrations and their gradients
of substance
i in the nthsliceofthemthsize-fractiongranulearegivenbyS
m,n
i
and
∂S
m,n
i
/∂r,respectively.
53671_C007.indd 127 10/29/07 7:18:38 AM
© 2008 by Taylor & Francis Group, LLC
© 2008 by Taylor & Francis Group, LLC
128 Wastewater Purification
7. 5.4 DESCRIPTION OF BIOLOGICAL REACTIONS
Inconsiderationofthedifferencesbetweenaerobicgranulesandsludgeocs,Su
andYu(2006)slightlymodiedthegrowthrateinordertoaccommodatespecic
featuresofaerobicgranularsludgeSBRs.Asdiscussedinchapter8,oxygendiffu
-
sionisoftenalimitingfactorinaerobicgranules.SuandYu(2006)thoughtthat
the competition for oxygen would favor the growth of heterotrophic bacteria over
slow-growingnitrifyingbacteria,andsubsequentlythiswouldresultinalimitation
ofnitrication.AccordingtoSuandYu(2006),inordertoobtainalowerspecic
growth rate at a higher substrate concentration, the maximum specic growth rate
(μ
max,A
)ofautotrophicbacteriawouldbecorrectedbyreplacingµ
max,A
with µ
max,A
(t):
MM
max, max,
()
() ()
AA
PS t
tte
S
1
(7.21)
where
P
1
isaconstant.Forthemodiedmaximumgrowthrate,SuandYu(2006)
further proposed that the parameter values can be calibrated by the following objec
-
tive function:
Objective function
yy
y
measured simulated
m
()
2
eeasured
2
¤
(7.22)
where
y
measured
and y
simulated
are the measured and simulated values of parameters,
respectively.ThestudybySuandYu(2006)showedthattheproposedmodelsystem
couldprovideaprettygoodsimulationoftheperformanceofaerobicgranular
sludge SBRs.
7.6 CONCLUSIONS
The kinetic growth model developed from the linear phenomenological equation
candescribethegrowthofaerobicgranulesundervariousconditions.Thegrowthof
aerobicgranulesintermsofsizeandsize-dependentgrowthrateisinverselyrelated
to the shear force, but positively related to the organic loading rate, while substrate
N/COD ratio affects the growth kinetics of aerobic granules through change in the
microbial population. The effect of substrate surface loading rate on the microbial
surfacegrowthrateandbiodegradationratecanbedescribedbytheMonod-type
equation. The operation and performance of aerobic granular sludge SBRs can be
reasonably simulated by a combined diffusion-growth model.
REFERENCES
Atlas, R. M. and Bartha, R. 1998. Microbial ecology:Fundamentalsandapplications,4thed.
Menlo Park, CA: Benjamin/Cummings.
Babcock, G. T. and Wikstrom, M. 1992. Oxygen activation and the conservation of energy in
cell respiration.
Nature 356: 301–309.
Burkhead,C.E.andMcKinney,R.E.1969.Energyconceptsofaerobicmicrobialmetabolism.
ASCE J Sanitary Eng Division 95: 253–268.
53671_C007.indd 128 10/29/07 7:18:40 AM
© 2008 by Taylor & Francis Group, LLC
© 2008 by Taylor & Francis Group, LLC
Growth Kinetics of Aerobic Granules 129
Chen, S. Y. and Huang, S. Y. 2000. Shear stress effects on cell growth and L-DOPA production
by suspension culture of
Stizolobium hassjoo cellsinanagitatedbioreactor.Bioprocess
Eng 22: 5–12.
De Groof, S. R. and Mazur, P. 1962.
Nonequilibrium thermodynamics.Amsterdam:
North-Holland.
Droste R. L. 1997.
Theory and practice of water and wastewater treatment.NewYork:
John Wiley.
Garnkle,M.2002.Athermodynamic-probabilisticanalysisofdiversehomogeneous
stoichiometric chemical reactions.
J Phys Chem A 106: 490–497.
Gaudy, A. F. and Gaudy, E. T. 1980. Microbiology for environmental scientists and engineers.
New York: McGraw-Hill.
Gjaltema,A.,vanLoosdrecht,M.C.M.,andHeijnen,J.J.1997.Abrasionofsuspendedbiolm
pellets in airlift reactors: Effect of particle size.
Biotechnol Bioeng 55: 206–215.
Guiot,S.R.,Pauss,A.,andCosterton,J.W.1992.Astructuredmodeloftheanaerobic
granules consortium.
Water Sci Technol 25: 1–10.
Heijnen,J.J.andvanDijken,J.P.1992.Insearchofathermodynamicdescriptionof
biomass yields for the chemotropic growth of microorganisms.
Biotechnol Bioeng
39: 833–858.
Horn,H.,Reiff,H.,andMorgenroth,E.2003.Simulationofgrowthanddetachmentinbio
-
lmsystemsunderdenedhydrodynamicconditions.
Biotechnol Bioeng 81: 607–617.
Kwok, W. K., Picioreanu, C., Ong, S. L., van Loosdrecht, M. C. M., Ng, W. J., and Heijnen,
J. J. 1998. Inuence of biomass production and detachment forces on biolm structures
inabiolmairliftsuspensionreactor.
Biotechnol Bioeng 58: 400–407.
Lagunas, R. 1976. Energy metabolism of
Saccharomyces cerevisiae discrepancy between
ATP balance and known metabolic functions.
Biochim Biophys Acta 440: 661–674.
Lehninger, A. L. 1975. Biochemistry:
The molecular basis of cell structure and function,
2nded.NewYork:WorthPublishers.
Li, Y. and Liu, Y. 2005. Diffusion of substrate and dissolved oxygen in aerobic granule.
Biochem Eng J 24: 45–52.
Liu,L.,Wang,Z.,Yao,J.,Sun,X.,andCai,W.(2005)Investigationonthepropertiesand
kinetics of glucose-fed aerobic granular sludge.
Enzyme Microb Technol 36: 307–313.
Liu,Q.S.,Liu,Y.,Tay,J.H.,andShow,K.Y.2005.Responsesofsludgeocstoshear
strength.
Process Biochem 40: 3213–3217.
Liu,Y,andTay,J.H.2001.Metabolicresponseofbiolmtoshearstressinxed-lmculture.
J Appl Microbiol 90: 337–342.
Liu,Y.andTay,J.H.2002.Theessentialroleofhydrodynamicshearforceintheformation
ofbiolmandgranularsludge.
Water Res 36: 1653–1665.
Liu,Y.,Lin,Y.M.,Yang,S.F.,andTay,J.H.2003.Abalancedmodelforbiolmsdeveloped
at different growth and detachment forces.
Process Biochem 38: 1761–1765.
Liu,Y.,Liu,Y.Q.,Wang,Z W.,Yang,S.F.,andTay,J.H.2005.Inuenceofsubstrate
surface loading on the kinetic behaviour of aerobic granules. Appl Microbiol Biotechnol
67: 484–488.
Lubken,M.W.M.,Schwarzenbeck,N.,andWilderer,P.A.2004.Sequencingbatchreactor
technologies. In Proceedings of SBR3 Conference, February 22–26, 2004, Queensland,
Australia.
Mayhew,M.andStephenson,T.1997.Lowbiomassyieldactivatedsludge:Areview.
Environ
Technol 18: 883–892.
Meijer, J. J., Tenhoopen, H. J. G., Luyben, K., and Libbenga, K. R. 1993. Effects of hydro-
dynamicstressonculturedplant-cells:Aliteraturesurvey.
Enzyme Microb Technol
15: 234–238.
53671_C007.indd 129 10/29/07 7:18:40 AM
© 2008 by Taylor & Francis Group, LLC
© 2008 by Taylor & Francis Group, LLC
130 Wastewater Purification
Metcalf and Eddy, 2003.
Wastewater engineering: Treatment and reuse,4thed.,revised
by George Tchobanoglous, Franklin L. Burton, and H. David Stensel. Boston:
McGraw-Hill.
Moy,B.Y.P.,Tay,J.H.,Toh,S.K.,Liu,Y.,andTay,S.T.L.2002.Highorganicloading
inuencesthephysicalcharacteristicsofaerobicsludgegranules.
Lett Appl Microbiol
34: 407–412.
Nicolella,C.,vanLoosdrecht,M.C.M.,andHeijnen,J.J.1998.Masstransferandreaction
inabiolmairliftsuspensionreactor.
Chem Eng Sci 53: 2743–2753.
Pan, S. (2003) Inoculation of microbial granular sludge under aerobic conditions. Ph.D.
thesis, Nanyang Technological University, Singapore.
Pirt,S.J.1965.Themaintenanceenergyofbacteriaingrowingcultures.
Proc. Royal Soc.
London Ser B 163: 224–231.
Prigogine, I. 1967.
Introduction to the thermodynamics of irreversible processes.NewYork:
Wiley-Interscience.
Russell, J. B. and Cook, G. M. 1995. Energetics of bacterial growth: Balance of anabolic and
catabolic reactions.
Microbiol Rev 59: 48–62.
Rutgers,M.,Balk,P.A.,andVandam,K.1989.Effectofconcentrationofsubstratesand
products on the growth of
Klebsiella pneumoniae in chemostat cultures. Biochim
Biophys Acta 977: 142–149.
Sponza, D. T. 2001. Anaerobic granule formation and tetrachloroethylene (TCE) removal
in an upow anaerobic sludge blanket (UASB) reactor.
Enzyme Microb Technol
29: 417–427.
Su,K.Z.andYu,H.Q.2005.Gasholdupandoxygentransferinanaerobicgranule-based
sequencing batch reactor.
Biochem Eng J 25: 201–207.
Su,K.Z.andYu,H.Q.2006.Ageneralizedmodelforaerobicgranule-basedsequencing
batch reactor. I. Model development.
Environ Sci Technol 40: 4703–4708.
Tay,J.H.,Liu,Q.S.,andLiu,Y.2001.Microscopicobservationofaerobicgranulationin
sequential aerobic sludge blanket reactor.
J Appl Microbiol 91: 168–175.
Tempest, D. W. and Neijssel, O. M. 1978. Eco-physiological aspects of microbial growth in
aerobic nutrient-limited environments.
Adv Microb Ecol 2: 105–153.
Tijhuis,L.,Hijman,B.,vanLoosdrecht,M.C.M.,andHeijnen,J.J.1996.Inuenceofdetach
-
ment, substrate loading and reactor scale on the formation of biolms in airlift reactors.
Appl Microbiol Biotechnol 45: 7–17.
Trinet,F.,Heim,R.,Amar,D.,Chang,H.T.,andRittmann,B.E.1991.Studyofbiolm
and uidization of bioparticles in a three-phase liquid-uidized-bed reactor.
Water Sci
Technol 23: 1347–1354.
vanLoosdrecht,M.C.M.,Eikelboom,D.,Gjaltema,A.,Mulder,A.,Tijhuis,L.,andHeijnen,
J. J. 1995. Biolm structures.
Water Sci Technol 32: 35–43.
Wolfe, S. L. 1993.
Molecular and cellular biology. Belmont, CA: Wadsworth.
Yang, S. F., Tay, J. H., and Liu, Y. 2004. Respirometric activities of heterotrophic and nitrify-
ing populations in aerobic granules developed at different substrate N/COD ratios.
Curr Microbiol 49: 42–46.
Yang,S.F.,Tay,J.H.,andLiu,Y.2005.Effectofsubstratenitrogen/chemicaloxygendemand
ratio on the formation of aerobic granules.
J Environ Eng 131: 86–92.
Yang,S.F.,Liu,Q.S.,Tay,J.H.,andLiu,Y.2004.Growthkineticsofaerobicgranules
developedinsequencingbatchreactors.
Lett Appl Microbiol 38: 106–112.
53671_C007.indd 130 10/29/07 7:18:41 AM
© 2008 by Taylor & Francis Group, LLC
© 2008 by Taylor & Francis Group, LLC