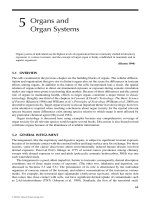
WETLAND AND WATER RESOURCE MODELING AND ASSESSMENT: A Watershed Perspective - Chapter 5 doc
Bạn đang xem bản rút gọn của tài liệu. Xem và tải ngay bản đầy đủ của tài liệu tại đây (1.22 MB, 16 trang )
Part II
Wetland Hydrology
and Water Budget
© 2008 by Taylor & Francis Group, LLC
43
5
Change in the Southern
U.S. Water Demand
andSupplyoverthe
Next Forty Years
Steven G. McNulty, Ge Sun, Erika C. Cohen,
and Jennifer A. Moore Myers
5.1 INTRODUCTION
Water shortages are often considered a problem in the western United States, where
water supply is limited compared to the eastern half of the country. However, peri-
odic water shortages are also common in the southeastern United States due to high
water demand and periodic drought. Southeastern U.S. municipalities spend billions
of dollars to develop water storage capacity as a buffer against periodic drought.
Buffers against water shortage include the development of water reservoirs and well
excavation to mine ancient aquifers. It is important to have good estimates of future
water supply and demand to prevent wasting money by creating more reservoir
capacity than is needed by a community. Conversely, a lack of water reserve capac-
ity can lead to the need for water restrictions.
Many factors impact the amount of water that is available and the amount of
water that is required by a community. Precipitation is the major determinant of
water availability over the long term. In addition to precipitation, air temperature
and land cover also impact water availability by modifying how much precipitation
is evaporated and transpired back into the atmosphere. Finally, ancient aquifers pro-
vide a signicant proportion of needed water in some parts of the southern United
States such as Texas and Arkansas. The water recharge rates for deep aquifers are
very low (i.e., hundred of years), so water is essentially mined from these areas.
There are also several factors that control water demand. In addition to residential
water use, a great deal of water is also required by industry, irrigated farming, and
the energy production sectors. In total, domestic and commercial sectors account for
only 5% of the surface water use and 10% of the groundwater use. The other 95%
and 90% of the surface and groundwater are used by other sectors of the economy.
Thermoelectric power generation uses 50% of the surface water, and crop irrigation
and livestock use 67% of the groundwater. Not all of the water that is used by each
sector is lost to the atmosphere; much is quickly returned to the environment to be
used again and again. The proportion of returned water varies from 98% from the
thermoelectric sector to a 39% return rate from the irrigation and livestock sectors.
© 2008 by Taylor & Francis Group, LLC
44 Wetland and Water Resource Modeling and Assessment
Communities need to accurately assess future water supply and demand if water
limitations are to be minimized. However, estimates of average annual water sup-
ply and demand will be of limited use in water planning. Water shortages generally
only occur during extreme event years such as when water supply may be limited
by drought or when water demand is high due to drought and high air temperature.
Therefore, this paper examines the sensitivity of the individual factors that inuence
regional water supply and demand across a range of environmental variability. Some
factors such as population are relatively stable from one year to the next, while other
variables such as climate can be markedly different among years. Groundwater with-
drawal may be relatively stable until the supply is depleted. We will determine how
much each variable is likely to inuence annual water supply stress and the extent to
which water supply stress may vary between 1990 and 2045.
5.2 METHODS
Water supply and demand are the two components required to assess regional water
stress. We will rst dene the variables needed to calculate each water supply stress
component and then examine how the variables change from year to year.
5.2.1 CALCULATIONS FOR ESTIMATING WATER SUPPLY
We dene water availability as the total potential water supply available for with-
drawal for each eight-digit hydrologic unit code (HUC) watershed, expressed in the
following formula (equation 5.1):
WS = P − ET + GS + ∑RF
i
(5.1)
where WS = water supply in millions of gallons for each watershed per year; P =
precipitation for each watershed in cm per year; ET= watershed evapotranspiration
for each watershed in cm per year, calculated by an empirical formula as a function
of potential evapotranspiration, precipitation, and land cover types; and GS = his-
toric groundwater use in millions of gallons for each watershed per year. Detailed
methods are found in Sun et al. (2005).
Most of the water removed for human use is returned to the environment as return
ow (RF). We used RF estimates from each of seven water use sectors (WU
i
)
including domestic, commercial, irrigation, thermoelectric, industrial mining, and
livestock sectors, which were reported by the USGS (United States Geological Sur-
vey 1994). The RF was calculated as the historical return ow rate (RFR), expressed
as a fraction of the amount of removed water that was returned to the ecosystem,
multiplied by the total water use (WU) for each sector, expressed in millions of gal-
lons per year for each watershed.
5.2.2 GROUNDWATER SUPPLY DATA
The USGS has published estimates of national water use since 1950 (Solley et
al. 1998). The groundwater term (GS) is the 1990 estimate of groundwater use in
© 2008 by Taylor & Francis Group, LLC
Change in the Southern U.S. Water Demand and Supply 45
millions of gallons of water per year for each eight-digit hydrologic unit code (HUC)
watershed. Groundwater is dened as the saturated zone below the subsurface (Sol-
ley et al. 1993). The 1990 groundwater supply estimate was incorporated into the
1990 baseline year, 2020 wet year, and 2024 dry year water supply stress scenarios.
The groundwater term was dropped for the 2043 dry year and 2045 wet year sce-
narios to examine the implications of a lack of groundwater availability on water
supply stress.
5.2.3 HISTORIC AND PROJECTED CLIMATE DATA
The U.K. Hadley Climate Research Center HadCM2Sul climate change scenario
was used to project climate between 1990 and 2045. The southern United States is
expected to become generally warmer and wetter under the HadCM2Sul scenario.
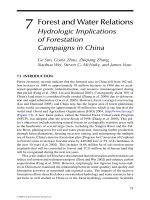
We compared the impact of a future hot and dry year (Figures 5.1a and 5.1b) and a
0 87.5 175 350 525 700
Miles
Degrees Celsius
20–25
12–16
16–20
Average Air Temperature
Hadley Climate Scenario
Dry Year: 2043
N
5.1b
FIGURE 5.1 Predicted hot and dry year (e.g., 2043) precipitation (a) and air temperature
(b) distribution, and predicted cool and wet year (e.g., 2045) precipitation (c) and air temperature
(d) distribution.
© 2008 by Taylor & Francis Group, LLC
0 80 160 320 480 640
Miles
in mm
1500–1609
1000–1500
500–1000
< 500
Precipitation
Hadley Climate Scenario
Dry Year: 2043
N
5.1a
46 Wetland and Water Resource Modeling and Assessment
future cool and wet year (Figures 5.1c and 5.1d) with average (circa 1990) historic
climate to assess how changes in air temperature and precipitation will impact water
supply stress. The climate data were gridded at 0.5
o
by 0.5
o
(about 50 km × 75 km)
across the continental U.S. (Kittel et al. 1997). Next, 1990 climate data were subset
and scaled to the 666 corresponding 8-digit HUC watersheds covering Virginia to
Texas (USGS 1994). The same process was repeated for other years used in the water
supply stress scenarios. Mean air temperature for 1990 was 24.29°C, while HadC-
M2Sul predicts 24.36°C for 2024 and 22.69°C for 2045. Mean precipitation for 1990
was 96.45 cm; HadCM2Sul predicts mean annual values of 78.07 cm for 2024 and
116.68 cm for 2045.
5.2.4 HISTORIC LAND COVER AND LAND USE DATA
Land cover data were used to drive the water yield model for all seven water use
sectors and each of the 666 8-digit HUC watersheds modeled in this study. The
0 80 160 320 480 640
Miles
in mm
1500–2000
2000–2669
1000–1500
500–1000
< 500
Precipitation
Hadley Climate Scenario
Wet Year: 2045
N
5.1c
0 87.5 175 350 525 700
Miles
20–25
12–16
< 12
16–20
Average Air Temperature
Hadley Climate Scenario
Dry Year: 2045
N
5.1d
FIGURE 5.1 (Continued)
© 2008 by Taylor & Francis Group, LLC
Degrees Celsius
Change in the Southern U.S. Water Demand and Supply 47
1992 Multi-Resolution Land Characterization (MRLC) land cover/land use dataset
() was used to calculate the percentage of each vegetation type
within each watershed. Land cover was aggregated into ve classes including ever-
green forest, deciduous forest, crops, urban areas, and water. In this analysis, land
use was held constant throughout the assessment period.
5.2.5 HISTORIC AND PROJECTED POPULATION DATA
Approximately 100 million people live in the 13 southern states (U.S. Census 2002).
Population projections at the census block level are available to 2050 (NPA Data
Services 1999). We aggregated predicted census block–level population data to the
watershed level for each year between 2000 and 2045. Between 1990 and 2045, the
population of the 13 southern states was predicted to increase by 94% (NPA Data
Services 1999). No new areas of growth within the region were projected, but current
urban centers are expected to expand. Rural areas are generally expected to become
more densely populated. However, population growth between 1990 and 2045 will
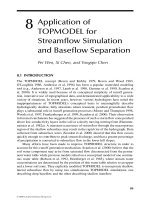
not be uniform (Figure 5.2a); percentage change in population between 1990 and
2045 varied from −21% to +602% across the region (Figure 5.2b).
5.2.6 CALCULATIONS FOR ESTIMATING WATER DEMAND
Water demand is as important as water supply in determining if a community is
likely to experience recurrent water shortages. Water demand (WD) represents the
sum of all water use (WU) by each of the seven water use sectors within a watershed
(equation 5.2):
WD = ∑WU
i
i = 1 − 7 (5.2)
Annual domestic water use (DWU) for each watershed was predicted by correlat-
ing USGS historical water use (in millions of gallons per day per watershed) for the
domestic water use sector with watershed population (P, in thousand persons) for the
years 1990 and 1995 (equation 5.3):
DWU = 0.008706 * P + 1.34597 R
2
= 0.51, n = 666 (5.3)
Similarly, irrigation water use (IWU) for each watershed was derived by correlating
USGS historical irrigation water use (in millions of gallons per day per watershed)
with the irrigation area (IA, in thousands of acres) for the years 1990 and 1995
(equation 5.4):
IWU = 1.3714 * IA + 2.06969 R
2
= 0.67, n = 666 (5.4)
Currently, we do not have water use models for the other ve sectors (i.e., commer-
cial, industrial, livestock, mining, and thermoelectric), therefore historic water use
data were utilized for future periods.
© 2008 by Taylor & Francis Group, LLC
48 Wetland and Water Resource Modeling and Assessment
5.2.7 CALCULATIONS FOR ESTIMATING THE WATER SUPPLY STRESS INDEX (WASSI)
We have dened a water supply stress index (WASSI) by dividing water supply by
water demand (equation 5.5). Comparing the WASSI between two points in time
results in a WASSI ratio (WASSIR, equation 5.6). The WASSI was used to quantita-
tively assess the relative magnitude in water supply and demand at the 8-digit HUC
watershed scale. The WASSIR was used to assess the relative change in the WASSI
between the baseline scenario (SI
1
) and one of the other scenarios (SI
x
) described
later. Positive WASSIR values indicate increased water stress and negatives values
indicate reduced water stress compared to historical conditions (scenario 1):
Data Sources:
NPA Population Projections
USGS Eight-Digit HUC
Boundries
0 85 170 340 510 680
Miles
300%–602%
100%–300%
50%–100%
0%–50%
–21%–0%
Percent Change in Population
Hadley Climate Scenario
1990 to 2045
N
5.2b
FIGURE 5.2 The spatial and temporal change in southern U.S. population between 1990
and 2045 expressed as absolute change (a) and percentage change (b).
© 2008 by Taylor & Francis Group, LLC
Data Sources:
NPA Population Projections
USGS Eight-Digit HUC
Boundries
0 85 170 340 510 680
Miles
1000–5714
500–1000
250–500
0–250
–2–0
Population Change
1990 to 2045
N
5.2a
Change in the Southern U.S. Water Demand and Supply 49
(5.5)
and
(5.6)
where x represents one of six simulation scenarios described below.
5.2.8 WATER SUPPLY STRESS SCENARIOS
Six scenarios were developed, each examining the impacts of changing population,
climate, and ground water supply on annual WASSI values. Changes in the water
supply portion of the WASSI term were addressed in three ways. First, we chose
two dry years (2024 and 2043) and two wet years (2020 and 2025) to compare to
the historic climate base year of 1990. Second, ground water is a nite resource and
given the current rate of usage, it is possible that ground water may be completely
depleted in some areas during the next 40 years. We tested the impact of the loss of
ground water supply on water supply stress by examining wet and dry years with and
without ground water inputs into the WASSI model. Finally, population impacts on
water supply stress were examined by comparing wet and dry years in the 2020s and
2040s with the baseline water supply stress year (i.e., 1990).
5.2.8.1 Scenario 1: Small Population Increase—Wet Year (2020)
This scenario used 2020 population projections that predicts above average precipi-
tation for the region compared to 1990 values. Groundwater withdrawal was held
constant at 1990 levels.
5.2.8.2 Scenario 2: Small Population Increase—Dry Year (2024)
This scenario used 2024 population projections. 2024 is predicted to have below
average precipitation compared to 1990 levels, thus decreasing water supply. Ground-
water withdrawal was held constant at 1990 levels.
5.2.8.3 Scenario 3: Large Population Increase—Wet Year (2045)
This scenario used 2045 population projections, and it is predicted to have above
average precipitation compared to 1990 levels. Groundwater withdrawal was held
constant at 1990 levels.
5.2.8.4 Scenario 4: Large Population Increase—Dry Year (2043)
This scenario used 2043 population projections, that is predicted to have below aver-
age precipitation compared to 1990 levels. Groundwater withdrawal was held con-
stant at 1990 levels.
© 2008 by Taylor & Francis Group, LLC
WASSI
WD
WS
x
x
x
=
WASSIR
WASSI WSS
WASSI
x
x
=
−
1
1
50 Wetland and Water Resource Modeling and Assessment
5.2.8.5 Scenario 5: Large Population Increase—Wet Year
(2045), No Groundwater Supply (GS)
This scenario used 2045 population projections that is predicted to have above aver-
age precipitation compared to 1990 levels. However, groundwater supplies may be
exhausted in some areas by 2045. Therefore, we removed groundwater for the entire
region as a water supply source to the WASSI model in this scenario.
5.2.8.6 Scenario 6: Large Population Increase—Dry Year
(2043), No Groundwater Supply (GS)
This scenario used 2043 population projections that is predicted to have below aver-
age precipitation compared to 1990 levels. In addition to the increased population
and below average year precipitation, the groundwater supply was removed from the
WASSI model across the region in this scenario.
5.3 RESULTS AND DISCUSSION
The results section is divided into three parts: (1) climate controls on water supply
stress, (2) population and other water use sector controls on water supply stress, and
(3) ground water supply controls on water supply stress.
5.3.1 CLIMATE CONTROLS ON THE WASSI
Historically, annual precipitation and air temperature vary widely across the region:
central Texas averages less than 70 cm of precipitation per year, while parts of the
Gulf coast and southern Appalachians receive almost 200 cm. Average annual air
temperature is roughly inversely proportional to latitude within the region. Annual
precipitation and air temperature are the most important determinants of water loss
by evapotranspiration and thus water yield across the southern United States (Lu
et al. 2003). Therefore, the Appalachians and the Gulf coast had the highest water
availability, while the lowest was found in semiarid western Texas.
Irrigation and thermoelectric sectors were the two largest water users, followed
by domestic livestock and industrial users. Consequently, the western Texas region,
which had a lot of irrigated farmland and limited water supplies, had the highest
WASSI for both wet and dry years (Figures 5.3a–d). Other areas with WASSI values
indicating stress included southern Florida, southern Georgia, and Mississippi valley
areas with a high percentage of irrigated land (relative to the total land area). Several
isolated watersheds in high-precipitation regions east of the Mississippi River also
showed high water stress, primarily due to thermoelectric water use.
Compared to the baseline conditions of 1990, the WASSI in 2020 (Figure 5.3a)
and 2045 (not shown) were projected to decrease due to a moderate increase in air
temperature and a large increase in precipitation. The WASSI in 2024 (Figure 5.3b)
was projected to increase due to a moderate temperature increase and moderate
decrease in precipitation compared to 1990 levels. As a result, the average regional
WASSIR value (compared to 1990) decreased by 5% during the wet year of 2020
(Figure 5.3c), but increased by 22% for the dry year of 2024 (Figure 5.3d) and 66%
© 2008 by Taylor & Francis Group, LLC
Change in the Southern U.S. Water Demand and Supply 51
for the dry year of 2043 (not shown). The WASSIR again decreased for the dry year
of 2045 by 4% (not shown).
5.3.2 POPULATION AND OTHER WATER USE SECTOR CONTROLS ON THE WASSI
Water demand by the domestic water use sector is directly related to population,
as demonstrated in Equation 5.3. Population centers that are projected to expand
dramatically over the next 40 years (e.g., Atlanta, Georgia; Dallas, Texas; Raleigh-
Durham, North Carolina; and northern Virginia) will see up to 200% increases in
domestic water use. Therefore, population growth may be responsible for increasing
the WASSI by more than 70% in watersheds containing relatively large increases in
population, but population change will have little impact (<5%) on the regional-scale
WASSI.
Data Sources:
AET Model (Zhang et al.)
NPA Population Projections
USGS Eight-Digit HUC Boundaries
USGS Water Supply Records
0
N
85 170 510340 680
Miles
Increasing
Stress
1.00–1.98
0.50–1.00
0.10–0.50
0.05–0.10
0.00–0.05
Water Supply Stress Index
Hadley Climate Scenario
Wet Year: 2020
5.3a
Data Sources:
AET Model (Zhang et al.)
NPA Population Projections
USGS Eight-Digit HUC Boundaries
USGS Water Supply Records
0
N
85 170 510340 680
Miles
Increasing
Stress
2.00–2.15
0.50–1.00
1.00–2.00
0.10–0.50
0.05–0.10
0.00–0.05
Water Supply Stress Index
Hadley Climate Scenario
Dry Year: 2024
5.3b
FIGURE 5.3 Climate change impacts on the southeastern U.S. water supply stress (WASSI)
during the wet year of 2020 (a) and the dry year of 2024 (b). Change in the water supply stress
ratio (WASSIR) between the 1990 baseline WASSI and the wet year WASSI of 2020 (c) and
the dry year WASSI of 2024 (d).
© 2008 by Taylor & Francis Group, LLC
52 Wetland and Water Resource Modeling and Assessment
The mean regional WASSI increased from 0.11 (Figure 5.4a) to 0.12 (Figure 5.4b),
despite a 30% increase in southeastern U.S. population between 2024 and 2043. Pop-
ulation changes had little impact on the WASSI when compared to that of the inter-
annual variation in climate and potential loss of groundwater reserves. A doubling of
local populations around metropolitan areas will have a limited impact on interan-
nual WASSI variability. Even in heavily populated areas, residential and commer-
cial water use represent small segments of total water demand, but cities do affect
water quality. As the population increases, costs for water treatment and acquisition
increase; water conservation may be important for reasons other than water supply.
Other sectors, such as hydroelectric power generation, use much more water
than other sectors but also recycle approximately 98% of the water that is used. In
contrast, the irrigated farming sector uses a large share of the total water supply
while returning only approximately 68% of the water back to the land; the rest is lost
to evaporation.
Data Sources:
AET Model (Zhang et al.)
NPA Population Projections
USGS Eight-Digit HUC Boundaries
USGS Water Supply Records
0
N
85 170 510340 680
Miles
Increasing
Stress
50%–65%
0%–50%
–52%–0%
Percent Change in Water Supply Stress Index Ratio
Hadley Climate Scenario
Wet Year: 2020
5.3c
Data Sources:
AET Model (Zhang et al.)
NPA Population Projections
USGS Eight-Digit HUC Boundaries
USGS Water Supply Records
0
N
85 170 510340 680
Miles
Increasing
Stress
150%–195%
100%–150%
50%–100%
0%–50%
–50%–0%
Percent Change in Water Supply Stress Index Ratio
Hadley Climate Scenario
Wet Year: 2020
5.3d
FIGURE 5.3 (Continued)
© 2008 by Taylor & Francis Group, LLC
Change in the Southern U.S. Water Demand and Supply 53
5.3.3 GROUND WATER SUPPLY CONTROLS ON THE WASSI
The loss of the groundwater resource can have severe implications for the WASSI in
some areas where groundwater represents a major source of the water supply. By the
2040s, it is likely that areas with limited aquifer reserves and heavy groundwater use
will begin to run out of groundwater. In our study, we expected loss of groundwater
to have a severe impact on the WASSI during the dry year of 2043 (Figure 5.5a). It
was somewhat surprising that even during the projected wet year of 2045, severe
water stress would occur over much of the region without groundwater (Figure 5.5b).
The water supply stress index ratio (WASSIR) increased by 232% between the base-
line year of 1990 and the dry, no groundwater year of 2043 (Figure 5.5c). Even for
the wet year/no groundwater scenario of 2045, the WASSIR difference between 1990
and the dry years without groundwater (i.e., 2024 and 2043) was 119% (Figure 5.5d).
Data Sources:
AET Model (Zhang et al.)
NPA Population Projections
USGS Eight-Digit HUC Boundaries
USGS Water Supply Records
0
N
85 170 510340 680
Miles
Increasing
Stress
2.00–2.15
0.50–1.00
1.00–2.00
0.10–0.50
0.05–0.10
0.00–0.05
Water Supply Stress Index
Hadley Climate Scenario
Dry Year: 2024
5.4a
Data Sources:
AET Model (Zhang et al.)
NPA Population Projections
USGS Eight-Digit HUC Boundaries
USGS Water Supply Records
0
N
85 170 510340 680
Miles
Increasing
Stress
Percent Change in Water Supply Stress Index Ratio
Hadley Climate Scenario
Dry Year: 2043
150%–200 %
200%–348 %
100%–150 %
50%–100%
0%–50%
–50%–0%
5.4b
FIGURE 5.4 Population change impacts on the southeastern U.S. water supply stress
(WASSI) during a dry year in 2024 (a) and a dry year in 2043 (b). Change in the water supply
stress ratio (WASSIR) between 1990 and the two dry years of 2043 (c) and 2024 (d).
© 2008 by Taylor & Francis Group, LLC
54 Wetland and Water Resource Modeling and Assessment
Land use planners should carefully review the implication of groundwater loss on
local economies and consider converting land area from higher to lower water-con-
suming practices (e.g., reduce irrigated acreage) or the use of water transport systems
to replace exhausted aquifers. Even the most optimistic estimates of climate change
and increased precipitation will not likely alleviate future water stress, should aqui-
fers run dry.
5.4 SUMMARY
This paper explored the likely impacts of climate, population, and groundwater sup-
ply on interannual water supply stress across the southeastern United States during
the next 40 years. We found that predicted climate variability will have the largest
impact on the water supply stress. However, the current WASSI model does not carry
water reserves or decits from one year to the next. There is no drawdown of water
reservoir capacity as would occur during a prolonged drought. Similarly, there is no
Data Sources:
AET Model (Zhang et al.)
NPA Population Projections
USGS Eight-Digit HUC Boundaries
USGS Water Supply Records
0
N
85 170 510340 680
Miles
Increasing
Stress
Percent Change in Water Supply Stress Index Ratio
Hadley Climate Scenario
Dry Year: 2043
150%– 00%
200%–348%
100%–150%
50%–100%
0%–50%
–50%–0%
5.4c
Data Sources:
AET Model (Zhang et al.)
NPA Population Projections
USGS Eight-Digit HUC Boundaries
USGS Water Supply Records
0
N
85 170 510340 680
Miles
Increasing
Stress
Percent Change in Water Supply Stress Index Ratio
Hadley Climate Scenario
Dry Year: 2024
150%–195%
100%–150%
50%–100%
0%–50%
–50%–0%
5.4d
FIGURE 5.4 (Continued)
© 2008 by Taylor & Francis Group, LLC
Change in the Southern U.S. Water Demand and Supply 55
reserve water capacity to compensate for water shortfalls during a drought. There-
fore, the current WASSI model could overestimate the impact of short-term droughts
because water decits could be offset by water reservoirs.
Watersheds receiving limited precipitation and with a heavy dependence on
groundwater will be the most susceptible to chronic and potentially permanent water
shortages. Water use managers should expect even more stress in large population
centers. Less-populated areas that had little water shortage problems in the past may
also face water stress issues under changes in global and regional climate. However,
future climate change–induced precipitation patterns remain uncertain, especially
in the eastern United States, and thus realistically predicting future water stress
remains a challenge.
Data Sources:
AET Model (Zhang et al.)
NPA Population Projections
USGS Eight-Digit HUC Boundaries
USGS Water Supply Records
0
N
85 170 510340 680
Miles
Increasing
Stress
2.00–24.25
0.50–1.00
1.00–2.00
0.11–0.50
0.06–0.10
0.00–0.05
Water Supply Stress Index
Hadley Climate Scenario without Groundwater
Dry Year: 2043
5.5a
Data Sources:
AET Model (Zhang et al.)
NPA Population Projections
USGS Eight-Digit HUC Boundaries
USGS Water Supply Records
0
N
85 170 510340 680
Miles
Increasing
Stress
2.00–21.44
0.50–1.00
1.00–2.00
0.10–0.50
0.05–0.10
0.00–0.05
Water Supply Stress Index
Hadley Climate Scenario without Groundwater
Dry Year: 2045
5.5b
FIGURE 5.5 Climate change impacts on the southeastern U.S. water supply stress (WASSI)
during the dry year 2043 if no groundwater were available (a) and the wet year of 2045 with
no available groundwater (b). Change in the water supply stress ratio (WASSIR) between
1990 and the dry year of 2043 if no groundwater were available (c) and the wet year of 2045
with no available groundwater (d).
© 2008 by Taylor & Francis Group, LLC
56 Wetland and Water Resource Modeling and Assessment
ACKNOWLEDGMENTS
Funding for this work was provided by the U.S. Department of Agriculture Forest
Service Southern Global Change Program in Raleigh, North Carolina. The authors
thank Corey Bunch for programming support.
REFERENCES
Brown, R. A., N. J. Rosenberg, and R. C. Izarraulde. 1999. Responses of U.S. regional water
resources to CO
2
-fertilization and Hadley center climate model projections of green-
house-forced climate change: A continental scale simulation using the HUMUS model.
Richland, WA: Pacic Northwest National Laboratory.
Kittel, T. G. F., J. A. Royle, C. Daly, N. A. Rosenbloom, W. P. Gibson, H. H. Fisher, D. S. Schimel,
L. M. Berliner, and VEMAP2 Participants. 1997. A gridded historical (1895–1993) biocli-
mate dataset for the conterminous United States. In Proceedings of the 10th Conference
on Applied Climatology. Boston, MA: American Meteorological Society, 219–222.
Data Sources:
AET Model (Zhang et al.)
NPA Population Projections
USGS Eight-Digit HUC Boundaries
USGS Water Supply Records
0
N
85 170 510340 680
Miles
Increasing
Stress
Percent Change in Water Supply Stress Index Ratio
Hadley Climate Scenario without Groundwater
Dry Year: 2043
150%–200%
200%–1000%
1000%–1869%
100%–150%
50%–100%
0%–50%
–21%–0%
5.5c
Data Sources:
AET Model (Zhang et al.)
NPA Population Projections
USGS Eight-Digit HUC Boundaries
USGS Water Supply Records
0
N
85 170 510340 680
Miles
Increasing
Stress
Percent Change in Water Supply Stress Index Ratio
Hadley Climate Scenario without Groundwater
Dry Year: 2045
150%–200%
200%–1000%
1000%–1641%
100%–150%
50%–100%
0%–50%
–50%–0%
5.5d
FIGURE 5.5 (Continued)
© 2008 by Taylor & Francis Group, LLC
Change in the Southern U.S. Water Demand and Supply 57
Lu, J., G. Sun, D. M. Amatya, and S. G. McNulty. 2003. Modeling actual evapotranspiration
from forested watersheds across the southeastern United States. Journal of American
Water Resources Association 39(4):886–896.
NPA Data Services, Inc. 1999. Economic databases—mid-range growth projections 1967–
2050. Regional Economic Projections Series, Arlington, VA: NPA Data Services.
Solley, W. B., R. R. Pierce, and H. A. Perlman. 1993. Estimated use of water in the United
States in 1990. USGS Circular 1081. Reston, VA: U.S. Geological Survey.
Solley, W. B., R. R. Pierce, and H. A. Perlman. 1998. Estimated use of water in the United
States in 1995. USGS Water Resources of the United States. USGS Circular 1200. Res-
ton, VA: U.S. Geological Survey.
Sun, G., S. G. McNulty, J. Lu, D. M. Amatya, Y. Liang, and R. K. Kolka. 2005. Regional
annual water yield from forest lands and its response to potential deforestation across
the southeastern United States. Journal of Hydrology, 308:258–268.
U.S. Census Bureau. 2002. Perennial Census Data. Retrieved April, 15, 2002, from http://
www.census.gov.
U.S. Geological Survey, Water Resources Division. 1994. Hydrologic unit maps of the coter-
minous United States: 1:250,000 scale, 8-digit hydrologic unit codes and polygons.
Reston, VA: U.S. Geological Survey.
© 2008 by Taylor & Francis Group, LLC