WETLAND AND WATER RESOURCE MODELING AND ASSESSMENT: A Watershed Perspective - Chapter 14 pptx
Bạn đang xem bản rút gọn của tài liệu. Xem và tải ngay bản đầy đủ của tài liệu tại đây (154.06 KB, 13 trang )
165
14
Evaluation of Rapid
Assessment Techniques
for Establishing
Wetland Condition on
a Watershed Scale
Vanessa L. Lougheed, Christian A. Parker,
and R. Jan Stevenson
14.1 INTRODUCTION
Recently, the U.S. National Research Council (2001) recommended utilizing a
watershed perspective together with science-based, rapid assessment procedures to
track wetland mitigation and restoration. Rapid assessment tools can be used as a
warning sign to give a quick idea of wetland condition and determine sites in need of
further assessment or immediate protection. Many U.S. states have or are developing
three-tiered assessment procedures that include an initial landscape-scale assess-
ment using aerial imagery (tier 1), followed by a rapid condition assessment (tier 2),
and a more intensive monitoring program (tier 3) (e.g., Miller and Gunsalus 1999,
Mack 2001, Fennessy et al. 2004).
Wetlands can be signicantly impacted by a variety of physical, chemical, and
biological factors, and although a single environmental factor can sometimes be
implicated as the primary stressor to a wetland ecosystem (King and Richardson
2003), it is more likely that a combination of factors result in wetland degradation on
a landscape scale (Danielson 2001).
Furthermore, spatial and temporal variability in chemical stressor levels can
make it difcult to diagnose one specic nutrient causing impairment, especially for
sites sampled just once in landscape-scale assessments. In such cases, multistressor
axes can be used to ensure assessments reect a greater number of stressors (e.g.,
Mack 2001, Lougheed et al. 2001). In particular, one encounters a variety of wetland
classes in a single watershed (e.g., lacustrine, riverine, and isolated wetlands) and
these different classes may respond differently to a variety of stressors (Fennessy et
al. 2004). Multistressor axes may therefore have a greater utility for a suite of wet-
lands in a landscape setting than does any one individual measure.
Existing rapid assessment methods generally combine various measures of
hydrology, water quality, soils, landscape setting, and vegetation (Fennessy et al.
© 2008 by Taylor & Francis Group, LLC
166 Wetland and Water Resource Modeling and Assessment
2004). Fennessy et al. (2004) reviewed 16 different rapid assessment methods that
met 4 criteria they deemed to be important for successful rapid assessment. They
concluded that the best methods should:
1. describe the condition along a single continuum ranging from least to
most impacted
2. provide an accurate assessment of conditions in a relatively short time
period (e.g., 1 day total for both eld and lab components)
3. include an onsite assessment
4. be capable of onsite verication using more comprehensive ecological
assessment data (tier 3)
Using these guidelines, the goal of this study was to develop a suite of rapid
assessment techniques and examine their utility in evaluating wetland condition in a
single large watershed in Michigan. In particular:
We compare a eld-based estimate of riparian land use to actual land use val-
ues determined from GIS (geographic information system) maps in a 1-km buffer
around each wetland.
We create a multimetric wetland disturbance axis (WDA) that incorporates rapid
measures of hydrology, water quality, and land use.
As a rapid assessment of biological condition, we compare an estimate of epi-
phytic algal thickness against epiphytic chlorophyll biomass values and percent
cover of epiphytic macroalgae.
To verify the utility of the WDA in reecting biological condition, we determine
whether plant community composition responds along the WDA.
14.2 METHODS
The Muskegon River drains a 7,000-km
2
watershed that ows into Lake Michigan
on its eastern shore and is dominated by forested land in the upstream regions and
agricultural and small urban areas (e.g., Muskegon, population 40,000) in the down-
stream region. We visited 85 wetlands in the Muskegon River watershed (MRW in
Michigan) during the summers of 2001 through 2003. This included 35 isolated
depressions, 25 lacustrine and 25 riverine wetlands. Fifty-two (52) sites were selected
randomly based on a numbered grid overlaid on GIS-based wetland maps, while the
remaining 33 sites were purposely selected to represent a gradient of disturbance.
Approximately half (18) of the randomly selected wetlands were outside the MRW
and in the upstream reaches of immediately adjacent watersheds (e.g., Chippewa
River, Grand River, Pere Marquette River).
For determination of water chemistry, water was collected from an open water
area in each wetland in 250-mL, acid-washed bottles. Total phosphorus (TP), total
nitrogen (TN), nitrate + nitrite (NOx), ammonia (NH
3
), silica (Si), soluble reac-
tive phosphorus (SRP), and chloride (Cl) were determined using standard methods
(American Public Health Association [APHA] 1998) on a Skalar auto-analyzer.
Conductivity was measured in the eld using a YSI 556 multiprobe. Sediment was
collected from 3 random locations in the wetland using a 5-cm corer; the 3 samples
© 2008 by Taylor & Francis Group, LLC
Evaluation of Rapid Assessment Techniques 167
were combined and frozen until analysis. C:N was determined using a Perkin-Elmer
2400 Series II CHN analyzer, while percent organic matter was determined follow-
ing loss-on-ignition at 500°C. We did not measure contaminant levels in this study;
however, local public health departments had identied several areas with contami-
nated sediments at a level of concern and these were noted.
We constructed a multimetric stressor axis designed to integrate and give equal
weight to measurements in 3 primary stressor categories: land use, hydrological
modication, and water quality. Unlike many other rapid assessment methods (see
Fennessy et al. 2004), we did not include plant habitat variables, as we felt that
this would create circular relationships with our plant community metrics. This
wetland disturbance axis (WDA) included 3 metrics indicative of land use and
land cover change (riparian land use, buffer width, distance to nearest wetland), 2
metrics indicative of hydrology (hydrological modication, water source), as well
as 2 water quality metrics (conductivity, contaminants) (Table 14.1). Some of these
metrics were loosely based on those used in the Ohio Rapid Assessment Method
(ORAM) (Mack 2001), while new metrics were also included to reect different
data collection methods in this study. We assigned scores to some of the metrics
by placing the “answers” to assessment questions into different categories and then
assigning a score by category (Fennessy et al. 2004). For example, hydrological
modication was categorized using questions such as: Are there roads along the
wetland edge? Is there evidence of dams, dredging, or ditching? Then, each hydro-
logical stressor answer was assigned a score, which was summed to achieve a metric
indicative of all hydrological modications. Most metrics were scaled using a 1-3-5
scaling system, where a value of 0 or 1 was given to the least impacted wetlands
and a value of 5 was given to the most degraded sites. For example, average buffer
width around wetlands was categorized in the eld in 4 categories (0 = >50 m; 1 =
25–50 m; 3 = 10–25 m; 5 = <10 m). Similarly, water source was characterized as
year round (0), intermittent (3), or none visible (5), and contaminants were classi-
ed as none (0), low levels (3), or level of concern (5). In the eld, riparian land use
was categorized as either agricultural, fallow pasture, urban, suburban, parkland,
or forested on a scale from 0 to 4 (sum total of all categories = 4). For inclusion in
the WDA, the proportion (out of 4) for each of these land use categories was mul-
tiplied by 5 (for high-impact land categories such as urban and agricultural land),
by 3 (for moderate land use impacts such as fallow pasture, park, and suburban
residential), whereas forested land was multiplied by zero. Two metrics (nearest
neighbor, conductivity) were scaled based on the frequency distribution of values
observed for all wetlands in this study. One of these, conductivity, was scaled from
0 to 10 in order to increase the weight of this metric in the overall WDA calcula-
tion. Finally, all individual scores from each metric were added together. Although
the maximum WDA in this study was 75, the WDA was scaled from 0 to 100, to
allow its use in more degraded watersheds in the region. Low value of the WDA
indicate higher-quality wetlands.
Land use and distance between wetlands were determined in ESRI ArcMap (ver-
sion 9.0) using land use maps current to 1998. Using these data, we determined lin-
ear distance to the nearest wetland (nearest neighbor), as well as riparian land use in
a 1-km buffer around each wetland. Nearest neighbor is the only metric included in
© 2008 by Taylor & Francis Group, LLC
168 Wetland and Water Resource Modeling and Assessment
TABLE 14.1
Description of metrics used in the wetland disturbance axis (WDA).
Sum of all metrics is 45, but is scaled out of 100 to get final WDA.
Score and range of values MAX
Land use and habitat fragmentation (MAX: 15)
Average buffer width
(score 1 value only)
0: >50 m
1: 25–50 m
3: 10–25 m
5: <10 m
5
Surrounding land use
(calculate and add)
0: multiply 0x proportion forested land
3: multiply 3x sum of proportion park, fallow pasture, and
suburban residential land
5: multiply 5x sum of proportion urban, industrial, and
agricultural land
5
Nearest neighbor
a
(score 1 value only)
0: <0.13 km
1: 0.13–0.33 km
2: 0.33–0.66 km
3: 0.66–0.92 km
4: 0.92–1.64 km
5: >1.64 km
5
Hydrology (MAX: 15)
Water source
(score 1 value only)
0: year-round inputs (river, lake, groundwater)
3: seasonally intermittent
5: no visible inputs
5
Hydrological modication
(add all visible modications
together to maximum of 10)
0: none
1: road along less than 1/4 of wetland edge
1: human dam (pre-1980)
3: human dams (post-1980) or natural dams
(beaver, clogged culvert)
3: road along >1/4 of wetland edge
5: high impact (ditching, dredging, culverts)
10
Water quality (MAX: 15)
Conductivity
a
(score 1 value only)
0: <85 μS/cm
2: 85–159 μS/cm
4: 159–289 μS/cm
6: 289–386 μS/cm
8: 386–498 μS/cm
10: >498 μS/cm
10
Contaminants
(score 1 value only)
0: None
3: Present at low levels
5: Level of concern
5
a
Ranges included in metric based on frequency distribution.
© 2008 by Taylor & Francis Group, LLC
Evaluation of Rapid Assessment Techniques 169
the WDA that was not estimated in the eld; however, it may be possible to estimate
this variable more rapidly using aerial photos or topographic maps if GIS is not
available.
Macrophyte and epiphytic algae communities were surveyed using a stratied
random design. We established 3 regularly spaced parallel transects, perpendicular
to the shore, and randomly placed 1-m
2
rectangular quadrats along each transect
according to a random numbers table. In each quadrat, we recorded relative cover
of each plant species using a modied Braun-Blanquet scale, estimated the percent
cover of lamentous macroalgae, and classied epiphyte thickness on a semiquan-
titative scale (rapid epiphyton survey [RES]: 0 = no growth; 1 = thin lm, tracks
can be drawn with your ngernail; 2 = 1 to 5 mm; 3 = >5 mm). These were visual
estimations of epiphytic thickness, and did not represent precise measurements. Epi-
phytic algae were collected from cuttings of the dominant vegetation type in each
wetland selected from random locations along each transect; we avoided collecting
plants with macroalgal growth. Algae was removed from the plants with a com-
bination of gentle rubbing from emergent stems and shaking of submerged plant
stems in distilled water. Cleaned plants were placed in zipper bags and refrigerated
so that surface area could be determined using image analysis software (ImageJ,
NIH). Subsamples of the resulting algal suspension were frozen and analyzed for
chlorophyll-a within 2 months of collection. Chlorophyll-a was extracted with 90%
ethanol for 24 hours in the dark at 4°C; samples were then sonicated for 15 minutes
and chlorophyll uorescence determined on a Turner Designs uorometer. Chloro-
phyll concentration was expressed per surface area of plant. Results presented are
not corrected for phaeophytin because our RES could not distinguish between live
and dead epiphytes.
We selected the Floristic Quality Assessment Index (FQAI) for Michigan (Her-
man et al. 2001) and its related coefcient of conservatism (CofC) to describe the
wetland condition represented by the plant communities. The FQAI indicates the
extent to which the community is dominated by sensitive wetland plants. The CofC
is the sensitivity value given to each plant and we used the average CofC calculated
for all plant species in each wetland. To explain structure in the biological communi-
ties of the wetlands, independent of any preconceived environmental preferences or
gradients, we used nonmetric multidimensional scaling (NMDS). NMDS analysis
identies axes that describe biologically meaningful, multivariate gradients in the
community data (McCune and Grace 2002). We selected the Bray-Curtis distance
measure and used the rst NMDS axis identied by PC-ORD (version 4.10) as an
indicator of plant community structure. The NMDS, FQAI, and CofC were deter-
mined from previous analyses (Lougheed et al. 2007) to respond strongly to envi-
ronmental gradients in the MRW.
Relationships between the rapid assessment variables and more detailed mea-
surements of land use and epiphytic chlorophyll-a were studied in the large dataset
of 85 wetlands, regardless of wetland class. In studying the responses of the plant
communities, we divided the data into wetland classes (depressions, lacustrine, riv-
erine) because biological communities in differing classes may respond uniquely to
differing stressors.
© 2008 by Taylor & Francis Group, LLC
170 Wetland and Water Resource Modeling and Assessment
14.3 RESULTS
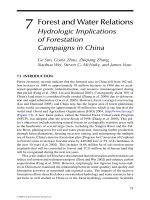
Actual land use in a 1-km buffer around each wetland was well represented by the
estimated land use categories (Figure 14.1); however, our estimates of land use more
accurately reected urban and agricultural land use. For both these land use types,
we were able to distinguish among 3 separate categories and the 0 category had an
average of 4% developed land in both cases. Our measurements of forested land dif-
fered between the lowest (0 and 1) and highest categories (3 and 4); however, the 0
Agriculture Category
0
Percent Agriculture
0.0
0.2
0.4
0.6
0.8
0.0
0.2
0.4
0.6
0.8
Forest Category
Percent Forested
Urban Category
Percent Urban
0.00
0.05
0.10
0.15
0.20
0.25
0.30
0.35
A
AA
A
AB
AB
B
B
B
C
C
C
BC
1
2
3
01 2
34
0
123
FIGURE 14.1 Comparison of GIS-calculated percent land use values determined in a 1-km
buffer around each wetland in 4 to 5 land use categories estimated in the eld. Letters indi-
cate statistical similarities (Tukey multiple comparisons; p < 0.05).
© 2008 by Taylor & Francis Group, LLC
Evaluation of Rapid Assessment Techniques 171
category had an average of 26% forested land, which was not signicantly different
from category 1 at 33% forested land.
We took the average rapid epiphyton survey (RES) values from each wetland
and rounded the value up to the nearest 0.5. Epiphytic chlorophyll-a was signi-
cantly different between sites with a “thin lm” (category 1) of algae, relative to
sites with approximately 1 to 5 mm of growth (category 2) (Figure 14.2). There was
no signicant increase in category 3, likely because it included sites with increased
macroalgal cover, which we excluded from our epiphyte samples. This is supported
by comparisons of macroalgal cover, expressed as relative dominance of macroalgal
cover (per m
2
) relative to total plant species cover (per m
2
), which was signicantly
higher in sites with an average RES value of 3.
We used principal components analysis to determine which rapid assessment
metrics explained the greatest amount of variation in the dataset. The rst 3 PCA
axes together accounted for 68% of the variation among sites. The rst principal
component (PC1) explained 34% of the variation in the dataset, and was most highly
Rapid Epiphyton Survey
1.0 1.5 2.0 2.5 3.0
1.0 1.5 2.0 2.5
3.0
0
200
400
600
800
1000
1200
1400
Rapid Epiph
y
ton Surve
y
Macroalgal Dominance
0.00
0.05
0.10
0.15
0.20
0.25
A
AA
AB
AB AB
ABB
B
B
FIGURE 14.2 Comparison of epiphytic chlorophyll-a biomass (top) and macroalgal domi-
nance (bottom) in 5 rapid epiphyton survey (RES) categories estimated in the eld. Letters
indicate statistical similarities (Tukey multiple comparisons; p < 0.05).
© 2008 by Taylor & Francis Group, LLC
Epiphyton CHL (
g/cm
)
+
2
172 Wetland and Water Resource Modeling and Assessment
correlated with land use and fragmentation variables (buffer width, r = 0.82; ripar-
ian land use, r = 0.83, nearest neighbor, r = 0.53) and water conductivity (r = 0.64);
all other metrics were also signicantly correlated with this axis, but at much lower
levels (r = 0.24–0.36). The second axis (PC2; 18% of variation in dataset) was most
highly correlated with hydrological variables (modication, r = 0.73; water source,
r = 0.60), as well as a negative correlation with nearest neighbor (r = −0.59). The
third axis (PC3; 16% of variation in dataset) was most highly correlated with con-
taminants (r = 0.80). There was no signicant difference in the location of different
wetland classes along PC1; however, PC2 values were signicantly higher in depres-
sional wetlands, likely because fewer of these had year-round inputs of water (water
source) as opposed to all riverine and lacustrine sites.
As an indicator of disturbance, the WDA correlated strongly with many mea-
sured land use and water chemistry variables (p < 0.05). In particular, it was highly
correlated with land use variables (r = 0.54–0.60), water chemistry measures (r =
0.3–0.36), and sediment characteristics (r = 0.23–0.25) (Table 14.2).
For subsequent analyses, we separated the data into 3 sections, representing the
different wetland classes (depressions, lacustrine, riverine). A signicant amount of
the variation in a measure of plant community structure (NMDS) and the extent to
which the community was dominated by native, sensitive taxa (FQAI and CofC)
could be explained by the WDA (Figure 14.3). The FQAI was strongly correlated
with the WDA for riverine sites, whereas the CofC was a better metric for depres-
sions and lacustrine wetlands. Overall, these relationships were strongest for depres-
sional and lacustrine wetlands, and lower for riverine sites. In many cases, the WDA
explained more variation in the biological metrics than did any individual environ-
mental variable (Table 14.3); however, forested land explained slightly more of the
variation in the NMDS values for depressional wetlands, and variation in riverine
plant communities was explained slightly better by TP and conductivity. It is inter-
esting to note, however, that using a suite of 120 plant metrics calculated for all
TABLE 14.2
Significant correlations between
WDA and environmental variables
(p < 0.10; Bonferoni corrected).
Variable r p
% Urban 0.54 0.0000
% Agriculture 0.43 0.0000
% Forest –0.60 0.0000
TP 0.30 0.0061
NO
X
0.36 0.0008
SRP 0.21 0.0496
NH
3
0.35 0.0011
Cl 0.71 0.0000
Sediment: %organic –0.23 0.0477
Sediment C:N 0.25 0.0356
© 2008 by Taylor & Francis Group, LLC
Evaluation of Rapid Assessment Techniques 173
NMDS axis
-1.5
-1.0
-0.5
0.0
0.5
1.0
1.5
2.0
WDA
log CofC
0.55
0.60
0.65
0.70
0.75
0.80
0.85
0.90
WDA
WDA
0102
03
04050607080
0102
03
04050607080
0102
03
04050607080
log FQAI
1.20
1.25
1.30
1.35
1.40
1.45
1.50
1.55
Depressional
r
2
= 0.46 p<0.001
Lacustrine
r
2
= 0.51 p<0.001
Riverine
r
2
= 0.21 p = 0.02
Depressional
r
2
= 0.38 p<0.001
Lacustrine
r
2
= 0.30 p<0.00
1
Riverine
r
2
= 0.20 p = 0.03
FIGURE 14.3 Relationship between plant community metrics and the WDA for depressional (left), lacustrine (middle), and riverine (right)
wetlands in the MRW.
© 2008 by Taylor & Francis Group, LLC
174 Wetland and Water Resource Modeling and Assessment
site types, including measures of species richness and plant community composition
(Lougheed, unpublished data), more of these metrics were correlated to the WDA
(26 metrics; Bonferoni corrected; p<0.05), than the next most commonly correlated
environmental variables: developed land (21 metrics), TP (12 metrics), and Cl (5
metrics).
14.4 DISCUSSION
This study provides evidence that eld-based estimates of algal cover and land use
can accurately reect more detailed measures requiring increased lab processing
time and technical skills. In addition, we present the development and verication of
a multimetric wetland disturbance axis (WDA) that successfully integrates stressors
from 3 categories: land use, hydrological modication, and water quality. The WDA
is highly correlated with a variety of land use and water chemistry measures, as well
as several measures of plant community composition.
Rapid epiphyton assessment can be highly useful because it enables the determi-
nation of algal biomass over larger spatial scales than sampling algae off individual
substrates followed by lab analysis (Stevenson and Bahls 1999). We provide evidence
that an estimate of epiphyte cover using a rapid epiphyton survey can be a good sur-
rogate for more detailed measures of epiphytic and macro-algal biomass. Despite
its accuracy, both the rapid and more detailed measurements of algal biomass were
not correlated to any rapid or detailed measures of wetland condition, including the
WDA or nutrient levels. Wetlands are complex environments, where both vascular
plants and algae compete for nutrients and light. Measures of diatom community
composition (Lougheed et al. 2007) or trophic state indices (e.g., Van Dam et al.
1994) may be more sensitive indicators of algal responses to nutrient enrichment in
wetlands than more simple measures of algal biomass. In particular, Lougheed et al.
(2007) found that diatom community composition (as indicated by NMDS) was a
TABLE 14.3
Significant correlations between biological metrics & environmental
variables (p < 0.10; Bonferoni corrected).
Depressions Lacustrine Riverine
NMDS CofC NMS CofC NMS FQAI
WDA 0.68 –0.61 0.77 –0.62
a
0.50
a
–0.55
Agriculture 0.61 –0.56 — –0.54
a
0.44
a
—
Urban 0.39
a
— 0.63 –0.41
a
——
Forest –0.72 0.55 –0.61 0.55 — —
TP 0.36 — 0.501 –0.45
a
0.54
a
—
Cl 0.50 –0.39 0.62 –0.51
a
— –0.52
a
COND 0.60 –0.46 0.65 — 0.41
a
–0.63
NO
X
————0.41
a
–0.58
a
Not signicant when Bonferoni corrected at p < 0.05.
© 2008 by Taylor & Francis Group, LLC
Evaluation of Rapid Assessment Techniques 175
highly sensitive measure of disturbance in depressional wetlands. Early changes in
algal species composition, as opposed to changes in algal biomass, may result from
minor changes in nutrient availability and may be a better indicator of alterations in
fundamental microbial processes (Stevenson et al. 2002).
The proportion of agricultural and urban land in wetland watersheds is a highly
signicant predictor of reduced water quality in wetlands (Crosbie and Chow-Fra-
ser 1999, Lougheed et al. 2001), while an increased proportion of forested land,
including forested buffer strips along streams (e.g., Crosbie and Chow-Fraser 1999)
in wetland watersheds, can be benecial in improving water quality. Land use covers
can be time-consuming to determine, especially if GIS layers are not available or
experience using GIS programs is limited; however, this study indicates that riparian
land use estimates can be a good approximation of actual riparian land use calcu-
lated from GIS layers. In this study, our estimates may have underestimated forested
land in some cases, likely because many of our wetlands were accessible by roads or
tracks and thus may have been biased toward sites closer to human habitations, even
though overall land in the riparian area may have been largely forested. Nonetheless,
these estimates appear to be a useful approximation of land use that may be used in
riparian rapid assessment techniques.
A critical step in creating rapid assessment methods is ensuring their utility in
reecting wetland quality, not only at the level of the chemical and physical vari-
ables included in the method, but also of the more intensive biological monitoring
that might occur in a tier 3 assessment. The WDA proved to be useful in integrating
the effects of land use, hydrological alteration, and nutrient-based stressors in the
MRW. In particular, much of the variation among sites in the MRW was due to dif-
ferences in land use (including buffer width, riparian land use and nearest neighbor)
and water conductivity. As verication of its utility, the WDA was highly correlated
with detailed land use and water quality measures, as well as measures of plant
community composition (NMDS) and dominance by sensitive plants (CofC, FQAI).
In addition, Lougheed et al. (2007) showed that the WDA could be used as a rapid
assessment tool for categorizing depressional wetlands into tiers to track restora-
tion and degradation. They used nonlinear biological responses along the WDA to
identify biological thresholds, and thus classied wetlands into 3 groups: reference
sites with little biological change (WDA < 17), slightly altered sites (17 < WDA
< 47) where the most sensitive organisms responded, and degraded sites (WDA >
47) where large-scale changes in community structure of plants, diatoms, and zoo-
plankton occurred. Given these analyses for depressional wetlands in the MRW and
nearby watersheds, the WDA rapid assessment tool, which has been veried using
more comprehensive biological data, can now be used to categorize additional wet-
lands in the watershed as well as track the state of wetlands that were identied as
needing remedial action.
In an era of reduced funding for environmental monitoring and research, com-
bined with an increased need for monitoring the ever-increasing impacts of human
activities, development and validation of rapid assessment techniques is necessary
to allow for the assessment, protection, and restoration of aquatic habitats. The
WDA meets all criteria necessary for successful rapid assessment of wetland sites
including: (1) representing a continuum from least to most degraded, (2) it can be
© 2008 by Taylor & Francis Group, LLC
176 Wetland and Water Resource Modeling and Assessment
completed in a relatively short period of time using both onsite and lab components,
and (3) it can be veried using comprehensive ecological assessment data (Fennessy
et al. 2004). The WDA will be useful in tracking wetland quality in the MRW, and
providing a warning sign to identify sites in need of immediate protection. In addi-
tion, we have provided evidence that eld-based estimates of algal cover and land
use can accurately reect more detailed measures requiring increased lab processing
time and technical skills.
ACKNOWLEDGMENTS
We greatly appreciate eld assistance from Mollie McIntosh, Sarah Wolf, Alyson
Yagiela, Nicole Behnke, and James Montante. Land use shapeles were provided by
Brian Pijanowski. This project was funded by the Great Lakes Fisheries Trust as part
of the Muskegon River Initiative.
REFERENCES
American Public Health Association (APHA). 1998. Standard methods for the examination of
water and wastewater. 20th ed. Washington, DC: American Public Health Association.
Crosbie, B., and P. Chow-Fraser. 1999. Percentage land use in the watershed determines the
water and sediment quality of 22 marshes in the Great Lakes basin. Canadian Journal
of Fisheries and Aquatic Science 56:1781–1791.
Danielson, T. J. 2001. Methods for evaluating wetland condition: Introduction to wetland
biological assessment. EPA 822-R-01-007a. Washington, DC: Ofce of Water, U.S.
Environmental Protection Agency.
Fennessy, M. S., A. D. Jacobs, and M. E. Kentula. 2004. Review of rapid methods for assess-
ing wetland condition. EPA/620/R-04/009. Washington, DC: U.S. Environmental Pro-
tection Agency.
Herman, K. D., L. A. Masters, M. R. Penskar, A. A. Reznicek, G. S. Wilhelm, W. W. Brodov-
ich, and K. P. Gardiner. 2001. Floristic quality assessment with wetland categories and
examples of computer applications for the state of Michigan, revised 2nd ed. Lansing:
Michigan Department of Natural Resources, Wildlife, Natural Heritage Program.
King, R. S., and C. J. Richardson. 2003. Integrating bioassessment and ecological risk assess-
ment: An approach to developing numerical water-quality criteria. Environmental
Management 31(6):795–809.
Lougheed, V. L., C. A. Parker, and R. J. Stevenson. 2007. Using non-linear responses of mul-
tiple taxonomic groups to establish criteria protective of wetland biological condition.
Wetlands 27:96–109.
Lougheed, V. L., B. Crosbie, and P. Chow-Fraser. 2001. Primary determinants of macro-
phyte community structure in 62 marshes across the Great Lakes basin: Latitude, land
use, and water quality effects. Canadian Journal of Fisheries and Aquatic Sciences
58:1603–1612.
Mack, J. J. 2001. Ohio rapid assessment method for wetlands, manual for using version 5.0.
Ohio EPA Technical Bulletin Wetland/2001-1-1. Columbus: Ohio Environmental Pro-
tection Agency, Division of Surface Water, 401 Wetland Ecology Unit.
McCune, B., and J. B. Grace. 2002. Analysis of ecological communities. Gleneden Beach,
OR: MjM Software Designs.
© 2008 by Taylor & Francis Group, LLC
Evaluation of Rapid Assessment Techniques 177
Miller, R. E., Jr., and B. E. Gunsalus. 1999. Wetland rapid assessment procedure. Updated
2nd ed. Technical Publication REG-001. West Palm Beach, FL: Natural Resource
Management Division, Regulation Department, South Florida Water Management Dis-
trict, />National Research Council (NRC). 2001. Compensating for wetland losses under the Clean
Water Act. Washington, DC: National Academy Press.
Stevenson, R. J., and L. L. Bahls. 1999. Periphyton protocols. In Rapid bioassessment proto-
cols for use in streams and wadeable rivers: Periphyton, benthic macroinvertebrates
and sh, 2nd ed., EPA 841-B-99-002, ed. M. T. Barbour et al. Washington, DC: U.S.
Environmental Protection Agency; Ofce of Water.
Stevenson, R. J., P. V. McCormick, and R. Frydenborg. 2002. Methods for evaluating wetland
condition: Using algae to assess environmental conditions in wetlands, EPA-822-R-02-
021. Washington, DC: Ofce of Water, U.S. Environmental Protection Agency.
Van Dam, H., A. Mertenes, and J. Sinkeldam. 1994. A coded checklist and ecological indica-
tor values of freshwater diatoms from the Netherlands. Netherlands Journal of Aquatic
Ecology 28:117–133.
© 2008 by Taylor & Francis Group, LLC