WETLAND AND WATER RESOURCE MODELING AND ASSESSMENT: A Watershed Perspective - Chapter 15 ppt
Bạn đang xem bản rút gọn của tài liệu. Xem và tải ngay bản đầy đủ của tài liệu tại đây (854.21 KB, 8 trang )
179
15
Development of
Geospatial Ecological
Indicators in Jiangxi
Province, China
Peng Guo and Xiaoling Chen
15.1 INTRODUCTION
Comprehensive evaluation of ecological environments is necessary for environmen-
tal sustainability and management planning, which can provide quantitative docu-
ments as scientic guides for informed decision making. The existence of several
environmental impact assessment (EIA) methods makes it difcult to make on an
appropriate choice (Sankoh 1996).
Remote sensing, being a very useful observational tool, has been integrated with
GIS (geographic information system) to monitor and evaluate environmental condi-
tions (Shen et al. 2004, Wang et al. 2002, 2004). In these studies, Landsat TM, ETM+
and NOAA/AVHRR (National Oceanic and Atmospheric Administration/Advanced
Very High Resolution Radiometer) images were used to obtain the vegetation cover
status derived from NDVI (Normalized Distance Vegetative Index). In this paper, we
demonstrate the potential of the Moderate Resolution Imaging Spectroradiometer
(MODIS) for monitoring ecological and environmental conditions. MODIS is own
on two NASA satellites (Terra/morning pass: 1999–present and Aqua/afternoon
pass: 2002–present). MODIS data are collected continuously and are available for
public use.
Poyang Lake, located in the middle reach of the Yangtze River and the subtropi-
cal wet monsoon zone, is the largest freshwater lake in China. The area of Poyang
Lake basin is 16.22 × 10
4
km
2
(9% of the Yangtze River basin), and 97% of the basin
is located in Jiangxi Province. Over many years, the total area of forest and lake
land cover has been reduced due to human activities such as increasing popula-
tion, which has resulted in the deterioration of the ecological environment in the
Poyang Lake basin. The area of soil and water being damaged by erosion in Jiangxi
Province is 3.52 × 10
4
km
2
(Guan 2001). This process of erosion has been seriously
destroying the quality of the ecological environment and impacting the sustainable
development of economic growth in Jiangxi Province and the Yangtze River basin.
This paper focuses on developing geospatial ecological indicators and quantitatively
analyzing environmental factors of Jiangxi Province based on remote sensing and
GIS methods.
© 2008 by Taylor & Francis Group, LLC
180 Wetland and Water Resource Modeling and Assessment
15.2 MATERIALS AND METHODS
15.2.1 B
UILDING AN EVALUATION INDICATOR SYSTEM
Many factors, including biophysical and anthropogenic factors, may inuence the
ecology and environment in the basin. In order to quantitatively depict the char-
acteristics of ecology and environment, an evaluation indicator system needs to be
developed in a comprehensive and concise way for factor selection. In this chapter,
various factors, such as characteristics and spatial scale of the Jiangxi Province,
climate, terrain, soil erosion, and vegetation cover status, were selected to build the
indicator system that can better reect the ecological and environmental characteris-
tics of the study area. The data mainly includes ≥0° accumulated temperature, ≥10°
accumulated temperature, average annual temperature, precipitation and evapo-
transpiration, surface humid index, vegetation index, elevation, slope, aspect, soil
erosion, and MODIS image.
15.2.2 EXTRACTION OF WATER BODIES AND NDVI
In the process of evaluation, a water body was regarded as an individual land object
to be distinguished from others. According to the characteristics of spectral reec-
tance of a water body and vegetation, the near-infrared band is the most useful in
distinguishing the land-and-water boundary and ground vegetation (Zhen and Chen
1995, Tan et al. 2004). Bands 1 and 2 of the MODIS images, whose wavelengths
range from 0.62 to 0.67 μm and 0.84 to 0.87 μm, respectively, match bands 3 and 4 of
the Landsat TM images. These two bands were used to identify vegetation and water
body. The NDVI is adopted to synthesize vegetation index diagram as follows:
NDVI = (NIR − Red)/(NIR + Red) = (Band2 − Band1)/ (Band2 + Band1)
The NIR and Red are are digital numbers (DNs) of the near-infrared band and
red band, respectively. The analysis showed that the area of NDVI <0.25 was cov-
ered by water bodies in the wetlands of the Poyang Lake basin.
15.2.3 STATISTICAL METHODS
It is important and difcult to integrate the multi-indices into an integrative indicator
when the ecological environment is evaluated. Some methods such as weighted index,
AHP (analytical hierarchy process), and GEM (group eigenvalue method) have been
ordinarily used. In this chapter, PCA (principal component analysis) was performed on
the ecological parameters to evaluate the ecological environment in Jiangxi Province.
15.2.4 PRINCIPAL COMPONENT ANALYSIS
Principal component analysis is a powerful technique for pattern recognition that
attempts to explain the variance of a large set of intercorrelated variables and trans-
form them into a smaller set of independent (uncorrelated) variables (principal com-
ponents). The rst principal component accounts for as much of the variability in
the dataset as possible, and each succeeding component accounts for as much of the
© 2008 by Taylor & Francis Group, LLC
Development of Geospatial Ecological Indicators in Jiangxi Province, China 181
remaining variability as possible. Principal component analysis provides informa-
tion on the most meaningful parameters, which describe whole datasets, then render
data reduction with minimum loss of original information.
Performed with GIS software, spatial PCA is used to transform the data in a stack
from the input multivariate attribute space into a new multivariate attribute space
whose axes are rotated with respect to the original space. The axes (attributes) in the
new space are uncorrelated. The main reasons for transforming the data in a principal
component analysis are to “compress” data by eliminating redundancy, to emphasize
the variance within the grids of a stack, and to make the data more interpretable.
In the evaluation of an ecological environment, the integrative indicator can be
dened as a weighted sum of M principal components. The weight is the component
loading of principal components. The function is expressed as:
where E is the result of assessment, a is the component loading, and Y is the principal
component. For excluding the effect of different scalars and dimensions of variables,
the data were standardized by the follow equation:
where X
aver
is the average of X, and is the standard deviation of X.
15.2.5 QUALITY INDEX OF ECOLOGICAL ENVIRONMENTAL BACKGROUND
Based on the result of an ecological environmental synthetic evaluation, we used
the following function to calculate the quality index of the ecological environment
background of Jiangxi Province:
where I
j
is the quality index of the ecological environment background in the region
j; E
i
is the value of eco-environmental classes, as there are six environmental classes;
the eco-environment with the best situation is assigned as 6, and the one with the
worst situation is assigned as 1; A
i
is the area of class i and S
i
is the area of region j.
15.3 RESULTS AND DISCUSSION
By processing data with GRID model in the ArcInfo workstation, we calculated the
climate index using the following parameters: ≥0° accumulated temperature, ≥10°
© 2008 by Taylor & Francis Group, LLC
E aY a Y a Y
M M
= + + +
1 1 2 2
(15.1)
D
X X
i
i aver
=
−( )
σ
(15.2)
I E A S
j i i i
i
= × ×
=
∑
100
1
6
( / )
(15.3)
s
182 Wetland and Water Resource Modeling and Assessment
accumulated temperature, the average annual temperature, precipitation and evapo-
transpiration, surface humid index, and terrain index from the following parameters:
elevation, slope, aspect.
The equations are as follows:
I
climate
= 0.5149 × ClimateP1 + 0.3040 × ClimateP2 + 0.1721 × ClimateP3 (15.4)
I
terr
= 0.6385 × TerrP1 + 0.2582 × TerrP2 (15.5)
where I
climate
is the climate index, ClimateP
i
is the ith principal component of climate
index; I
terr
is the topographical index, and TerrP
i
is the ith principal component of
topographical index.
After analyzing the vegetation index, soil erosion index, topographical index,
and climate index by using the PCA method, we calculated the ecological environ-
mental assessment index in Jiangxi Province. Table 15.1 shows the principal compo-
nent Eigen values of various principal components.
From the above analysis, we derived the linear equation of the ecological envi-
ronmental assessment index:
I
eco
= 0.7806 × EcoP
1
+ 0.1407 × EcoP
2
(15.6)
where I
eco
is the ecological environmental assessment index, EcoP
1
is the rst PC
(principal component) of four indices, and EcoP
2
is the second PC.
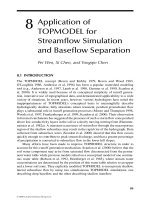
We then calculated the integrated ecological environmental evaluation for
Jiangxi Province (Table 15.2) using the environmental evaluation classication map
(Figure 15.1).
The ecological environment was classied into six classes by the eco-environ-
ment indicator. Table 15.2 shows that the largest area occurs in class 5, while the
sum of classes 3, 4, and 5 covers 64.05% of the total area. The sixth class, describ-
ing the optimal situation of a quality eco-environment, covers 16.70% of the total
province, which is a class characterized by less soil erosion and higher vegetation
coverage.
Figure 15.1 shows that the quality of the ecological environment in the upper
reaches of the ve rivers in the Poyang Lake basin is worse than the lower reaches of
those rivers in the basin, which are near Poyang Lake and mainly consist of ood-
plains. The environment in the upper reaches of the ve rivers in the Poyang Lake
basin has a great potential for affecting the water quality of Poyang Lake. Figure 15.2
is the quality index map of the eco-environmental background of Jiangxi Province,
which was calculated based on equation 15.3, which can be used to spatially identify
the environmental quality in Jiangxi Province. The results revealed that the Nan-
chang area has good eco-environmental quality. In addition, we determined that
Ganzhou in the southern part of the Poyang Lake basin, and Pingxiang in the north-
ern part, have poor eco-environmental quality.
© 2008 by Taylor & Francis Group, LLC
Development of Geospatial Ecological Indicators in Jiangxi Province, China 183
TABLE 15.1
The eigenvalues and attribute ratio in the principal components analysis.
Ecological environment index Terrain index Climate index
PC
Eigen
values
Deviation
loading
(%)
Accumulated
de
viation
(%)
E
igen
values
Deviation
loading
(%)
Accumulated
deviation
(%)
Eigen
values
Deviation
loading
(%)
Accumulated
deviation
(%)
I 1.37968 78.06 78.06 1.02512 63.85 63.85 1.42617 0.5149 51.49
II 0.24869 14.07 92.13 0.43053 25.82 89.67 0.59126 0.3040 81.89
III 0.12187 6.90 99.03 0.15990 10.33 100 0.49594 0.1721 99.10
© 2008 by Taylor & Francis Group, LLC
184 Wetland and Water Resource Modeling and Assessment
TABLE 15.2
The integrated ecological environmental
evaluation of Jiangxi Province, China.
Eco-environmental
class
Grid
number
Area
(km
2
)
Percent
(%)
1 775080 7750.8 4.64
2 2152866 21528.66 12.89
3 3199463 31994.63 19.16
4 3684927 36849.27 22.07
5 3810588 38105.88 22.82
6 2788534 27885.34 16.70
Water 284414 2844.14 1.70
Total 16765872 167658.72 100.00
water
1
2
3
4
5
6
FIGURE 15.1 The integrated eco-environmental classes of Jiangxi Province, China.
(Source: Chinese State Bureau of Surveying and Mapping)
© 2008 by Taylor & Francis Group, LLC
Development of Geospatial Ecological Indicators in Jiangxi Province, China 185
15.4 CONCLUSIONS
It is obvious that remote sensing and geographic information science (RSGIS) are
useful tools for studying the status of eco-environmental quality for diverse regions.
RSGIS has many advantages such as lower cost, faster information collection, and
more efcient investigation and assessment of the eco-environment on a large spatial
scale. With the development of a new generation of remote sensing sensors, RSGIS
will provide us with more feasible and cheaper means for studying the environmen-
tal problem. PCA, as a very useful analysis method, can be commendably used in the
assessment. Combining the PCA method with RSGIS, this study performs primary
research on the eco-environment in Jiangxi Province, which produced meaningful
results. In next stage, we will study the change of eco-environment over the past 30
years by using this study frame.
ACKNOWLEDGMENTS
This work was supported by the National Key Basic Research and Development Pro-
gram: 2003CB415205 and the Opening Foundation of the Key Lab of Poyang Lake
Ecological Environment and Resource Development at Jiangxi Normal University,
Grant No.200401006(1).
High : 509
Fu zhou
Jiu jiang
Jing de zhen
Gan zhou
Ji an
Ping xiang
Xin yu
Ying tan
Shang rao
Nan chang
Yi chun
Low : 346
FIGURE 15.2 The quality index map of the eco-environmental background of Jiangxi
Province, China. (Source: Chinese State Bureau of Surveying and Mapping)
© 2008 by Taylor & Francis Group, LLC
186 Wetland and Water Resource Modeling and Assessment
REFERENCES
Bernard, P., and L. Antoine. 2004. Principal component analysis: An appropriate tool for
water quality evaluation and management-application to a tropical lake system. Eco-
logical modeling 295–311.
Guan, R. S., 2001. Countermeasures on prevention and control of soil and water loss and
effects towards ood control of Jiangxi Province. Soil and Water Conservation in
China (10):21–22.
Sankoh, O. A. 1996. An evaluation of the analysis of ecological risks method in environmen-
tal impact assessment. Environmental Impact Assessment Review 16:183–188.
Shen, W., J. Zhang, and W. Wang. 2004. Ecological environmental quality assessment of the
Three Gorges reservoir area based on remote sensing and GIS. Resources and environ-
ment in the Yangtze Basin 13(2):159–162.
Tan, Q. L., S. W. Bi, J. P. Hu, and Z. J. Liu. 2004. Measuring lake water level using multi-
source remote sensing images combined with hydrological statistical data. Geoscience
and Remote Sensing Symposium, 2004, Vol. 7. Anchorage, AK: Institute of Electrical
and Electronics Engineers, 4885–4888.
Wang, S. Y., Z. X. Zhang, and X. L. Zhao. 2002. Eco-environment synthetic analysis based on
RS and GIS technology in Hubei province. Advances in Earth Science 17(3):426 –431.
Wang, S. Y., G. Q. Wang, and Z. X. Chen. 2004. Eco-environmental evaluation and changes
in Yellow River basin. Journal of Mountain Science 22(2):133–139.
Zhen, W., and S. P. Chen. 1995. Introduction to resource remote sensing [in Chinese]. Beijing:
Press of Chinese Science and Technology, 103–168.
© 2008 by Taylor & Francis Group, LLC