WETLAND AND WATER RESOURCE MODELING AND ASSESSMENT: A Watershed Perspective - Chapter 19 ppt
Bạn đang xem bản rút gọn của tài liệu. Xem và tải ngay bản đầy đủ của tài liệu tại đây (207.44 KB, 15 trang )
231
19
Watershed Science
Essential, Complex,
Multidisciplinary,
and Collaborative
R. Jan Stevenson, Michael J. Wiley, Stuart H. Gage,
Vanessa L. Lougheed, Catherine M. Riseng,
Pearl Bonnell, Thomas M. Burton,
R. Anton Hough, David W. Hyndman,
John K. Koches, David T. Long,
Bryan C. Pijanowski, Jiaquo Qi, Alan D. Steinman,
and Donald G. Uzarski
19.1 WATERSHED SCIENCE: ESSENTIAL
Sustainability of ecosystem services for human well-being will require thinking at
multiple spatial and temporal scales (Kates et al. 2001). Large-scale assessment of
global change provides an overview of the diversity of environmental problems that
are occurring and are likely to occur in the future (Millennium Ecosystem Assess-
ment 2005). However, even global assessments require scaling to smaller areas to
account for local variations in ecosystems, human activities affecting those ecosys-
tems, and societal values that value different elements of ecosystems. Watersheds
provide an important geospatial unit for the science of water resource management
because of the greater interaction between humans and ecosystems within watershed
boundaries than across watershed boundaries.
In this paper, we describe the importance of watershed science for watershed
management and regional sustainability. We also describe how scientists and other
stakeholders from many disciplines must work together to solve and prevent environ-
mental problems, and that those collaborations have great benets for the individuals
involved, their science, and society. To illustrate the concepts discussed, examples
will be provided from the Muskegon Watershed Research Partnership (MRWP). The
MRWP conducts an integrated research effort on one of the largest and most eco-
logically diverse watersheds of the Great Lakes region in the United States.
Scientists and policy makers often lament the lack of research and knowledge
that are necessary to make the difcult decisions that frequently face resource man-
agers (Brewer and Stern 2005). Scientists need to provide information that answers
the following fundamental questions: Is there a problem in our ecosystem? What
© 2008 by Taylor & Francis Group, LLC
232 Wetland and Water Resource Modeling and Assessment
is causing the problem? How can we x the problem? These problems range from
large-scale climate change problems to many regional problems related to land use
and water quality in watersheds. Research has obviously provided knowledge to help
identify problems and solutions, but often it does not go far enough, such as char-
acterizing the frequency, intensity, and duration of problems, their direct linkage to
human well-being, and the risk of problems with specic levels of contamination and
habitat alteration.
In this paper, we work at the watershed scale to consider ecological health ques-
tions related to alterations and contamination of water bodies by human activities.
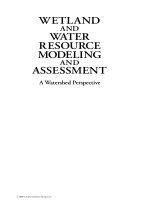
However, we work within a larger conceptual framework than traditional water qual-
ity assessment (Figure 19.1) because it considers the feedback of human activities on
all aspects of human well-being. Human activities produce contaminants and habi-
tat alterations that affect both ecological and human health. Ecological and human
health, as well as many other factors, are measurable attributes of ecosystem services
and human well-being (Parris and Kates 2003). In this model, human and ecologi-
cal systems are integrated, but categorized into four groups by the way information
is used in environmental management. The delineation and numbers of categories
are not as important as identifying the interrelationships of elements within these
categories and how they are used. Such information can be used to manage human
activities with geospatially aware policies that minimize contaminants or habitat
alterations and optimize ecological and human health. Tradeoffs among elements
of human well-being are important considerations for management actions. Based
on management actions, human activities can be altered and regulated to minimize
contaminants and habitat alterations.
Sound science is essential for characterizing environmental condition and deter-
mining whether or not problems exist, for diagnosing the contaminants and habitat
alterations that are causing problems, and for developing management options for
solving these problems. To assess problems, we need to be able to precisely monitor
valued ecological attributes (VEAs) such as biodiversity, sheries production, and
water quality for human health. In addition, the technical expertise is needed for
Contaminants &
Habitat Altera tions
Ecosystem Health
Human Health
Environmental Health
Human Well-Being
Human Activities
1. Urban
2. Agricultural
3. Forestry
4. Riparian Buffer Strips
5. Ecosystem Restoration
1. Security
2. Basic material for a
good life
3. Health
4. Good social relations
5. Freedom of choice
and action
FIGURE 19.1 Conceptual gure of the role of watershed management in support of human
health, ecological health, and thereby human well-being.
© 2008 by Taylor & Francis Group, LLC
Watershed Science 233
accurate measurement of contaminants and habitat alterations to determine whether
or not they could be causing problems. Knowledge of relationships among VEAs and
contaminants or habitat alterations, and how to detect these relationships, is neces-
sary to characterize risks of problems at specic VEA levels. Indeed, knowledge of
relationships among human activities, contaminants and habitat alterations, VEAs,
human health, and measures of human well-being will enable more rigorous evalua-
tion of the tradeoffs that may be necessary between short-term economic growth and
long-term sustainable environmental quality (Kates et al. 2001).
19.2 WATERSHED SCIENCE: COMPLEX
Complexity in watershed science is caused by many factors, such as: the many
VEAs for which watersheds are managed; the many human activities, contami-
nants, and habitat alterations that affect VEAs and human well-being; nonlinearity
in simple relationships and synergistic or antagonistic interactions in more com-
plex relationships; new processes being important as spatial scales expand; and time
lags in cause–effect interactions. This complexity can be managed to provide the
information needed to make management decisions with reasonable certainty of
success. Organizing the information gathering, analysis, and decision-making pro-
cesses helps solve complex problems.
Frameworks for environmental assessment and management can be used to
organize the problem-solving process and to list the issues that should be considered.
Numerous frameworks have been proposed and, fortunately, they all have much in
common (e.g., USEPA [U.S. Environmental Protection Agency] 1996, 2000b, Ste-
venson et al. 2004a). They all emphasize the continual process of assessment and
management to rene management strategies and to ensure and improve manage-
ment results. In general, frameworks developed by natural scientists start with den-
ing the problem in terms of ecological or human health, whereas political scientists
would argue that we should start by considering what is needed to make a good
management decision (Dietz 2003). The latter approach has merit because it sets the
breadth of scope of factors that should be considered in an environmental assess-
ment, which should include economic and social factors as well as ecological and
human health goals.
Because the MWRP assessment is based on the framework of Stevenson et al.
(2004a), it incorporates concepts from the broader work of Barbour et al. (2004),
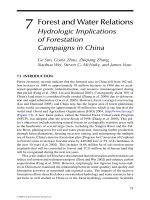
Suter (1993), and the USEPA (1996). The framework in Stevenson et al. (2004a)
emphasizes four stages: study design, environmental characterizations, stressor
diagnosis, and management (Figure 19.2).
19.2.1 ASSESSMENT DESIGN
The rst MWRP effort involved gathering stakeholders from the watershed to list the
environmental issues that should be considered, and then developing a series of plans
for implementing the assessment. This was the very beginning of the design stage
where objectives of the assessment were determined. The stakeholders included rep-
resentatives from environmental groups, businesses that would be regulated, local
© 2008 by Taylor & Francis Group, LLC
234 Wetland and Water Resource Modeling and Assessment
and state government agencies, the scientic community, and funding agencies that
would support the ongoing work of the MRWP. A series of meetings was held to
discuss the range of issues that should be considered and how the assessment should
be done. Stakeholders then organized themselves into working groups so that each
group was involved with a slightly different but interrelated project that would con-
tribute to the watershed assessment.
In the design stage, the MRWP dened objectives, developed a conceptual model
linking human activities to environmental conditions, and developed a sampling plan.
Among the many ecosystem services supported by the Muskegon River watershed
(MRW), stakeholders decided that biological condition and sheries production were
valued ecological attributes that should be “endpoints” in our assessment. Stakehold-
ers also decided that conditions of streams, lakes, and wetlands should be studied.
Biological condition and sheries production are two “uses” for which the state
of Michigan manages its waters. Uses have signicance in U.S. regulations because
they dene the goals of environmental management (USEPA 1994). Management
actions in the United States are triggered by violations of environmental criteria,
which are directly related to supporting specic uses of waters. For example, the use
of a water body may be dened as warm-water aquatic life use, as well as recreation,
domestic or industrial water supply, and navigation. All waters are assigned to sup-
port from one to all uses. When a use is assigned for a water body, then either narra-
tive or numerical characterizations of conditions of that water body are established
as criteria that indicate support of that use. Narrative criteria might be “absence of
B
Objectives
Conceptual
Model
DESIGN
Sampling Plan
• Testable Hypotheses
• Scale of Assessment
• Indicator Selection
• Sites Selection
• Sampling Methods
• QA/QC Plan
•Old vs. New Data
CHARACTERIZATION
Stressor-Response
Relationships
Cause/reat
Assessment
DIAGNOSIS
Management
Options
Management
Decision/Implementation
MANAGEMENT
Economic,
Social &
Other Factors
Evaluate Effectiveness
of Rest oration and
Protection Efforts
Anthropogenic
Effects Assessment
Stressor Indicators
Land Use Indicators
Expected
Condition
Response Indicators
Stre
Stressor Indicators
Land Use Indicators
Observed
Condition
Management
Options
Evaluate Effectiveness
of Restoration and
Protection Efforts
Response Indicators
FIGURE 19.2 The protocols for ecological assessment related in a framework. Three major
steps, study design, analysis, and integration, are emphasized (from Stevenson et al. 2004a).
© 2008 by Taylor & Francis Group, LLC
Watershed Science 235
nuisance algal growths” or “natural balance of ora and fauna.” Numeric criteria
relate to specic, quantitative levels of species composition, species diversity, and
productivity of the habitat. Uses also have value as targets of environmental research
because we need to understand how human activities affect contaminants and habi-
tat alterations, and how those directly affect uses. Environmental research can help
quantify this understanding sufciently to justify numeric criteria, which reduces the
ambiguity of interpreting narrative criteria while making management decisions.
Fisheries production in the Great Lakes region is commercially important for
the sport-shing industry, which is a major recreational industry in the Great Lakes
region. Biological condition is an important attribute of ecological assessment
because it provides a good indicator of structure and function of ecosystems (Anger-
meier and Karr 1994), and thereby supports an integrated assessment of the four
types of ecosystem services described in the Millennium Ecosystem Assessment
(2005): supporting, provisioning, regulating, and cultural. The U.S. Clean Water
Act calls for “protecting the physical, chemical, and biological integrity.” Biological
integrity is a high level of biological condition. Biological condition can be measured
as deviation from a natural or some other desired condition (Hughes 1995). Biologi-
cal condition is a relatively precise indicator compared to some temporally variable
measures of physical and chemical condition because the biota present in a habitat
reect historic as well as current physical and chemical conditions in the habitat.
Waters with high biological integrity are assumed to be safe for many other uses
because waters are close to natural. Thus, biological condition has been adopted as
an essential element in water quality assessments under the U.S. Clean Water Act
and the Water Framework Directive of the European Union.
After identifying overall targets for the assessment, the MRWP developed a
study design to interrelate all elements of the assessment. The MRWP project had
three basic objectives. First, we wanted to assess the current condition of streams,
lakes, and wetlands in the watershed. Second, we wanted to develop a model of the
system so that we could predict results of management actions and forecast future
changes in the watershed under different management scenarios. Finally, we wanted
to communicate results of our assessment to the stakeholders, including the public
and government ofcials.
Stakeholders then developed a conceptual model of the system that we wanted
to understand. With stakeholder delineation of biological condition and sheries pro-
duction as VEAs for the project, we needed to determine the other factors that were
likely important in the relationships among human activities, contaminants and habi-
tat alterations, and VEAs. Based on previous knowledge, the MRWP hypothesized
that dams, sediments, habitat loss, stream channelization, nutrient enrichment, and
invasive species would be important contaminants and habitat alterations affecting
biological condition and sheries production. Human health endpoints associated with
microbial contamination of recreational areas were assessed as important, but were
considered beyond the scope of studies that could be afforded at the time. It was also
decided that land use and land cover would be important factors to consider in the
assessment and modeling that would need to distinguish between natural variation in
ecosystems versus human effects on ecosystems. Finally, land use in the past as well as
the future was considered to account for legacies of past activities in the watershed.
© 2008 by Taylor & Francis Group, LLC
236 Wetland and Water Resource Modeling and Assessment
To achieve the three MRWP objectives, several project modules emerged,
each with a team of scientists and stakeholders having expertise and interest in
accomplishing tasks in the project dened by the scope of the conceptual model.
All projects involved with the assessment and modeling adopted the general con-
ceptual model illustrated in Figure 19.1, in which human activities, contaminants
and habitat alterations, and VEAs were specically related. One project focused
on rening land use land cover characterizations of the watershed. Another proj-
ect had the responsibility of assessing biological condition, sheries production,
and contaminants and habitat alterations in the watershed. A third major proj-
ect was responsible for synthesizing results of the assessment and developing an
integrated, process-based watershed-scale model. Other projects on economic
development, human health, and methods for communicating results to the public
received less funding or were postponed until funding opportunities develop. As
a result, all projects that were funded assumed responsibility for communicating
results to stakeholders.
Land use land cover characterizations were designed to characterize natural fea-
tures and human activities in the watershed. Both natural and human features of the
landscape are important for characterizing the natural potential for a water body,
how human activities have affected it, and how human activities can be regulated to
minimize effects. Satellite imagery was used to characterize land use land cover in
the watershed. Extensive ground truthing was conducted by eld crews. This infor-
mation was made available to the teams working on water body assessment and the
watershed model.
Assessment of biological condition, sheries production, and contaminants and
habitat alterations in water bodies of the MRW involved developing a detailed sam-
pling plan that would achieve the objectives of characterizing conditions and diag-
nosing causes and threats to VEAs. We used three different approaches for sample
site selection to achieve three slightly different objectives in our assessment.
1. To characterize the condition of all water bodies in the watershed, we selected
sampling sites within the watershed using a random sampling design strati-
ed by water body type (streams, lakes, and wetlands). Random sampling
enables scaling assessments from a fraction of all water bodies to an unbiased
estimate of conditions in all streams, lakes, and wetlands in the watershed.
2. A stratied random sampling design with strata dened by water body type
and land use was used to develop stressor-response relationships between
VEAs, contaminants and habitat alterations, and human activities. Stressor-
response relationships were going to be important for diagnosing causes
and threats of VEA impairment (Figure 19.2) and in renements of more
complex, process-based watershed models. This called for sampling out-
side the boundary of the MRW to nd sufcient numbers of water bodies
with higher levels of human activity.
3. Sites also were selected because of special interest by stakeholders. For
example, all large lakes in the watershed were selected because of their
economic importance. Intensive sampling was also targeted in the lower
Muskegon River where the Great Lakes sport shing is concentrated.
© 2008 by Taylor & Francis Group, LLC
Watershed Science 237
The variables that we selected for measurement varied among streams, lakes,
and wetlands. The same land use land cover variables were selected for each water
body type. Similar chemical variables were measured in all habitats, except for more
detailed trace-element studies in rivers. The latter substudy was designed to use
ratios among trace elements to provide landscape signatures of human activities;
these signatures are being used as another line of evidence of the relative importance
of different levels of human activities in watersheds (Wayland et al. 2003). Different
physical variables were measured in each water body type due to the nature of their
physical structures.
Multiple biological attributes were measured for each water body type to provide
more thorough assessments from the perspective of differing responses to stressors
and to increase precision of water body assessments with multiple lines of evidence
and multiple measurements. Biological attributes measured in each water body type
varied depending upon the diversity of biological assemblages in that water body
type and the likelihood of developing precise metrics of biological condition with the
assemblages. Algae and benthic macroinvertebrates were measured in each water
body type. Planktonic algae were assessed in lakes and benthic algae were assessed
in streams and wetlands. Meiofauna such as zooplankton were assessed in wetlands
and lakes. Fish were assessed primarily in streams and rivers. Fish data collected as
part of government studies will be used for lake assessments.
New indicator development was an important project of the MRWP. New mod-
ications of biological metrics will be made to improve their application for the
MRW and for application in streams, lakes, and wetlands. In addition, new variables
are being assessed in the MRW. For example, remote sensing methods are being
rened to more accurately assess algal biomass in lakes and vegetation type and pro-
ductivity in wetlands. Sound variables are also being used to characterize the level of
human activity in watersheds and the biological condition of birds and amphibians
that can be heard.
19.2.2 ASSESSMENT CHARACTERIZATION
Characterizing condition requires comparison of expected and observed conditions
in VEAs and both contaminants and habitat alterations (Figure 19.2). Land use land
cover measurements are important for dening expected condition and develop-
ing tools to diagnose problems for and threats to VEAs. Expected condition can be
dened in many ways (Stevenson et al. 2004a): a desired condition such as high sh-
eries production; an a priori legally dened standard; the natural condition occurring
if human effects were very low; or some acceptable deviation from natural condi-
tions. Characterizing condition in an environmental assessment is then dened as the
deviation in observed condition at a site from the expected condition for that site.
Expected condition in many assessment programs is based on the concept of ref-
erence condition (Hughes et al. 1986). Reference conditions can be characterized as
(1) minimally disturbed in the region, (2) the best attainable with restoration, or (3)
natural (Stoddard et al. in press). Extensive literature covers characterization of ref-
erence condition (e.g., Hughes and Larsen 1988, Hughes 1995, Barbour et al. 1999,
Hughes et al. 2000). We chose two methods for dening expected condition:
© 2008 by Taylor & Francis Group, LLC
238 Wetland and Water Resource Modeling and Assessment
1. A reference condition for minimally disturbed sites in the region will be the
75th percentile of the frequency distribution of attributes at sites that have
low levels of human disturbance in watersheds. This approach is commonly
used for ecological assessments (European Commission 2000, Hughes et
al. 2000).
2. A regression-based method for dening expected condition based on natu-
ral conditions (with human disturbance close to zero) and variations in nat-
ural conditions, which was proposed by Wiley et al. (2002). Thus, expected
condition varies among habitat types and is rened for natural variability
among sites of the same water body type. For example, low-gradient, warm-
water streams will have a different expected condition than high-gradient,
cold-water streams. Large, deep lakes will have different expectations than
small, shallow lakes. The advantages of Wiley’s method include a more
standardized comparison of observed condition to a natural reference con-
dition, a renement of characterizations based on natural variation among
sites, and the ability to develop these predictive models of expected condi-
tion when few high-quality sites exist.
19.2.3 A SSESSMENT DIAGNOSIS
Toxicological literature (Suter 1993, Lippman and Schlesinger 2000, USEPA 2000a)
has reviewed numerous methods for diagnosing the contaminants and habitat altera-
tions that pose the greatest threats to VEAs or are the likely causes of problems with
VEAs. Stressor-response relationships, in this case between VEAs and contami-
nants or habitat alterations, are essential for relating observed conditions in habitats
to likely risks of impairment due to specic contaminants and habitat alterations
(Stevenson et al. 2004b). Although deviation of physical, chemical, and non-native
species characteristics at a site from the expected condition for that site can be used
to list potential causes of impairment, diagnosis of the contaminants and habitat
alterations that most likely threaten or cause impairment of VEAs is more certain
with quantitative stressor-response relationships. For example, changes in some
physical and chemical attributes may have little effect on VEAs, whereas others
have great effects.
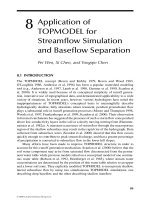
Stressor-response relationships can be developed with experimental and eld-
survey results (Figure 19.3). Laboratory bioassays and even eld experiments can be
used to determine stressor-response relationships where levels of contaminants and
habitat alterations are experimentally manipulated. While experimental approaches
such as these are extremely valuable for documenting cause-effect relationships,
transferal of results to large-scale eld situations may be problematic. Experiments,
by their nature, are typically conducted at much shorter temporal scales and smaller
spatial scales than long-term, large-scale responses of ecological systems to contam-
inants and habitat alterations. Thus, stressor-response relationships based on eld
data are particularly valuable for determining the levels of contaminants and habitat
alterations that cause unacceptable changes in VEAs.
In the MRW assessment, thresholds in stressor-response relationships will be
used to establish benchmarks for contaminants and habitat alteration that cause
© 2008 by Taylor & Francis Group, LLC
Watershed Science 239
unacceptable changes in VEAs (Stevenson et al. 2002, King and Richardson 2003).
Thresholds are delineated as sudden changes in VEAs with relatively small increases
in stressors (Figure 19.3). Benchmarks for contaminants and habitat alterations that
cause threshold responses will be used to calculate hazard quotients (Suter 1993,
Tannenbaum et al. 2003), which are ratios of observed conditions to the benchmark
condition. Hazard quotients are also referred to as toxic units in some toxicological
literature. Higher hazard quotients indicate a higher likelihood that a contaminant or
habitat alteration is either threatening or causing impairment of VEAs. If nonlinear
relationships between stressors and VEAs are not observed, then alternative meth-
ods will be used to establish stressor benchmarks (e.g., Setzer and Kimmel 2003).
Changes in sensitive and tolerant species will also be used to diagnose the con-
taminants and habitat alterations causing impairment. Relative sensitivities and
tolerances of many organisms to pollution are documented in the literature. By com-
paring changes in species composition of observed sites compared to reference sites,
inferences can be made about likely stressors. This provides another line of evidence
to support diagnoses with hazard quotients.
Ecological Attribute A
Low
Stressor Gradient
Ecological Attribute B
Low
Low (Ref)
High
High
High
B
FIGURE 19.3 Relationships between valued ecological attributes and contaminants
are important for both protection and restoration of ecosystems. In this gure, attribute
A responds linearly to a contaminant or habitat alteration (stressor), whereas attribute B
shows assimilative capacity of the stressor until a threshold response is observed. Threshold
responses help justify benchmark stressor levels, which can be used as targets for restoring
habitats or levels of protection for high-quality habitats. Attributes with threshold responses
help justify designation of specic levels of stressors as management targets (Muradian 2001,
Stevenson et al. 2004b).
© 2008 by Taylor & Francis Group, LLC
240 Wetland and Water Resource Modeling and Assessment
19.2.4 ASSESSMENT FORECASTING
Although forecasting environmental change is not usually part of watershed assess-
ments, it has become important in climate change assessments and in large-scale
assessments of global environmental change. The MRWP includes assessment
forecasting using traditional as well as innovative approaches. The more traditional
methods of assessment forecasting may predict the effects of managing human
activities in the watershed when human activities are regulated in different ways,
such as dam removals, reduced fertilizer application and groundwater withdrawal,
bank stabilization to reduce sedimentation, and restoration of riparian buffer zones.
Responses to these management actions can be predicted with a system of process-
based models. This is part of the responsibility of the MRWP modeling project,
which is developing an integrated modeling system that includes watershed and in-
stream hydrologic models, biogeochemical models, and biological response models
(Wiley et al. this book).
Long-term forecasting of land use land cover change in a watershed and eco-
logical results of future human activities can also be part of the assessment pro-
cess. Forecasting assesses likely conditions in the future given current conditions
and predicted changes to those conditions. The MRWP includes a special subproject
that is developing a rened model of land use land cover change that is specically
calibrated to the MRW. This model is being integrated within the modeling system
to predict long-term responses to different management actions (Tang et al. 2005).
19.2.5 MANAGING COMPLEXITY
The MRWP employs several methods to manage the complexity of the ecologi-
cal systems being studied and of the assessment process itself. Focusing on clearly
dened endpoints or VEAs helps limit factors being assessed to those related to the
VEAs, in this case, biological condition and sheries production. Use of an inte-
grated assessment framework provided a roadmap of the steps to take and issues to
consider during the assessment. This roadmap also included a list of tasks to be com-
pleted with assignments of responsibilities to each principle investigator (PI). Creat-
ing independent projects within the MRWP with optimal interconnection among
projects also made the MRWP process more manageable and more likely to suc-
ceed. With tasks clearly identied for each project, the specic data required for the
MRWP was also dened. The independent projects enable high levels of interaction
within smaller groups of scientists without the cost of including all MRWP scientists
in every conversation. As with natural systems, modularity also makes project sys-
tems more stable and easier to manage.
19.3 WATERSHED SCIENCE:
MULTIDISCIPLINARY AND COLLABORATIVE
An extraordinary breadth of expertise is needed to assess and manage environmen-
tal problems. In the MRWP, which is limited to just the assessment, scientists from
ve universities and many more disciplines are involved. Most are natural scientists
because the MRWP focuses on ecological health, but even this group is diverse and
© 2008 by Taylor & Francis Group, LLC
Watershed Science 241
represents zoology, botany, geochemistry, entomology, limnology, hydrology, and
geography. Without the experience of experts in each of these areas, our ability to
conduct an integrated assessment at this scale would not be possible.
The success of the MRWP will be a result of it being multidisciplinary and
collaborative. Interdisciplinary indicates interactions among disciplines, but higher
levels of collaboration are required to integrate work thoroughly across so many
disciplines. Collaboration is also required for brainstorming ideas about assessment
approaches, variables to measure, methods of measurement, and methods of analy-
sis. Compromises are necessary for this collaboration with all PIs sacricing some of
their independence to cooperate in the planning and timing of sampling and sample
analysis. Collaboration will be an essential part of the interpretation and synthesis of
our results as well as the planning and implementation of the project.
Rules of collaboration have been important for dening expectations of PIs, data
sharing, and coauthorship on research papers. Establishment and agreement to these
rules by PIs provided all with a sense of security for intellectual property. For the
MWRP, we have rules for both sharing data and coauthorship of papers (see appen-
dix A). Sharing data is critical for the multidisciplinary questions being asked, such
as relating land use, hydrology, biogeochemistry, and biological condition. With data
sharing come acknowledgments of contributions made by coauthors when results are
shared during publication.
Collaboration has costs, particularly with time. Most importantly, good multi-
disciplinary collaborations with high levels of innovation require signicant levels
of communication among PIs. Extra time is needed for brainstorming ideas, making
decisions, discussing and explaining plans, and coordinating the implementation of
the project. This communication often takes extra time as colleagues from different
disciplines learn the language of other disciplines. Many times a word has a different
use or meaning in different disciplines. Specic tasks for specic teams within the
project need to be detailed so they are conducted in a way that meets the objectives
of the project. Those tasks need to produce data in formats that are compatible with
a projectwide database and that have common features, such as data table format,
codes for sites, and codes and units for variables. Detailing specics before data col-
lection is best, and that does not preclude modifying those plans when unforeseen
problems develop.
Collaborations in multidisciplinary research provide great rewards that out-
weigh the sacrices. First, all collaborators learn a great deal from their colleagues.
New ideas and perspectives from different disciplines are particularly valuable and
move all disciplines forward. This is particularly evident during the design and
planning stages, but also during review of results. Getting input from colleagues
across disciplines produces a more thorough and high-quality nal product in the
publications resulting from the research. Multidisciplinary projects often generate
a core of information that can be leveraged against new projects. For example, the
core data from the Muskegon assessment project has helped garner two to three
times as much funding on complementary projects that build on this core dataset.
And, nally, as noted in the introduction, close collaboration by an integrated mul-
tidisciplinary team of experts is essential for developing successful solutions for
environmental problems.
© 2008 by Taylor & Francis Group, LLC
242 Wetland and Water Resource Modeling and Assessment
ACKNOWLEDGMENTS
This MWRP research is funded by the Great Lakes Fisheries Trust and the Wege
Foundation. Peter Wege, Bill Cooper, and Jack Bails led the effort to coordinate
funding of the MWRP and the gathering of stakeholders to start the partnership.
REFERENCES
Angermeier, P. L., and J. R. Karr. 1994. Biological integrity versus biological diversity as
policy directives. BioScience 44:690–697.
Barbour, M., S. Norton, R. Preston, and K. Thornton. 2004. Ecological assessment of aquatic
resources: Linking science to decision-making. Pensacola, FL: Society of Environmen-
tal Toxicology and Contamination Publication.
Barbour, M. T., J. Gerritsen, and B. D. Snyder. 1999. Rapid bioassessment protocols for use
in wadeable streams and rivers, 2
nd
ed. EPA 841-B-99-002. Washington, DC: United
States Environmental Protection Agency.
Brewer, G. D., and P. C. Stern, eds. 2005. Decision making for the environment: Social and
behavioral research priorities. Washington, DC: National Academies Press.
Dietz, T. 2003. What is a good decision? Criteria for environmental decision making. Human
Ecology Review 10:60–67.
European Commission. 2000. Directive 2000/EC of the European Parliament and of the
Council—Establishing a framework for community action in the eld of water policy.
Brussels, Belgium: European Commission.
Hughes, R. M. 1995. Dening acceptable biological status by comparing with reference con-
ditions. In Biological assessment and criteria: Tools for water resource planning and
decision making, ed. W. S. Davis and T. P. Simon. Boca Raton, FL: Lewis Publishers,
31– 47.
Hughes, R. M., D. M. Larsen, and J. M. Omernik. 1986. Regional reference sites: A method
for assessing stream potentials. Environmental Management 10:629–635.
Hughes, R. M., and D. P. Larsen. 1988. Ecoregions: An approach to surface water protection.
Journal of the Water Pollution Control Federation 60:486–493.
Hughes, R. M., S. G. Paulsen, and J. L. Stoddard. 2000. EMAP—surface waters: A mul-
tiassemblage, probability survey of ecological integrity in the USA. Hydrobiologia
422:429–443.
Kates, R. W., W. C. Clark, R. Corell, J. M. Hall, C. C. Jaeger, I. Lowe, J. J. McCarthy, H.
J. Schellnhuber, B. Bolin, N. M. Dickson, S. Faucheux, G. C. Gallopin, A. Grübler,
B. Huntley, J. I. Jäger, N. S. Jodha, R. E. Kasperson, A. Mabogunje, P. Matson, H.
Mooney, B. Moore III, T. O’Riordan, and U. Svedlin. 2001. Sustainability science.
Science 292:641–642.
King, R. S., and C. J. Richardson. 2003. Integrating bioassessment and ecological risk assess-
ment: An approach to develop numeric water quality criteria. Environmental Manage-
ment 31:795–809.
Lippman, M., and R. B. Schlesinger. 2000. Toxicological bases for the setting of health-
related air pollution standards. Annual Review of Public Health 21:309–333.
Millennium Ecosystem Assessment. 2005. Ecosystems and human well-being: Synthesis.
Washington, DC: Island Press.
Muradian, R. 2001. Ecological thresholds: A survey. Ecological Economics 38:7–24.
Parris, T. M., and R. W. Kates. 2003. Characterizing and measuring sustainable development.
Annual Review of Environment and Resources 28:559–586.
Setzer, R. W., Jr., and C. A. Kimmel. 2003. Use of NOAEL, benchmark dose, and other mod-
els for human risk assessment of hormonally active substances. Pure Applied Chemis-
try 75:2151–2158.
© 2008 by Taylor & Francis Group, LLC
Watershed Science 243
Stevenson, R. J., R. C. Bailey, M. C. Harass, C. P. Hawkins, J. Alba-Tercedor, C. Couch, S.
Dyer, F. A. Fulk, J. M. Harrington, C. T. Hunsaker, and R. K. Johnson. 2004a. Design-
ing data collection for ecological assessments. In Ecological assessment of aquatic
resources: Linking science to decision-making, ed. M. T. Barbour, S. B. Norton, H. R.
Preston, and K. W. Thornton. Pensacola, FL: Society of Environmental Toxicology and
Contamination, 55–84.
Stevenson, R. J., R. C. Bailey, M. C. Harass, C. P. Hawkins, J. Alba-Tercedor, C. Couch,
S. Dyer, F. A. Fulk, J. M. Harrington, C. T. Hunsaker, and R. K. Johnson. 2004b.
Interpreting results of ecological assessments. In Ecological assessment of aquatic
resources: Linking science to decision-making, ed. M. T. Barbour, S. B. Norton, H. R.
Preston, and K. W. Thornton. Pensacola, FL: Society of Environmental Toxicology and
Contamination, 85–111.
Stevenson, R. J., Y. Pan, and P. Vaithiyanathan. 2002. Ecological assessment and indica-
tor development in wetlands: The case of algae in the Everglades, USA. Verhand-
lungen Internationale Vereinigung für Theoretische und Andgewandte Limnologie
28:1248–1252.
Stoddard, J. L., D. P. Larsen, C. P. Hawkins, R. K. Johnson, and R. H. Norris. In press. Setting
expectations for the ecological condition of streams: The concept of reference condi-
tion. Ecological Applications.
Suter, G. W. 1993. Ecological risk assessment. Boca Raton, FL: Lewis Publishers.
Tang, Z., B. A. Engel, B. C. Pijanowski, and K. J. Lim. 2005. Forecasting land use change
and its environmental impact at a watershed scale. Journal of Environmental Manage-
ment 76:35–45.
Tannenbaum, L. V., M. S. Johnson, and M. Bazar. 2003. Application of the hazard quotient
method in remedial decisions: A comparison of human and ecological risk assessments.
Human and Ecological Risk Assessment 9:387–401.
U.S. Environmental Protection Agency (USEPA). 1994. Water quality standards handbook,
2nd ed. EPA/823/b/94/005a, Washington, DC: U.S. Environmental Protection Agency.
U.S. Environmental Protection Agency (USEPA). 1996. Strategic plan for the Ofce of
Research and Development. EPA/600/R/96/059. Washington, DC: U.S. Environmental
Protection Agency.
U.S. Environmental Protection Agency (USEPA). 2000a. Stressor identication guidance doc-
ument. EPA 600/R/96/059. Washington, DC: U.S. Environmental Protection Agency.
U.S. Environmental Protection Agency (USEPA). 2000b. Toward integrated environmental
decision-making. EPA/SAB/EC/00/001. Washington, DC: U.S. Environmental Protec-
tion Agency.
Wayland, K. G., D. T. Long, D. W. Hyndman, B. C. Pijanowski, S. M. Woodhams, and S. K.
Haack. 2003. Identifying relationships between baseow geochemistry and land use
with synoptic sampling and R-mode factor analysis. Journal of Environmental Quality
32:180–190.
Wiley, M. J., P. W. Seelbach, K. Wehrly, and J. Martin. 2002. Regional ecological normaliza-
tion using linear models: A meta-method for scaling stream assessment indicators. In
Biological response signatures: Indicator patterns using aquatic communities, ed. T.
P. Simon. Boca Raton, FL: CRC Press, 197–218.
© 2008 by Taylor & Francis Group, LLC
244 Wetland and Water Resource Modeling and Assessment
Appendix
MUSKEGON PARTNERSHIP DATA SHARING AGREEMENT
Because of the collaborative nature of these projects, timely production and shar-
ing of data is critical to everyone’s success. Researchers participating in partnership
projects can share data via the GVSU (Grand Valley State University) server or by
directly contacting other researchers. Participating PIs are expected to both contrib-
ute relevant data themselves, and to use data from other collaborators in a respon-
sible fashion. Data set expectations should be negotiated for each specic proposal
task. The designated Task Leader and the funding Project Lead will be responsible
together for developing data set expectations for specic proposal tasks and for pub-
lishing them in a Project Data Catalog on the public web site.
Because our goal is good science, collaborators (as a condition of continued
funding) agree to a set of basic data-sharing principles and ethics as a condition of
access. Details vary depending on the designated release status of particular data
set; of which there are currently three:
Type 1: Public Domain: These are data available through the Web site or FTP
server which are either in the public domain as a matter of law (e.g. certain monitor-
ing data) or have been released for public distribution by collaborating researchers or
other research organizations. Anyone accessing these data from our server and using
them in publications and/or other research products is asked to provide:
1. Full acknowledgement and citation of the contributing researcher(s) using
the citation identied in the accompanying meta-data description.
2. Acknowledgment of access through the Muskegon Partnership program.
We will try to develop a standardized boiler-plate for this.
Type 2: Project-Shared: These are data sets that individual collaborators are
making available to other Muskegon collaborators, but do not want placed in the
public domain. The data would usually be accessible via the controlled-access FTP
site. All data collected as a part of the Muskegon Assessment and Modeling projects
funded by GLFT should be made available in this format within 2 years of produc-
tion (processing). Exceptions must be cleared with project leads (Stevenson at MSU
[Michigan State University] or Wiley at UM [University of Michigan]). Collaborators
using these data in publications and/or other research products agree to provide:
1. Full acknowledgement and citation of the contributing researcher(s) using
the citation rules specied by the researcher and identied in the cata-
logue meta-data.
2. Acknowledgment of access through the Muskegon Partnership Program.
3. Agreement not to distribute the data in question to third parties without the
written consent of the originating researcher.
© 2008 by Taylor & Francis Group, LLC
Watershed Science 245
Type 3: Team-Shared: These are data sets that individual researchers are inter-
ested in sharing with other collaborators in the context of a specic collaborative
analysis. The data might be made accessible via the controlled-access FTP site,
directly from the collaborating researcher. Most collected data should be released
with a Type 3 designation within 6 months of processing. MRI collaborators using
these data in publications and/or other research products are asked to provide:
1. Co-authorship and/or full acknowledgement and citation, details to be
negotiated with the contributing researcher(s).
2. Acknowledgment of access through the Muskegon Partnership Program.
3. Agreement not to distribute the data in question to third parties without the
written consent of the originating researcher.
Ordinarily data generated in these projects will progress from Type 3 to Type 1
availability on the following schedule:
1. Within 2 years of processing all data sets be will considered to be Type 2,
exceptions require approval by project lead scientist.
2. By the end of the project period (Dec. 2007) all core data will be considered
to be Type 1 (Public).
© 2008 by Taylor & Francis Group, LLC