WETLAND AND WATER RESOURCE MODELING AND ASSESSMENT: A Watershed Perspective - Chapter 21 (end) docx
Bạn đang xem bản rút gọn của tài liệu. Xem và tải ngay bản đầy đủ của tài liệu tại đây (355.05 KB, 13 trang )
259
21
Watershed Management
Practices for Nonpoint
Source Pollution Control
Shaw L. Yu, Xiaoyue Zhen, and Richard L. Stanford
21.1 INTRODUCTION
Water quality protection is very important to maintaining human health and ecologi-
cal integrity. A sustainable use of water resources is especially important in China due
to the rapid economic growth and the accompanying urbanization in recent years. Tra-
ditional control technology tends to emphasize the collection and treatment approach.
In recent years, control at the source is widely recognized as a more cost-effective
alternative. Because source control techniques impact on all sectors of a society, socio-
economic factors become important in the implementation of control measures.
The watershed protection approach (WPA) is a strategy for protecting and
restoring aquatic ecosystems and protecting human health. This strategy is based
on the notion that many water quality and ecosystem problems are best solved at the
watershed level rather than at the individual water body or discharger level. WPA is
an effective way to protect water quality while at the same time promoting a partner-
ship approach forged by all stakeholders so that a balanced scheme can be realized,
which will on the one hand protect the water resource in the watershed, and on the
other hand allow reasonable development in the watershed.
21.1.2 EFFECTS OF URBANIZATION ON THE WATER ENVIRONMENT
The environmental effects of urbanization are well known. However, most of the
attention given to the environmental effects of urbanization deal with air pollution
from the increased number of automobiles, water pollution from the increased den-
sity of population, and solid wastes. Only now is there increasing attention being
paid to the effects of urbanization on natural resources. We have tended to look at
the problems associated with such things as water supply only from the demand side
related to increased population and not from the supply side, considering the effect
that urbanization has on diminishing the supply.
The major impact of urbanization on the water environment can be summarized
as follows:
Hydrology—higher ood peaks, larger runoff volume, faster ood ows,
less evapotranspiration, and less groundwater recharge.
•
© 2008 by Taylor & Francis Group, LLC
260 Wetland and Water Resource Modeling and Assessment
Water quality—larger wastewater volumes, enhanced sediment and erosion
processes, and stormwater runoff pollution.
Aquatic biological integrity—habitat loss, biodiversity, toxicity, and so
forth.
21.1.2.1 Hydrology
The porous and varied terrain of natural landscapes like forests, wetlands, and
grasslands trap rainwater and snowmelt and allow it to slowly lter into the ground.
Inltrating water replenishes aquifers, and runoff tends to reach receiving waters
gradually. In contrast, nonporous and uniformly sloping urban landscapes, which
include features like roads, bridges, parking lots, and buildings, prevent runoff from
slowly percolating into the ground. Figure 21.1 shows the relationship between vari-
ous degrees of urbanization and the hydrologic cycle. It is clear that the predominant
effect is to reduce the amount of inltration and route the water into runoff.
Urban developers install storm sewer systems that quickly channel runoff from
impervious surfaces. When this collected runoff is discharged into streams, large vol-
umes of quickly owing runoff erode the banks, damage streamside vegetation, and
widen stream channels. In turn, this process results in lower water depths during non-
storm periods and higher than normal water levels during wet weather periods (i.e.,
ashiness), increases in sediment loads, and higher water temperatures, and so forth.
•
•
Natural Ground Cover 10%–20% Impervious Surface
FIGURE 21.1 Effect of urbanization on hydrology. (Federal Interagency Stream Restora-
tion Working Group (FISRWG). 1998. Stream corridor restoration: Principles, processes,
and practices. GPO Item No. 0120-A; SuDocs No. A 57.6/2:EN 3/PT.653. ISBN-0-934213-
59-3. />© 2008 by Taylor & Francis Group, LLC
Watershed Management Practices for Nonpoint Source Pollution Control 261
Figure 21.2 illustrates an example of the effect of urbanization on the rainfall-
runoff process, that is, higher ood peaks and shorter time of travel for the storm-
water runoff.
21.1.2.2 Water Quality and Ecological Impacts
In addition to adverse effects on hydrology, it is well established that urbanization
has signicant adverse effects on the quality of both surface and groundwater.
Aquatic life cannot survive in urban streams severely affected by urban runoff.
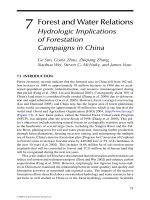
Figure 21.3 shows the relationship between the percentage of imperviousness in a water-
shed and the degree of stream degradation that can be expected. It is clear that once a
watershed reaches roughly 30% impervious surfaces, signicant degradation of streams
in terms of water quality and ecological health in that watershed can be expected.
The relationship between imperviousness in a watershed and stream quality is
based on empirical studies in the United States. Table 21.1 shows the results of a
nationwide study of the quality of stormwater in the United States. These results were
FIGURE 21.2 Hydrological impact of urbanization.
10
20
30
40
50
60
70
80
Degraded
Watershed Imperviousness
Stream Degradation
Impacted
Protected
FIGURE 21.3 Relationship between imperviousness in a watershed and stream quality. (See
color insert after p. 162.) (T. Scheuler. 1994 “The Importance of Imperviousness,” Center
for Watershed Protection, Columbia, MD., Watershed Protection Techniques 1(3):101.)
© 2008 by Taylor & Francis Group, LLC
Existing Condition
Developed Condition
Higher peak, more volume, and shorter time to peak
Q (Dis
charge)
T (Time)
262 Wetland and Water Resource Modeling and Assessment
obtained through the U.S. Environmental Protection Agency–sponsored Nationwide
Urban Runoff Program (U.S. Environmental Protection Agency [USEPA] 1983).
In Table 21.1 it can clearly be seen that there was a signicantly greater concen-
tration of pollutants in the stormwater from residential land use, mixed land use, and
commercial land use than from open/nonurban land use. This greater concentration,
combined with the increased discharge to streams in urban areas, results in greatly
increased loadings of pollutants in streams and other receiving waters. For example,
highway construction impacts include excessive sediment yield during construction
and runoff pollution from pavements and right-of-ways. For example, hydrologic
changes due to site cleaning, grading, increased imperviousness, and landscape
maintenance can cause stream channel instability, which could lead to stream bank
erosion and habitat degradation (Federal Highway Administration [FHWA] 2000).
21.2 WATERSHED MANAGEMENT STRATEGY AND PRACTICES
21.2.1 T
HE TMDL CONTROL STRATEGY
The TMDL (total maximum daily load) of a water body is dened as the total allow-
able loading of a pollutant from all sources, point and nonpoint, entering the water
body so that the water quality standards are not violated. For a water body the TMDL
can be expressed as:
TMDL = LC = WLA + LA + MOS (21.1)
TABLE 21.1
Median stormwater pollutant concentrations for all sites by land use.
Residential
Mixed
Land Use
Commercial
Open/
Nonurban
Pollutant Median COV Median COV Median COV Median COV
BOD
5
(mg/L) 10.0 0.41 7.8 0.52 9.3 0.31 — —
COD (mg/L) 73 0.55 65 0.58 57 0.39 40 0.78
Total soluble solids (mg/L) 101 0.96 67 1.14 69 0.85 70 2.92
TKN (µg/L) 1900 0.73 1288 0.50 1179 0.43 965 1.00
NO
2
-N+NO
3
-N (µg/L) 736 0.83 558 0.67 572 0.48 543 0.91
Total Phosphorus (µg/L) 383 0.69 263 0.75 201 0.67 121 1.66
Sol. Phosphorus (µg/L) 143 0.46 56 0.75 80 0.71 26 2.11
Total Pb (µg/L) 144 0.75 114 1.35 104 0.68 30 1.52
Total Cu (µg/L) 33 0.99 27 1.32 29 0.81 — —
Total Zn (µg/L) 135 0.84 154 0.78 226 1.07 195 0.66
Note: COV: coefcient of variation = standard deviation/mean; BOD = biological oxygen demand; COD
= chemical oxygen demand; TKN = total Kjeldahl nitrogen.
Source: U.S. Environmental Protection Agency (USEPA). 1983. Final Report, Nationwide Urban Runoff
Program. Washington, DC: U.S. Environmental Protection Agency.
© 2008 by Taylor & Francis Group, LLC
Watershed Management Practices for Nonpoint Source Pollution Control 263
where TMDL = total maximum daily load; LC = loading capacity of the water body;
WLA = portion of the TMDL allocated to point sources; LA = portion of the TMDL
allocated to nonpoint sources; and MOS = margin of safety or uncertainty factor.
The necessary components of a TMDL process should include the following:
Selection of the pollutant or pollutants to consider
Estimation of the water body assimilative capacity
Estimation of the pollution from all sources, including background
Simulation of the fate and transfer of pollutants in the water body and the
determination of total allowable load under critical or design conditions
Allocation of the allowable load among all sources in a manner enabling
water quality standards to be achieved
Consideration of seasonal variations and uncertainties
Inclusion of public and stakeholder participation
The TMDL process is currently the main driving force sustaining the water
quality control efforts throughout the United States. For example, in Virginia there
were more than 80 TMDL studies scheduled during the past decade. One of these
studies was conducted by the University of Virginia (Yu and Zhang 2001). The study
involved the development of a control strategy for nitrate pollution for the Muddy
Creek watershed in northwestern Virginia. The nitrate TMDL was rst determined
based on the assimilative capacity of Muddy Creek with respect to nitrate. The total
permissible loads were then distributed among various point and nonpoint sources
in the watershed. Different load reduction scenarios were generated and compared.
A nal load allocation scheme was selected after much discussion among the stake-
holders involved in the TMDL process.
21.2.2 BEST MANAGEMENT PRACTICE (BMP) TECHNOLOGY
Best management practices (BMPs) are structural or nonstructural practices designed
for the removal or reduction of nonpoint source pollution. Examples of these prac-
tices include storage facilities such as detention ponds, inltration facilities such
as inltration trenches and porous pavements; vegetative practices such as grassed
lter strips and swales, and constructed wetlands. More recently, the low-impact
development (LID) type of BMP has received a great deal of attention. These BMPs
and those that are especially appropriate for application in urban areas and highway
construction are briey discussed in the following sections.
21.3 PRACTICES FOR ECO-FRIENDLY URBAN
DEVELOPMENT AND HIGHWAY CONSTRUCTION
21.3.1 L
OW-IMPACT DEVELOPMENT (LID) TECHNIQUES
Low-impact development (LID) techniques are simple and effective, and are sig-
nicantly different from conventional engineering approaches, which emphasize the
•
•
•
•
•
•
•
© 2008 by Taylor & Francis Group, LLC
264 Wetland and Water Resource Modeling and Assessment
piping of water to low spots removed from the development area as quickly as pos-
sible. Instead, LID uses micro-scale techniques (sometimes known as ultra-urban
techniques) to manage precipitation as close to where it hits the ground as possible.
The basic principles of low-impact development include (Coffman 2001):
Restore/conserve natural hydrologic processes
Increase ow paths
Hydraulically disconnect impervious surfaces
Upland phytoremediation
Disburse runoff
Unique watershed storage
Minimize imperviousness
Multifunctional landscaping
Integrated micro-scale management
Retain
Detain
Recharge
Treat
One of the primary goals of LID design is to reduce runoff volume by inltrating
rainfall water to groundwater, evaporating rainwater back to the atmosphere after a
storm, and nding benecial uses for water rather than exporting it as a waste prod-
uct down storm sewers. The result is a landscape functionally equivalent to prede-
velopment hydrologic conditions, which means less surface runoff and less pollution
damage to lakes, streams, and coastal waters. LID practices include such techniques
as bioretention cells or rain gardens, grass swales and channels, vegetated rooftops,
rain barrels, cisterns, vegetated lter strips, and permeable pavements. Many of
these techniques both reduce runoff volume and lter pollutants from water before it
is discharged into receiving watercourses. Several of the most commonly used LID
practices are briey described below.
21.3.2 BIORETENTION
One of the key LID techniques is bioretention (sometimes referred to as rain gar-
dens). Bioretention is a terrestrial-based (upland as opposed to wetland), water qual-
ity and water quantity control practice using the chemical, biological, and physical
properties of plants, microbes, and soils for removal of pollutants from stormwater
runoff. Some of the processes that may take place in a bioretention facility include:
sedimentation, adsorption, ltration, volatilization, ion exchange, decomposition,
phytoremediation, bioremediation, and storage capacity (Prince George’s County
2002). Figure 21.4 shows a typical bioretention system.
Bioretention systems are more than simply creative landscaping. They are engi-
neered systems that have been designed and installed to promote the biological,
physical, and chemical treatment of stormwater runoff, as well as to promote the
inltration of stormwater runoff in order to help restore the character of the natural
hydrologic cycle of the area. Bioretention cells are comprised of six basic compo-
nents (U.S. EPA 2000).
•
•
•
•
•
•
•
•
•
•
•
•
•
© 2008 by Taylor & Francis Group, LLC
Watershed Management Practices for Nonpoint Source Pollution Control 265
These are:
Grass buffer strips that reduce runoff velocity and lter particulate matter.
Sand bed that provides aeration and drainage of the planting soil and assists
in the ushing of pollutants from soil materials.
Ponding area that provides storage of excess runoff and facilitates the set-
tling of particulates and evaporation of excess water.
Organic layer that performs the function of decomposition of organic mate-
rial by providing a medium for biological growth (such as microorganisms)
to degrade petroleum-based pollutants. It also lters pollutants and prevents
soil erosion.
Planting soil that provides an area for stormwater storage and nutrient
uptake by plants. Often the planting soils contain some clays, which adsorb
pollutants such as hydrocarbons, heavy metals, and nutrients.
Vegetation (plants) that function in the removal of water through evapo-
transpiration and pollutant removal through nutrient cycling.
Laboratory and some limited eld tests have shown good removal capabilities of
some pollutants, such as 80%–90% for total suspended solids (TSS); 40%–50% for
total phosphorus (TP), and 50%–90% for heavy metals (Federal Highway Admin-
istration [FHWA] 2000, Yu and Wu 2001). One signicant advantage of bioreten-
tion cells as water management measures in urban areas is the fact that they can be
designed as part of the urban or highway landscape and are relatively low cost in
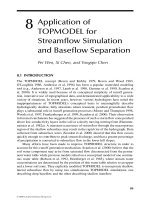
terms of construction and maintenance. Figure 21.5 shows the nitrogen cycle that
occurs in a typical bioretention cell.
21.3.3 GRASSED SWALES
Swales are grassy depressions in the ground designed to collect stormwater runoff
from streets, driveways, rooftops, and parking lots. Two general types of grassed
swales are generally designed: (1) a dry swale, which provides water quality benets
by facilitating stormwater inltration, and (2) a wet swale, which uses residence
•
•
•
•
•
•
FIGURE 21.4 Typical rain garden bioretention system.
© 2008 by Taylor & Francis Group, LLC
266 Wetland and Water Resource Modeling and Assessment
time and natural growth to treat stormwater prior to discharge to a downstream
surface water body. Both dry and wet swales demonstrate good pollutant removal,
with dry swales providing signicantly better performance for metals and nitrate
(FHWA 2000). The primary pollutant removal mechanism is through sedimentation
of suspended materials. Therefore, suspended solids and adsorbed metals are most
effectively removed through a grassed swale. Dry swales typically remove 65% of
total phosphorus (TP), 50% of total nitrogen (TN), and between 80% and 90% of
metals (Yu and Kaighn 1995). Wet swale removal rates are closer to 20% of TP,
40% of TN, and between 40% and 70% of metals. The total suspended solids (TSS)
removal for both swale types is typically between 80% and 90%. In addition, both
swale designs should effectively remove petroleum hydrocarbons based on the per-
formance reported for grass channels (FHWA 2000).
21.3.4 ECOLOGICAL DETENTION SYSTEMS
In general, LID technologies are applicable for small-scale contributing areas. For
example, once the drainage area to a bioretention cell exceeds about 0.3 hectares, it
may not be practical to use bioretention due to capacity limitations. In these cases,
larger systems such as ponds and wetlands are generally used to treat stormwater
(Center for Watershed Protection 1996). The larger stormwater management struc-
tures include retention basins, detention basins, extended-detention basins, and
enhanced extended-detention basins.
An extended-detention basin is usually dry during non-rainfall periods. An
enhanced or ecological extended-detention basin has a higher efciency than an
extended-detention basin because it incorporates a shallow marsh, or wetland system,
in its bottom. The wetland provides additional pollutant removal through wetland
NH
4
NH
1
RECHARGE
DRAIN
INFILTRATION
DENITRIFICATION
SANDY SOIL MEDIUM
NO
3
NO
2
VOLATILIZATION
AMMONIFICATION
MULCH
NITROGEN FIXATION
PLANT MATERIALS
BIOLOGICAL PITATION
PARTIC U L ATES
AIR
N
2
RUNOFF
DENITRIFICATION
RAINFALL
RAINFALL
RUNOFF
METALS
NUTRIENTS
FIGURE 21.5 Bioretention nitrogen cycle. (See color insert after p. 162.)
© 2008 by Taylor & Francis Group, LLC
Watershed Management Practices for Nonpoint Source Pollution Control 267
plant uptake, absorption, physical ltration, and decomposition. The wetland veg-
etation also helps to reduce the resuspension of settled pollutants by trapping them
(Virginia Department of Conservation and Recreation [VADCR] 1999). Figure 21.6
shows a typical stormwater treatment wetland system, with a forebay and a marsh
area. Wetland treatment systems differ from conventional detention and retention
treatment systems by being shallow (generally less than 30 cm deep), having a large
quantity of emergent and suspended aquatic vegetation, and emphasizing slow-mov-
ing, well-spread ow (Maestri et al. 1988).
Ecological processes inherent in such wetland stormwater treatment systems
include sedimentation, adsorption of pollutants by sediments vegetation and detritus,
physical ltration, microbial uptake of pollutants, uptake of pollutants by wetland
plants, uptake of pollutants by algae, and other physical-chemical processes. The
combination of ecological processes makes wetlands relatively effective in removing
pollutants normally found in stormwater.
21.4 THE BIG CHALLENGE AHEAD
It is clear that China is increasing its rate of urbanization. A December 2002 news
article (People’s Daily 2002) indicated that the urbanization level in China stands
at about 37%, roughly 10 percentage points lower than its industrialization level,
and that China is able to upscale its urbanization level one to two percentage points
every year, and nally reach a level of over 50 percent by the year of 2020. A later
new article (People’s Daily 2003) reported that China’s urbanization level had risen
from 10.6% in 1949 to 17.92% in 1978, and nally to 39.1% in 2002, and indicated
that China will strive to harmonize economic growth, environmental protection, and
urban development in the urbanization process, especially in the coming 20 years.
The Chinese Ministry of Water Resources (2003, p. 4) issued a report that stated,
in part:
FIGURE 21.6 Stormwater treatment wetland. (Virginia Department of Conservation and
Recreation (VADCR). 1999. Virginia Stormwater Management Handbook. .
state.va.us/sw/stormwat.htm.)
© 2008 by Taylor & Francis Group, LLC
268 Wetland and Water Resource Modeling and Assessment
In some regions, overdraft of groundwater has caused serious regional declines in the
groundwater table, creating a series of ecological problems such as large-scale land
subsidence, reduction of ecological oasis, environment deterioration. Also, the prob-
lems of water pollution and soil and water loss are very serious in China. Flood disas-
ters, water shortage, water pollution, and soil and water loss have seriously hampered
the harmonious development of population, resources, environment and the economic
society in China, and they have been the main constraints to the development of the
Chinese economic society. Therefore, China must implement the sustainable water
resources development strategy, strengthen the construction of water infrastructure,
consolidate the building up and protection of the ecological environment, conserve
and protect water resources, control water pollution, improve the ecological environ-
ment, promote the sustainable use of water resources, and safeguard the sustainable
development of the economic society.
With China’s rapid economic growth, the pressure for industrial and other urban
development is very intense. Consequently, this is a critical time for China to develop
a comprehensive plan for protecting its waters and ecosystems, while allowing care-
fully planned developments to move forward. The task is obviously very challeng-
ing, yet extremely important.
21.4.1 IMPLEMENTATION ISSUES IN CHINA
21.4.1.1 Regulatory Framework
In order to efciently reach set goals for watershed water quality protection, a regu-
latory framework is needed. Requiring eco-friendly engineering practices for gov-
ernment-sponsored engineering projects, such as highway construction, is a very
good strategy, but for privately sponsored construction projects, such as shopping
malls and residential sites, the developers might not feel “obliged” to build and
maintain BMPs. The regulatory framework could be established at either the cen-
tral or local government level or both. Tax benets could be used as a motivational
tool.
21.4.1.2 Cost and Maintenance
One of the key issues in BMP implementation is: Who should pay for the construc-
tion and maintenance costs associated with the BMPs? In the United States, for
public construction projects including road building, BMP cost is part of the overall
construction cost and the responsible agency (e.g., transportation departments in the
case of highway construction) would maintain the facilities. For private projects, the
developer would construct the BMPs and the users (e.g., homeowners’ associations
in the case of residential developments) would be responsible for the maintenance
costs.
BMP costs depend largely on the type of BMP and many other site-specic fac-
tors such as land value, labor and material costs, and so forth. The FHWA report in
2000 cited some preliminary costs for BMPs. For example, a bioretention cell sys-
tem could cost about $25,000 per impervious hectare area served. On the other hand,
swales and vegetative lter strips would cost much less, about $4,000 to $5,000 per
impervious hectare served.
© 2008 by Taylor & Francis Group, LLC
Watershed Management Practices for Nonpoint Source Pollution Control 269
21.4.1.3 Technical Issues
Because nonpoint pollution problems are very site specic, there is virtually no one-
size-ts-all type of approach in controlling NPS pollution. Rainfall, and therefore
runoff characteristics in China are quite different from those in the United States.
Factors such as topography, soil, agricultural practices (e.g., tea and fruit gardens
are prevalent in some parts of China), climate, and so forth, all impact the selection
and the design of BMPs that are appropriate for China. Some of the most important
design-related issues are:
What should be the design frequency for storms? (In the United States, a
10-year frequency is commonly used for runoff quantity control, whereas a
2-year or lesser storm frequency is used for quality control.)
Should the control of the “rst-ush” of the runoff (usually the rst 0.5 in
or 13 mm of runoff volume), which has been adopted in many states in the
United States, be considered in China?
Should the underground type of BMPs, such as bioretention cells, vault
structures, and sand lters, be considered as preferred BMPs in China?
These BMPs require little space and would be less vulnerable to vector
problems, which should be a concern in warm-weather regions in China.
How to deal with combined sewage and stormwater conveyance system regions.
Current BMP design guides target stormwater runoff for treatment. For a mix-
ture of stormwater and wastewater, the BMP must be designed accordingly.
One possible design may be the BMP treatment train, which can include pre-
treatment processes capable of treating high-concentration pollutants.
21.4.1.4 Other Issues
Other important issues relating to a full-scale BMP implementation include: special
provisions for certain sectors in the society (e.g., BMP implementation for the agri-
cultural sector, especially farmers), partnership with environmental groups, public
education strategies, and so forth.
21.5 CONCLUSIONS AND RECOMMENDATIONS
Urbanization, including highway construction, could cause signicant negative
impact on the aquatic ecosystem. There are a number of engineering practices,
called BMPs, which can be employed to mitigate these negative impacts. BMPs
such as bioretention cells, vegetative buffer strips and swales, and constructed wet-
lands can be integrated into the landscape and therefore provide both water quality
management and aesthetic benets. The full implementation of BMPs in watersheds
requires a well-planned strategy, which needs to address issues such as a regulatory
framework, cost and maintenance, and technical and other issues.
As China continues to urbanize, it is important to consider the environmen-
tal aspects, including the increased pollution and demands on natural resources.
However, in addition to controlling gross pollution, China needs to also ensure that
adverse effects on natural resources, especially water resources, are minimized.
•
•
•
•
© 2008 by Taylor & Francis Group, LLC
270 Wetland and Water Resource Modeling and Assessment
New developments, including highway construction, should attempt to maintain
the volume of runoff at predevelopment levels by using structural controls and pol-
lution prevention strategies. Plans for the management of runoff, sediment, toxins,
and nutrients can establish guidelines to help achieve both goals. Management plans
that include low-impact development measures protect sensitive ecological areas,
minimize land disturbances, and retain natural drainage and vegetation.
REFERENCES
Center for Watershed Protection. 1996. Dry weather ow in urban streams. Technical Note
No. 59. Watershed Protection Techniques 2(1):284–287.
Chinese Ministry of Water Resources. 2003. China Country Report on Sustainable Develop-
ment - Water Resources. February 24, 2003. />pdf/china2003.pdf (accessed August 24, 2007).
Coffman, L. 2001. Low-impact development—a decentralized stormwater management
approach to a functional ecosystem-based design. />ment/AgencyIndex/DER/PPD/LID/pdf/LID_Art2.pdf (accessed August 24, 2007).
Federal Highway Administration (FHWA). 2000. Stormwater best management practices in
an ultra-urban setting: Selection and monitoring. />ment/ultraurb/index.htm (accessed August 24, 2007).
Federal Interagency Stream Restoration Working Group (FISRWG). 1998. Stream corridor
restoration: Principles, processes, and practices. Federal Interagency Stream Resto-
ration Working Group (FISRWG), GPO Item No. 0120-A; SuDocs No. A 57.6/2:EN
3/PT.653. ISBN-0-934213-59-3. restoration/
(accessed August 24, 2007).
Maestri, B., M. E. Dorman, and J. Hartigan. 1988. Managing pollution from highway storm-
water runoff. Transportation Research Record 1166, Issues in Environmental Analysis.
Washington, DC: Transportation Research Board.
People’s Daily (English edition). 2002. China to accelerate its urbanization pace. Available
at: (accessed
August 24, 2007).
Prince George’s County. 2002. Bioretention manual. />AgencyIndex/DER/ESD/Bioretention/bioretention.asp (accessed August 24, 2007).
Schueler, T. 1994. The importance of imperviousness. Center for Watershed Protection,
Columbia, MD., Watershed Protection Techniques 1(3):100 –111.
U.S. Environmental Protection Agency (USEPA). 1983. Final report: Nationwide urban run-
off program. Washington, DC: U.S. Environmental Protection Agency.
U.S. Environmental Protection Agency (USEPA). 2000a. Low-impact development (LID)—a
literature review. EPA 841-B-00-005. Washington, DC: USEPA. im-
pactdevelopment.org/ftp/LID_litreview.pdf (accessed August 24, 2007).
U.S. Environmental Protection Agency (USEPA). 2000b. Principles for the ecological res-
toration of aquatic resources. Rep. No. EPA841-F-00-003. Washington, DC: USEPA
Ofce of Water. (accessed
August 24, 2007).
Virginia Department of Conservation and Recreation (VADCR). 1999. Virginia stormwa-
ter management handbook.
(accessed August 24, 2007).
Yu, S. L., and R. J. Kaighn. 1995. Testing of roadside vegetation. Vol. 2 of The control of pol-
lution in highway runoff through bioltration. Virginia Department of Transportation,
Report No. FHWA/VA-95-R29. Richmond: Virginia Department of Transportation.
© 2008 by Taylor & Francis Group, LLC
Watershed Management Practices for Nonpoint Source Pollution Control 271
Yu, S. L., and J. Wu. 2001. Laboratory testing of a mixed-media bioretention cell. Report
to Americast, Inc. Department of Civil Engineering, University of Virginia, Charlot-
tesville, VA.
Yu, S. L., and X. Zhang. 2001. The critical storm approach for TMDL development. Paper
presented at the Annual Meeting of the Water Environment Federation, Chicago, IL.
© 2008 by Taylor & Francis Group, LLC