báo cáo sinh học:" Measuring inequalities in the distribution of health workers: the case of Tanzania" doc
Bạn đang xem bản rút gọn của tài liệu. Xem và tải ngay bản đầy đủ của tài liệu tại đây (313.83 KB, 12 trang )
Human Resources for Health
BioMed Central
Open Access
Research
Measuring inequalities in the distribution of health workers: the
case of Tanzania
Michael A Munga*1,2 and Ottar Mæstad3
Address: 1National Institute for Medical Research, Dar es Salaam, Tanzania, 2Centre for International Health, University of Bergen, Bergen, Norway
and 3Chr Michelsen Institute, Bergen, Norway
Email: Michael A Munga* - ; Ottar Mæstad -
* Corresponding author
Published: 21 January 2009
Human Resources for Health 2009, 7:4
doi:10.1186/1478-4491-7-4
Received: 9 February 2008
Accepted: 21 January 2009
This article is available from: />© 2009 Munga and Mỉstad; licensee BioMed Central Ltd.
This is an Open Access article distributed under the terms of the Creative Commons Attribution License ( />which permits unrestricted use, distribution, and reproduction in any medium, provided the original work is properly cited.
Abstract
Background: The overall human resource shortages and the distributional inequalities in the
health workforce in many developing countries are well acknowledged. However, little has been
done to measure the degree of inequality systematically. Moreover, few attempts have been made
to analyse the implications of using alternative measures of health care needs in the measurement
of health workforce distributional inequalities. Most studies have implicitly relied on population
levels as the only criterion for measuring health care needs. This paper attempts to achieve two
objectives. First, it describes and measures health worker distributional inequalities in Tanzania on
a per capita basis; second, it suggests and applies additional health care needs indicators in the
measurement of distributional inequalities.
Methods: We plotted Lorenz and concentration curves to illustrate graphically the distribution of
the total health workforce and the cadre-specific (skill mix) distributions. Alternative indicators of
health care needs were illustrated by concentration curves. Inequalities were measured by
calculating Gini and concentration indices.
Results: There are significant inequalities in the distribution of health workers per capita. Overall,
the population quintile with the fewest health workers per capita accounts for only 8% of all health
workers, while the quintile with the most health workers accounts for 46%. Inequality is
perceptible across both urban and rural districts. Skill mix inequalities are also large. Districts with
a small share of the health workforce (relative to their population levels have an even smaller share
of highly trained medical personnel. A small share of highly trained personnel is compensated by a
larger share of clinical officers (a middle-level cadre) but not by a larger share of untrained health
workers. Clinical officers are relatively equally distributed. Distributional inequalities tend to be
more pronounced when under-five deaths are used as an indicator of health care needs.
Conversely, if health care needs are measured by HIV prevalence, the distributional inequalities
appear to decline.
Conclusion: The measure of inequality in the distribution of the health workforce may depend
strongly on the underlying measure of health care needs. In cases of a non-uniform distribution of
health care needs across geographical areas, other measures of health care needs than population
levels may have to be developed in order to ensure a more meaningful measurement of
distributional inequalities of the health workforce.
Page 1 of 12
(page number not for citation purposes)
Human Resources for Health 2009, 7:4
Background
During the last few years, much attention has been paid to
the general shortage of health workers in low-income
countries, [1,2] and to the crucial importance of reducing
it to attain the Millennium Development Goals [3-5]. In
addition to the general shortage of health workers in these
countries, there is a common understanding that large incountry inequalities exist in the distribution of health
workers. So far, the evidence to support this proposition
has been limited, owing to a lack of reliable disaggregated
data at the country level. In this paper, we use the last census of human resources for health in Tanzania in order to
describe the distributional patterns of the health workforce in the country.
Inequalities in the distribution of health workers are often
described by comparing the number of health workers per
capita across districts or other local administrative units
[6-8]. Following this approach, the first aim of this paper
will be to provide a quantitative description of inequality
in the allocation of health workers per capita at the district
level in Tanzania. We will show that considerable inequalities prevail across districts. While several existing studies
confine themselves to the distribution of a single cadre,
such as general practitioners or nurses [5,7,9], we describe
the distribution both at the aggregate level and at the
cadre level. In this way, we are able to study, for instance,
whether districts that have relatively few physicians are
"compensated" by having relatively more lower-cadre
workers.
It is not obvious, though, that an equitable distribution of
health workers would entail an equal number of health
workers per capita across regions or districts. The need for
health services per capita – and therefore the human
resource requirements per capita – may vary across geographical entities due to differences in morbidity and
mortality patterns. Furthermore, the composition of
aggregate morbidity and mortality may differ according to
area. This may have implications for health workforce
planning if governments do not give equal priority to preventing and treating all conditions (e.g. by according
higher priority to the health care needs of children compared to the elderly). Also, a higher number of staff per
capita might be needed in areas with a lower population
density.
In the literature on inequalities in the distribution of
health workers in high-income countries, crude death rate
has been proposed as an alternative to population as a
measure of health care needs [10-12], the argument being
that a high death rate is a signal of an ageing population
with high health care needs.
/>
In a low-income setting, crude death rates are probably
less suitable as a measure of health care needs in the context of health workforce planning. First, due to resource
constraints, governments in these countries have generally chosen to put less emphasis on the health care needs
of the elderly, compared to high-income countries. Second, the elderly constitute a smaller proportion of the
total population in high-fertility settings.
We therefore propose two alternative indicators of health
care needs for a low-income setting: the under-five mortality rate and the HIV prevalence ratio. While both indicators clearly provide incomplete descriptions of the need
for health services, they serve the purpose of drawing
attention to the possibility of in-country variations in
health care needs per capita that need to be taken into
account when assessing the distribution of the health
workforce. In the case of Tanzania, such in-country differences appear to be of sufficient significance to warrant a
deviation from the principle of an equal number of health
workers per capita in all districts. In practice, however, it
will be necessary to come up with more comprehensive
measures of need than the two partial indicators applied
in this paper.
Following the economics literature on the measurement
of inequality in the distribution of income, we use the
Lorenz curve and the Gini index in order to characterize
inequality in the distribution of health workers per capita.
In addition, we present a novel way to illustrate the difference between the per capita approach (i.e. the allocation
of health workers according to population) and alternative indicators of health care needs. By using concentration curves – extensively used to depict socioeconomic
inequalities in health [13] – to describe alternative ways of
measuring health care needs, and by drawing concentration curves in the same diagram as the Lorenz curve, we
are able to illustrate graphically the significance of alternative indicators of health care needs, as well as to compare
the actual distribution of health workers with the equitable distribution according to alternative measures of need.
Moreover, we show how concentration curves may be usefully applied to analyse skill-mix inequalities.
The paper is organised as follows. In the following section, we present a brief introduction to the Tanzanian
health system, key health indicators and the human
resource situation in the health sector. This is followed by
a presentation and discussion of the methods for analysing inequalities in the distribution of health workers. Data
sources are presented in the subsequent section before
presenting important findings. We then highlight and discuss the major issues raised in the analysis. Finally, conclusions and policy recommendations are presented at the
end of the paper.
Page 2 of 12
(page number not for citation purposes)
Human Resources for Health 2009, 7:4
The context
Tanzania, with 37.6 million inhabitants [14], is one of the
world's poorest countries. About 36% of all Tanzanians
live below the poverty line of one US dollar a day [15].
Administratively, mainland Tanzania is divided into 21
regions with 125 districts. At the district level, health services are provided through the district hospitals and the
associated health centres, dispensaries and health posts.
There are referral hospitals in each region. Four of these
hospitals serve as tertiary hospitals for larger geographical
areas.
According to the 2006 World health report, mainland Tanzania has a total of 48508 health workers, of whom 822
are physicians and 13292 are nurses [1]. Tanzania has the
lowest physician/population ratio in the world. However,
the underlying HRH data source shows that the country
also has 717 Assistant Medical Officers with practical clinical skills comparable to those of physicians. In addition,
there are 5642 clinical officers, who undertake a substantial share of the clinical practice [16]. Medical assistants,
with little or no formal training, constitute a large share
(40%) of the health workforce.
The under-five mortality rate has declined over the last
decade from 147 per thousand live births in 1995–1999
to 112 in the period 2000–2005 [17]. The HIV prevalence
rate is 7% [18].
Methods
Inequality of what?
The underlying normative idea when characterizing inequalities in the distribution of health workers is that an
equitable distribution can be realized by allocating health
workers according to the need for health care. To measure
health care needs is not a trivial task, however. For reasons
of simplicity, population levels have come to be a popular
indicator of need in many practical applications, implying
that inequalities in the distribution of health workers have
been characterized by inequalities in the number of
health workers per capita [19,20].
Population levels may not be a good measure of health
care needs if disease patterns vary between locations.
Some studies in developed countries have therefore proposed to replace population levels with crude death rates.
For example, Gravelle & Sutton and Johnson & Wilkinson
[12,21] have argued that crude deaths is a good proxy of
the health care needs of a population because areas with
high death rates are typically areas with an ageing population, which requires many labour-intensive health services.
/>
As argued above, "crude deaths" may be a less suitable
proxy for health care needs in low-income country settings in the context of health workforce planning. Due to
the lack of alternative, comprehensive measures of health
care needs, we confine our analysis to two partial measures: (1) the under-five mortality rate, and (2) the HIV/
AIDS prevalence rate.
Although these measures serve mainly as illustrations
here, they also capture important aspects of health care
needs in a low-income setting. As many as 30% of annual
deaths in low-income countries are children under the age
of five, compared to less than 1% in high-income countries [22]. A large share of under-five deaths can be prevented by interventions delivered through the health
system [23,24].
Moreover, in Tanzania the under-five mortality ratio varies by a factor of more than 6 between districts – from 40
deaths in Ngorongoro district to 250 deaths per 1000 live
births in Ruangwa district [15]. Under-five mortality is
also acknowledged by the government as one of four factors that determine the allocation of financial resources in
the health sector, together with population, poverty levels
and remoteness. It is therefore reasonable to use the
number of under-five deaths as an indicator of health care
needs, albeit a partial one.
The HIV/AIDS prevalence rate is a second possible indicator of health care needs. HIV/AIDS is imposing huge burdens on the health workforce in many low-income
countries [25]. A study from Tanzania showed that the
duration and frequency of hospital admission was two
times higher for HIV/AIDS patients than for those with
other diseases [26]. Moreover, the rapid roll-out of ART
treatment is placing great demands on the health workforce [27]. HIV/AIDS is also a major cause of health
worker absenteeism and attrition [28,29]. One study conducted in Tanzania [30] showed that about 26% of health
workers were granted paid sick leave due to HIV/AIDSrelated illnesses. Hence, a high burden of HIV/AIDS is
likely to increase the need for health workers significantly.
At the same time, large variations in HIV/AIDS prevalence
rates have been documented in Tanzania, from 2% in Kigoma and Manyara regions to 13.5% in Mbeya region [18].
The variation in HIV/AIDS prevalence may therefore serve
as one possible indicator of the variation in the need for
health workers.
A natural objection to using under-five deaths, as well as
other measures of the burden of disease, as a proxy for the
need for health workers is that a high burden of disease
may be caused by a low number of health workers [3]. If
all variation in, for instance, the under-five mortality were
due to unequal distribution of health workers, differences
Page 3 of 12
(page number not for citation purposes)
Human Resources for Health 2009, 7:4
/>
in the number of under-five deaths would not provide any
reason to allocate health workers otherwise than in proportion to population. We justify our approach by showing that the number of health workers per capita can
potentially explain only a small share of the variation in
under-five mortality rates in Tanzania. We are not aware
of any study that has argued convincingly that the number
of health workers per capita is a strong predictor of HIV
prevalence. (Note: Madigan et al. [31] argue that health
worker density has an impact on HIV/AIDS prevalence.
However, their regression analysis fails to control for variables that one would expect are important predictors of
HIV/AIDS prevalence, such as sexual behaviour and attitudes, and knowledge about the transmission of the disease. Moreover, female literacy, a variable that the authors
claim to be closely related to HIV/AIDS prevalence, is not
included in their regression model.)
Measuring inequality
Lorenz curves and the Gini index
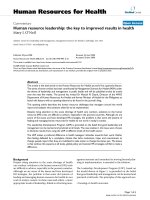
We use Lorenz curves in order to characterize the distribution of health workers per capita. The Lorenz curve shows
the cumulative share of health workers against the cumulative share of the population when the different locations
are ranked from the lowest to the highest number of
health workers per capita (see Figure 1).
We use the Gini index as a measure of the aggregate level
of inequality. The Gini index takes the values between 0
and 1, with higher values indicating higher levels of inequality. Graphically, the Gini index is the area A/(A+B) in
Figure 1. For discrete distributions where the observations
have been ranked from below, the Gini index can be calculated as
G=
n
∑i =1 ( 2i − n −1 ) X i
,
n 2μ
1
Alternative measure of
cumulative need
(Concentration curve)
Population-based measure
of cumulative need
C
A
Cumulative share of
health workers
(Lorenz curve)
B
0
1
Cumulative share of population
Figure 1
The Lorenz curve and the concentration curves
The Lorenz curve and the concentration curves.
where G is the Gini index, n is the number of observations, Xi is the number of health workers in the ith location and μ is the mean number of health workers.
Concentration curves and the concentration index
Concentration curves, which have been extensively used
to characterize socioeconomic inequalities in health [13],
are here used to characterize the need for health workers.
Thus, our concentration curves plot cumulative expressions of need (i.e. the cumulative number of inhabitants,
under-five deaths, and HIV+ cases) against cumulative
population. In contrast to the Lorenz curve, concentration
curves are constructed by ranking observations by some
external variable. By using the number of health workers
per capita as the external variable, we are able to superimpose the concentration curves in the same diagram as the
Lorenz curve (see Figure 1). Thus, it becomes possible to
make statements such as "50% of the population have
access to x% of the health workers, while their need would
represent y% of the aggregate need".
Obviously, if need is expressed by the number of inhabitants, the concentration curve is simply the diagonal in Figure 1. When need is expressed through other variables, the
concentration curve may run both below and above the
diagonal.
Concentration curves are also used in order to compare
inequality in the distribution of specific cadres with inequalities in the overall distribution of health workers. We
are not aware of any previous attempts to use concentration curves to characterize skill mix inequalities.
Concentration indices are calculated in order to measure
whether inequalities on average are increased or reduced
by replacing the number of inhabitants with alternative
measures of need. Technically, the concentration index is
computed in the same way as the Gini index, and graphically, the concentration index is the area C/(A+B). When
the concentration curve lies above (below) the diagonal,
the area 'C' is assigned a negative (positive) value.
The concentration index takes values between -1 and +1.
When the index is 0, it means that the alternative measure
of need does not affect the aggregate level of inequality,
compared to the case when need is measured by the
number of inhabitants. When the index is negative, which
would be the case if the concentration curve lies everywhere above the diagonal, health care needs per capita are
on average larger in the districts with the fewest health
workers per capita. Hence, the inequalities are larger when
we use the alternative measure of need. The opposite is
true when the concentration curve lies everywhere below
the diagonal, which would imply a positive concentration
index.
Page 4 of 12
(page number not for citation purposes)
Human Resources for Health 2009, 7:4
/>
Data sources
Data on the number of health workers were retrieved from
the Ministry of Health's Human Resources for Health census [16], the same source as was used to extract figures for
the World Health Organization's Global Atlas of the
Health Workforce. The HRH census encompasses all
health workers in the public, private-for-profit and private
not-for-profit sectors in mainland Tanzania. The data
were collected at the health facility level by asking the person in charge to provide a complete list of the employees.
The census is the most comprehensive and reliable source
of HRH data in Tanzania at present. The HRH data may be
biased due to incompleteness of the data collection process. Since we do not have any reason to believe that the
degree of completeness varies systematically between districts, it is unclear how such bias might affect our results.
At the time of the census, the total number of districts was
113 (as a result of government reorganization, some districts have since been split). Following the country's official classification of districts, 22 districts are classified as
urban. These consist of the regional capitals in 19 regions
in addition to the three districts of Dar es Salaam region.
The remaining 91 districts are classified as rural. (Note:
One of the regional capitals (Babati district in Manyara
region), is classified as a rural district in the Tanzanian
official statistics.)
Mortality data were obtained from the National Bureau of
Statistics (NBS). The data were based on the 2002 population and housing census [32] and were collected by
putting questions about birth history to women of reproductive age (15–49 years). Recall bias is likely to weaken
the reliability of this data source. However, more reliable
reports of vital statistics are not available. Note that recall
bias is not likely to affect our results insofar as there are no
systematic differences in the bias across districts.
Data on HIV prevalence were based on the HIV/AIDS
indicator survey of 2003–2004 [18]. These data have been
estimated only at a regional level. The analysis that uses
HIV prevalence data was therefore conducted at the
regional level only.
Results
Distribution of health workers
Some health workers are employed in administrative
positions in the central government. We excluded these
workers from the data and remained with a total of 46 896
health workers. Their distribution across cadres and sectors is shown in Table 1.
On average, there are 1.4 health workers per 1000 people
in Tanzania. The number of health workers per capita varies greatly between districts, from 0.3 per 1000 in
Bukombe district to 12.3 per 1000 in Moshi district.
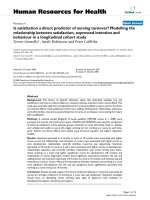
Figure 2 shows the Lorenz curve for the distribution of
health workers across districts. There is significant inequality in the distribution of health workers per capita.
The population quintile with the fewest health workers
per capita has only 8% of the health workers, while the
quintile with the most health workers has 46% of the
workers. The value of the Gini index is 0.229.
Part of the inequality in the distribution of health workers
is driven by an urban/rural divide. Urban districts have on
average more than twice as many health workers per capita as rural districts (see Table 2). Seventeen of the 22
urban districts are among the top 20 districts, ranked by
the number of health workers per capita. It is true that
there are some urban districts with very few health workers per capita, but these districts are located in Dar es
Salaam not far from the national hospital, which happens
to be located in a different district.
Table 1: Distribution of health workers across cadres and sectors (%) (n = 46 896)
Government
Private
Voluntary agencies
Total
Medical officer
0.8
0.3
0.2
1.3
Assistant medical officer
1.0
0.2
0.3
1.5
Clinical officer
9.0
1.1
1.7
11.7
Nurse/Nurse-Midwife
18.3
2.1
7.4
27.8
Medical attendant
30.7
1.6
7.9
40.2
Other
10.6
1.5
5.3
17.5
Total
70.3
6.7
22.9
100.0
Page 5 of 12
(page number not for citation purposes)
Human Resources for Health 2009, 7:4
/>
Those districts that have a small share of the health workforce (relative to their population level) have an even
smaller share of the highly trained medical personnel
(medical officers and specialists). The concentration curve
for this group lies everywhere below the Lorenz curve and
the concentration index is as high as 0.595.
1
0.9
0.8
0.7
0.6
0.5
0.4
0.3
Cum share health workers (Lorenz)
0.2
Cum population
0.1
0
0
0.2
0.4
0.6
0.8
1
Cum s har e population
Figure
districts 2
Lorenz curve for the distribution of all health workers across
Lorenz curve for the distribution of all health workers across districts.
We calculated the Gini index for urban and rural districts
separately and found that the Gini index for the urban
subsample was almost as high as for the country as a
whole (0.225). Hence, significant inequalities exist across
urban districts, even though their average number of
health workers is much higher than in rural districts. In
the rural subsample, on the other hand, the inequalities
between districts are much smaller. The Gini index is only
0.11. The most significant inequalities are thus the inequalities between rural and urban districts and among
urban districts.
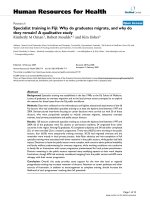
Skill mix
Some cadres are more unequally distributed than others
across districts. Figure 2 shows the Lorenz curve for the
cumulative share of all health workers, together with the
concentration curves for selected cadres. Cadres not displayed in Fig. 3, such as assistant medical officers and
nurses, were distributed quite similarly to the aggregate
health workforce.
Table 2: Urban/rural distribution of health workers
Health workers per 1000
Gini index
Average
Minimum
Maximum
Urban districts
3.0
0.6
12.3
0.225
Rural districts
1.1
0.3
3.0
0.110
All districts
1.4
0.3
12.3
0.229
How do the disadvantaged districts compensate for their
small share of highly skilled health workers? Interestingly,
medical attendants, who have little or no training, do not
constitute a larger share of the workforce in these districts
compared to the more advantaged ones. Indeed, the concentration index for the medical attendants is 0.195,
which is very close to the Gini coefficient. Indeed, the concentration curve shows that medical attendants are distributed quite similarly to the distribution of the total
health workforce.
The skill mix in the disadvantaged districts is characterized, however, by a relatively large share of clinical officers. The concentration index for clinical officers is only
0.006, suggesting that clinical officers are distributed quite
equally according to population levels.
Hence, the skill mix in the disadvantaged districts is
marked by few highly trained people but relatively more
health workers with medium-level skills. But there is no
cadre of which the disadvantaged districts have a larger
share of the health workers than is suggested by their relative population levels (i.e. all concentration curves in Fig.
3 fall below the diagonal).
Alternative measures of need
One alternative to population levels as a measure of need
is the number of under-five deaths. In Fig. 4, the concentration curve for the cumulative share of under-five deaths
is shown together with the Lorenz curve for the cumulative share of all health workers. The concentration curve
for under-five deaths lies everywhere above the diagonal,
showing that those districts that have few health workers
per capita at the same time have a large share of under-five
deaths per capita (the concentration index is -0.26 for all
districts, -0.29 for urban districts and -0.22 for rural districts, respectively). In other words, the need for health
services – measured as the number of under-five deaths –
in districts with few health workers is larger than suggested by their respective population levels.
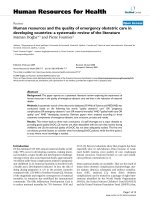
A second alternative measure of need is the HIV prevalence rate. Unfortunately, these data are available only at
the regional level. Figure 5 shows the regional-level
Lorenz curve for the cumulative share of health workers,
together with the concentration curve for the cumulative
share of HIV-positive persons.
Page 6 of 12
(page number not for citation purposes)
Human Resources for Health 2009, 7:4
Cum
Cum
Cum
Cum
Cum
1
0.9
/>
share Medical Officers
share Clinical Officers
share Attendants
share total health workers
share population
1
0.9
0.8
0.7
0.8
0.6
0.5
0.7
Cum share total
Health w orkers
0.4
0.6
|
Cum share HIV+
people
0.3
0.2
0.5
|
0.4
Cum share of
population
0.1
0
0
0.2
0.4
0.6
0.8
1
0.3
cum s har e of population
0.2
Figure 5
21 regions
Distribution of total health workers and HIV prevalence in
Distribution of total health workers and HIV prevalence in 21 regions.
0.1
0
0
0.2
0.4
0.6
0.8
1
Cum s har e of population
Figure
tricts 3
Distribution of health workers per capita by cadre in all disDistribution of health workers per capita by cadre in
all districts.
Interestingly, this measure of need shows a remarkably
different pattern than that for under-five deaths. The concentration index is 0.077, which is not very different from
the regional level Gini index of 0.117. This implies that at
the regional level, health workers are on average distributed fairly well according to need as measured by the HIV
prevalence rate. However, the concentration curve also
shows that there are individual regions where the number
of health workers does not correspond at all to the
number of HIV-infected persons.
1
Table 3 reports part of the data material behind Figs. 2, 3,
4, 5, comparing the actual distribution of health workers
with alternative measures of need for each population
quintile.
0.9
0.8
0.7
0.6
Discussion
0.5
0.4
0.3
0.2
Cum share health workers
(Lorenz)
Cum U5deaths
0.1
Cum population
0
0
0.2
0.4
0.6
0.8
1
This study is a first attempt to describe and measure systematically the level of inequality in the distribution of
the health workforce in Tanzania, using the Lorenz curve
and the Gini index as well as concentration curves and
indices. It is also a first attempt to use alternatives to population levels as proxy indicators of health care needs
when measuring distributional inequalities of the health
workforce in a low-income setting.
Cum s har e of population
Figure 4
across districts
Cumulative share of total health workers and U5 deaths
Cumulative share of total health workers and U5
deaths across districts.
Our findings indicate that there are large inequalities in
the number of health workers per capita across districts,
with a 40-fold difference between districts at the high end
of the distribution compared to the district at the lower
end. Of course, some of these differences are planned for.
The referral system implies that some districts are sup-
Page 7 of 12
(page number not for citation purposes)
Human Resources for Health 2009, 7:4
/>
Table 3: Distribution of health workers relative to population and alternative indicators of health care needs
District level data (113 districts)
Measures of need
Share of population
Share of U5 deaths
Share of health workers
20%
28%
8%
40%
50%
19%
60%
70%
33%
80%
87%
54%
Concentration index = -0.266
Gini index = 0.229
Regional level data (21 regions)
Measures of need
Share of health workers
Share of population
Share of HIV+ people
20%
20%
16%
40%
37%
30%
60%
53%
50%
80%
65%
70%
Concentration index = 0.077
Gini index = 0.118
posed to serve populations from other districts through
the regional and tertiary hospitals. As a consequence, we
would expect a higher concentration of health workers relative to the population in districts hosting a referral hospital. One way of addressing this problem would be to
exclude regional and tertiary referral hospitals from the
analysis. Doing so, the results reported in Table 2 would
change and appear as in Table 4.
Table 4: Urban/rural distribution of health workers (excluding
regional and tertiary hospitals)
Health workers per 1,000
Gini index
Average
Minimum
Maximum
Urban districts
1.4
0.6
3.2
-
Rural districts
1.1
0.3
3.0
-
All districts
1.1
0.3
3.2
0.070
As expected, the number of health workers per capita in
the urban districts drops dramatically. Still, however,
urban districts have almost 30% more health workers per
capita compared to the rural districts. However, this estimate of the inequality is likely to be biased strongly downward, because regional hospitals also serve as district
hospitals in their respective locations. An unbiased analysis would therefore exclude only those workers at these
hospitals who are needed for their regional referral services, and not all workers, as we have done above.
More importantly, Table 4 shows that even after excluding
the regional and tertiary hospitals, there is a tenfold difference in the number of health workers per capita between
districts at the high end of the distribution compared to
the district at the lower end.
Our results also point to huge differences between urban
districts in their availability of health personnel (0.6–12.3
health workers per 1000 people). However, part of this
difference could be attributed to the fact that only a few
urban districts host tertiary hospitals. We therefore recal-
Page 8 of 12
(page number not for citation purposes)
Human Resources for Health 2009, 7:4
culated our results excluding the tertiary referral hospitals.
The inequalities are then reduced, but there is still more
than a fivefold difference (0.6–3.2) between the urban
districts with the lowest and highest number of health
workers per capita. The Gini index is reduced from 0.225
to 0.081.
As previously noted, part of the inequalities between
urban districts can be explained by the fact that two of the
three districts in Dar es Salaam have few health workers,
while their populations are partly served by the national
hospital located in the third district. This observation
points at a more fundamental problem in the way inequalities are measured both in this and in other studies:
service provision does not always follow district boundaries. One author [33] has succinctly argued that "the geographical areas that are implicit in any population to
physician ratio present two major problems. First, the geographical areas tend to be artificial and do not necessarily
reflect the natural geographical pattern of health care
delivery and consumption...Secondly, and somewhat
related to the first point, is the assumption that all health
care consumption and delivery activities take place within
the defined geographic area. Such an assumption is often
untenable". It is not unreasonable to assume that those
places that have more health workers per capita will to
some extent attract patients from neighbouring districts,
due to a perceived higher quality of service. With such
crossovers, it may be argued that the standard way of estimating health worker inequalities will bias the estimates
upwards.
Unfortunately, our data set does not allow us to study indistrict differences in the distribution of the health workforce. Many Tanzanian districts are relatively large (the
mean size of a rural district is around 9000 km2), and differences within districts may be larger than differences
between districts. There is reason to believe there may be
large differences in the number of health workers per capita between the remote and the more central parts of each
district. Hence, this study may underestimate the true differences in the distribution of the health workforce.
Skill mix and quality of services
By disaggregating the health worker distribution by cadre,
we were able to study the skill-mix distribution between
districts. The use of concentration curves for the distribution of each cadre in combination with the Lorenz curve
for the distribution of the total health workforce illustrates a new way of analysing the relationship between
inequalities in the total health workforce and the skill
mix.
Differences in the skill mix may cause differences in the
quality of the health workforce, which in turn may affect
/>
the quality of health services. There is a concern that the
most disadvantaged districts not only have the lowest
number of health workers per capita but also a disproportionately large share of the less-well-trained workers and
therefore an even poorer access to quality health services
than suggested by the aggregate number of health workers.
Our results confirm that districts with few health workers
per capita also have a disproportionately small share of
highly trained health workers. Hence, the inequality in
access to health services of good quality is likely to be even
larger than suggested by the inequality in the distribution
of the total health workforce.
Alternative measures of need
Due to the variation across districts in the disease patterns,
we suggested reanalysing the distribution of the health
workforce by using alternatives to the standard measure of
health care needs (i.e. the level of population). By combining the use of concentration curves for these alternative measures of need with the Lorenz curve of the actual
distribution of health workers, this paper suggests a novel
and illuminating way to compare the implications of
alternative measures of need.
The two alternatives considered – the share of under-five
deaths and the share of HIV-infected persons – both
clearly deviate from the standard measure of need. The
implications for the degree of inequality differ, however,
depending on which alternative measure is used. Underfive deaths are more highly concentrated in areas with a
relatively small share of the health workforce, and inequality in the distribution of the health workforce will
therefore become more pronounced by using this measure of need, compared with the standard measure. HIV,
on the other hand, is more concentrated in urban areas
where the supply of health workers is more abundant,
suggesting that this measure of need will cause a reduction
in the implied inequalities in the distribution of health
workers. Our results suggest that much relevant information may be left out when population is used as the only
measure of need, i.e. when distributional inequalities are
described solely by differences in the number of health
workers per capita. One way to capture this information
would be to build more comprehensive measures of
health care needs than we have been able to do in this
paper, by measuring differences in the disease burden
across different parts of the country and how these differences translate into health care needs.
Policy implications
The major criterion for allocating health workers across
districts in Tanzania is relative population levels. The
observation that health care needs may differ substantially
Page 9 of 12
(page number not for citation purposes)
Human Resources for Health 2009, 7:4
/>
between districts in Tanzania might suggest that other factors should be considered as well. Like the financial allocation formula used by the Ministry of Health [34], which
combines the levels of population with other indicators of
need, additional factors might be built into the allocation
formula for a more sensible and fairer distribution of the
health workforce.
One possible argument against the appropriateness of
using alternative needs-based allocation formulas is that
there may be a causal relationship between the number of
health workers and the observed need for health care. In
the extreme, if all variation in disease burden were caused
by differences in the number of health workers, there
would be no reason to deviate from the standard allocation rule (i.e. population levels). In reality, however, there
are many other factors that might explain the differences
in disease burden. With regard to the alternative measures
of need used in this paper, there is no indication that differences in the number of health workers per capita can
explain the observed differences in the HIV prevalence
rates, because there are more HIV cases in those places
where there are many health workers.
When it comes to under-five deaths, on the other hand,
Anand and Bärnighausen [3] have argued that a low
number of health workers per capita causes increased
under-five mortality (in a cross-country data set). Multivariate regression analysis on the Tanzanian data set
shows, however, that health worker density can potentially explain only a small share of the variation in underfive deaths across districts in Tanzania. We regressed the
number of under-five deaths per capita against the
number of health workers per capita, using four different
groups of health workers. The linear model was able to
explain only 12.5% of the total variation in the dependent
variable, while a non-linear model including also the
squared variables explained 19.9% of the variation (see
Table 5). This suggests that factors other than health
worker density explain the major share of the variation in
under-five deaths in Tanzania. Hence, we conclude that
there is a case for using under-five mortality, along with
other indicators of need, in the allocation of the health
workforce.
Of course, if health care needs are systematically higher in
areas with low health worker densities, it will make sense
to use a population-based allocation of health workers as
Table 5: Relationship between health worker density and under-five mortality
Dependent variable
R2
Independent variables
Coefficient
Standard error
P-value
Medical officers/capita (MO)
4.56
4.57
0.321
Clinical officers/capita (CO)
-3.28
2.17
0.134
AMOs and others/capita (AMO+)
-0.47
0.46
0.301
Attendants/capita (ATT)
0.04
0.61
0.942
MO
20.38
13.59
0.137
CO
-9.43
5.87
0.111
AMO+
-2.04
0.82
0.015
ATT
1.08
1.24
0.383
MO2
-32658.62
28416.52
0.253
CO2
17247.5
11915.73
0.151
AMO+2
226.57
146.67
0.125
ATT2
-372.43
458.08
0.418
Under-five deaths and health worker density. Linear model
Under-five deaths per capita
0.125
Under-five deaths and health worker density. Non-linear model
Under-five deaths per capita
0.199
Page 10 of 12
(page number not for citation purposes)
Human Resources for Health 2009, 7:4
a first step, before further refining the allocation formula.
However, as shown in our analysis of the distribution of
HIV prevalence, it is possible that health care needs are
higher in areas where health worker densities are also
high. Therefore, a comprehensive analysis of health care
needs seems appropriate in designing well-targeted policies to reduce distributional inequalities.
One weakness of the analysis is our inability to conduct
district-level analysis using HIV prevalence as an indicator
of health care needs, which is because the data are disaggregated only down to the regional level. Our results
therefore do not produce strong policy implications for
how HIV prevalence can be taken into account in the
actual allocation of health workers to districts in Tanzania. (The high p-values should not be taken to imply that
there is no relationship between the number of health
workers per capita and the number of under-five deaths
per capita. Large confidence intervals may be due to high
correlation between the independent variables.)
Conclusion
Superimposing concentration curves for health care needs
in the same diagram as the Lorenz curves for the distribution of the health workforce provides a simple and clear
graphical illustration of the importance of alternative
indicators of health care needs for the measurement of
health worker distributional inequalities. Moreover,
superimposing concentration curves for the cadre-specific
distribution provides an illuminating way to analyse the
relationships between distributional inequalities in the
total health workforce and skill mix inequalities. A proper
understanding of the skill mix inequalities is, in turn, fundamental for understanding differences in access to goodquality health services between populations in worse-off
and better-off districts.
The study acknowledges the usefulness of population levels as an indicator of health care needs and thus as a basis
for measuring distributional inequalities in the health
workforce. But in settings where the disease burden is not
uniformly distributed, relying solely on population as a
measure of health care needs may lead to the omission of
much relevant information necessary for the accurate
measurement of need, and consequently for a more sensitive distribution of health personnel relative to need. One
way of capturing this information would be to identify
and apply more comprehensive measures of health care
needs than we have been able to do in this paper. To do
this, more research is needed to identify more sensible
indicators for the measurement of health care needs and
on how to "weigh" the identified indicators together into
one composite measure. This requires multidisciplinary
teamwork involving economists, epidemiologists and
human resource planning specialists.
/>
Competing interests
The authors declare that they have no competing interests.
Authors' contributions
MAM and OM equally participated in designing the study,
analysing the data and drafting all sections of the manuscript. Both authors have read and agreed to the paper
being submitted as it is.
Acknowledgements
We are grateful to the Ministry of Health and Social Welfare, Tanzania, for
allowing us to use the Human Resources for Health 2001/2002 census data.
Thanks to coordinator Aziza Mwisongo and other members of the NIMRHRH project for their support in the acquisition of data used for this analysis. We also thank the National Bureau of Statistics for providing us with
data on under-five deaths and population levels. Special thanks to Gaute
Torsvik and the rest of health worker Motivation, Availability and Performance (MAP) project team for their useful comments. We also thank the
Norwegian Government and the Research Council of Norway for their
financial support. Last but not least, we wish to thank the management of
the National Institute for Medical Research (NIMR) for all the support
availed to the first author during his stay in Dar es Salaam. The views contained in this paper are those of the authors. They do not represent any
other individual or institution(s) mentioned in the paper, nor do they
reflect the positions of the institutions with which the authors are affiliated.
References
1.
2.
3.
4.
5.
6.
7.
8.
9.
10.
11.
World Health Organisation: Working Together for HealthWorld Health Report. Geneva, Switzerland: WHO; 2006.
Chen L, Evans T, Anand S, Boufford JI, Brown H, Chowdhury M,
Cueto M, Dare L, Dussault G, Elzinga G, et al.: Human resources
for health: overcoming the crisis.
The Lancet 2004,
364:1984-1990.
Anand S, Barnighausen T: Human resources and health outcomes: cross-country econometric study. The Lancet 2004,
364:1603-1609.
Anand S, Barnighausen T: Health workers and vaccination coverage in developing countries: an econometric analysis. The
Lancet 2007, 369:1277-1285.
Robinson J, Wharrad H: Invisible Nursing: Exploring Health
Outcomes at Global Level. Relationships between Infant and
Under-5 Mortality Rates and the Distribution of Health Professionals, GNP per capita, and Female Literacy. Journal of
Advanced Nursing 2000, 32:28-40.
Brown MC: Using Gini-style indices to evaluate the spatial
patterns of health practitioners: theoretical considerations
and an application based on Alberta data. Social Science and
Medicine 1994, 38:1243-1256.
Robinson J, Wharrad H: Relationships between Attendance at
Birth and Maternal Mortality Rates: An exploration of
United Nation's data sets including the Ratios of Physicians
and Nurses to Population, GNP per capita and Female Literacy. Journal of Advanced Nursing 2001, 34:445-455.
Theodorakis PN, Mantzavinis GD, Rrumbullaku L, Lionis C, Trell E:
Measuring health inequalities in Albania: a focus on the distribution of general practitioners. Human Resources for Health
2006, 4:5.
Murphy G, O'Brien-Pallas L, Alksnis C, Birch S, Kephart G, Pennock
M, Pringle D, Rootman I, Wang S: Health Human Resources Planning: an Examination of Relationships among Nursing Service Utilisation, an Estimate of Population Health and Overall
Health Status Outcomes in the Province of Ontario. 2003.
Gravelle H, Sutton M: Inequality in the geographical distribution of general practitioners in England and Wales 1974–
1995. Journal of Health Services Research and Policy 2001, 6:6-13.
Wilkinson D, Symon B: Inequitable distribution of general practitioners in Australia: estimating need through the Robin
Hood Index. Australian and New Zealand Journal of Public Health
2000, 24:71-75.
Page 11 of 12
(page number not for citation purposes)
Human Resources for Health 2009, 7:4
12.
13.
14.
15.
16.
17.
18.
19.
20.
21.
22.
23.
24.
25.
26.
27.
28.
29.
30.
31.
32.
33.
34.
Gravelle H, Sutton M: Trends in geographical inequalities in
provision of general practitioners in England and Wales. The
Lancet 1998, 352:1910.
Wagstaff A: Socioeconomic inequality in Child Mortality:
Comparisons across nine Developing Countries. Bulletin of
World Health Organisation 2000, 78:19-29.
World Development Indicators: Washington DC, USA: World Bank;
2006.
United Republic of Tanzania: Poverty and Human Development
Report. Dar es Salaam, Tanzania: Research and Analysis Working
Group (RAWG); 2005.
United Republic of Tanzania: Human Resources for Health Census 2001/02. Ministry of Health and Social Welfare, Tanzania; 2002.
United Republic of Tanzania: Tanzania Demographic and Health
Survey. Dar es Salaam, Tanzania: National Bureau of Statistics and
ORC Macro; 2006.
United Republic of Tanzania: Tanzania HIV/AIDS Indicator Survey. Dar es Salaam, Tanzania: Tanzania Commission for AIDS
(TACAIDS) and National Bureau of Statistics; 2005.
Dussault G, Franceschini M: Not enough there, too many here:
understanding geographical imbalances in the distribution of
the health workforce. Human Resources for Health 2006, 4:12.
Gupta N, Zurn P, Diallo K, Dal-Poz M: Use of Population Census
Data for Monitoring Geographical Imbalance in the Health
Workforce:Snapshots from three Developing Countries.
International Journal for Equity in Health 2003, 2:11.
Johnston G, Wilkinson D: Increasingly inequitable distribution
of general practitioners in Australia, 1986–96. Australian and
New Zealand Journal of Public Health 2001, 25:66-70.
Cutler DM, Deaton AS, Lleras-Muney A: The Determinants of
Mortality. Journal of Economic Perspectives 2006, 20:97-120.
Jones G, Steketee RW, Black RE, Bhutta ZA, Morris SS: How many
child deaths can we prevent this year? The Lancet 2003,
362:65-71.
Black RE, Morris SS, Bryce J: Where and why are 10 million children dying every year? The Lancet 2003, 361:2226-2234.
Marchal B, De Brouwere V, Kegels G: HIV/AIDS Impact and the
Health Workforce Crisis:What are the Next Steps? Tropical
Medicine and International Health 2005, 10:300-304.
Ngalula J, Urassa M, Mwaluko G, Isingo R, Ties J: Health Service
Use and Household Expenditure During Terminal Illness due
to AIDS in Rural Tanzania. Tropical Medicine and International
Health 2002, 7:873-877.
Smith O: Human resource requirements for scaling up
antiretroviral therapy in low resource countries (Appendix
E). In Scaling up treatment for the global AIDS pandemic: Challenges and
opportunities Edited by: Curran J, Debas H, Arya M, Kelley P, Knobler
S, Pray L. Washinton DC: National Academies Press (Board of Global
Health); 2004.
Kinoti S, Tawfik L: The impact of HIV/AIDS on the health sector in Sub-Saharan Africa: the issue of human resources.
Report for the SARA (Support for Analysis and Research in Africa) project
2001.
Muhondwa E, Fimbo B: Impact of HIV/AIDS on Human
Resources for Health in Tanzania. Assessment Report Submitted
to Ministry of Health and Social Welfare and ECSA Secretariat, Arusha,
Tanzania 2006.
Kessy F, Mujinja P, Mashindano O, Tibandebage P, Kwesigabo G,
Mbaga-Kida T, Macha D: The Economic and Social Impact of
HIV/AIDS in Tanzania. Dar es Salaam, Tanzania: Economic and
Social Research Foundation (ESRF); 2003.
Madigan E, Curet O, Zrinyi M: Workforce analysis using data
mining and linear regression to understand HIV/AIDS prevalence patterns. Human Resources for Health 2008, 6:2.
United Republic of Tanzania: Population Census Report. Dar es
Salaam, Tanzania: National Bureau of Statistics; 2002.
Pong R, Pidblado JR: Don't take geography for granted: Some
methodological issues in measuring geographic distribution
of physicians. Canadian Journal of Rural Medicine 2001, 6:103-112.
United Republic of Tanzania: Resources allocation formula for
health basket fund (final draft). Dar es Salaam, Tanzania: Health
sector reform secretariat, Ministry of Health; 2003.
/>
Publish with Bio Med Central and every
scientist can read your work free of charge
"BioMed Central will be the most significant development for
disseminating the results of biomedical researc h in our lifetime."
Sir Paul Nurse, Cancer Research UK
Your research papers will be:
available free of charge to the entire biomedical community
peer reviewed and published immediately upon acceptance
cited in PubMed and archived on PubMed Central
yours — you keep the copyright
BioMedcentral
Submit your manuscript here:
/>
Page 12 of 12
(page number not for citation purposes)