Báo cáo sinh học: "Measurement of metabolic tumour volume: static versus dynamic FDG scans" potx
Bạn đang xem bản rút gọn của tài liệu. Xem và tải ngay bản đầy đủ của tài liệu tại đây (484.11 KB, 16 trang )
This Provisional PDF corresponds to the article as it appeared upon acceptance. Fully formatted
PDF and full text (HTML) versions will be made available soon.
Measurement of metabolic tumour volume: static versus dynamic FDG scans
EJNMMI Research 2011, 1:35 doi:10.1186/2191-219X-1-35
Patsuree Cheebsumon ()
Floris H P van Velden ()
Maqsood Yaqub ()
Corneline J Hoekstra ()
Linda M Velasquez ()
Wendy Hayes ()
Otto S Hoekstra ()
Adriaan A Lammertsma ()
Ronald Boellaard ()
ISSN 2191-219X
Article type Original research
Submission date 7 November 2011
Acceptance date 14 December 2011
Publication date 14 December 2011
Article URL />This peer-reviewed article was published immediately upon acceptance. It can be downloaded,
printed and distributed freely for any purposes (see copyright notice below).
For information about publishing your research in EJNMMI Research go to
/>For information about other SpringerOpen publications go to
EJNMMI Research
© 2011 Cheebsumon et al. ; licensee Springer.
This is an open access article distributed under the terms of the Creative Commons Attribution License ( />which permits unrestricted use, distribution, and reproduction in any medium, provided the original work is properly cited.
1
Measurement of metabolic tumor volume: static versus dynamic FDG scans
Patsuree Cheebsumon
1
, Floris HP van Velden
1
, Maqsood Yaqub
1
, Corneline J Hoekstra
2
,
Linda M Velasquez
3
, Wendy Hayes
3
, Otto S Hoekstra
1
, Adriaan A Lammertsma
1
, and Ronald
Boellaard*
1
1
Department of Nuclear Medicine & PET Research, VU University Medical Center, P.O. Box
7057, Amsterdam, 1007 MB, The Netherlands
2
Department of Nuclear Medicine, Jeroen Bosch Hospital, 's-Hertogenbosch, 5223 GZ, The
Netherlands
3
Bristol-Myers Squibb, Princeton, NJ, 08543, USA
*Corresponding author:
Email addresses:
PC:
FHPvV:
MY:
CJH:
LMV:
WH:
OSH:
AAL:
RB:
Abstract
Background: Metabolic tumor volume assessment using positron-emission tomography
[PET] may be of interest for both target volume definition in radiotherapy and monitoring
response to therapy. It has been reported, however, that metabolic volumes derived from
images of metabolic rate of glucose (generated using Patlak analysis) are smaller than those
derived from standardized uptake value [SUV] images. The purpose of this study was to
systematically compare metabolic tumor volume assessments derived from SUV and Patlak
images using a variety of (semi-)automatic tumor delineation methods in order to identify
methods that can be used reliably on (whole body) SUV images.
Methods: Dynamic [
18
F]-fluoro-2-deoxy-D-glucose [FDG] PET data from 10 lung and 8
gastrointestinal cancer patients were analyzed retrospectively. Metabolic tumor volumes were
derived from both Patlak and SUV images using five different types of tumor delineation
methods, based on various thresholds or on a gradient.
Results: In general, most tumor delineation methods provided more outliers when metabolic
volumes were derived from SUV images rather than Patlak images. Only gradient-based
methods showed more outliers for Patlak-based tumor delineation. Median measured
metabolic volumes derived from SUV images were larger than those derived from Patlak
images (up to 59% difference) when using a fixed percentage threshold method. Tumor
volumes agreed reasonably well (<26% difference) when applying methods that take local
signal-to-background ratio [SBR] into account.
2
Conclusion: Large differences may exist in metabolic volumes derived from static and
dynamic FDG image data. These differences depend strongly on the delineation method used.
Delineation methods that correct for local SBR provide the most consistent results between
SUV and Patlak images.
Keywords: tumor delineation; tumor volume; FDG PET; Patlak; SUV.
Background
Positron-emission tomography [PET] may be used to delineate the biological target volume
for both radiotherapy and response monitoring purposes [1-4]. The most widely used PET
tracer, [
18
F]-fluoro-2-deoxy-D-glucose [FDG], might improve accuracy of tumor volume
definition for radiotherapy by identifying areas within the tumor that are more metabolically
active [5]. Tumor volumes can be delineated on either images of glucose metabolic rate or
standardized uptake value [SUV] images [6]. SUV is most commonly used for (semi-
)quantification of whole-body FDG PET studies and only requires a static scan. Images of
glucose metabolic rate can be generated from dynamic scans using a measured or image-
derived arterial input function together with Patlak graphical analysis. It is well known that
Patlak analysis is quantitatively more accurate than SUV analysis. Patlak analysis, however,
requires a dynamic scan and limits data acquisition to a single bed position with an axial
coverage of <20 cm.
As shown previously [6], metabolic volumes, defined using a 50% isocontour method,
were smaller when defined on Patlak images than when defined on SUV images. To date,
however, no systematic comparison has been performed in which various existing (semi-
)automatic tumor delineation methods have been applied to both SUV and Patlak images.
Recently, a number of different (semi-)automatic tumor delineation methods have
been validated for SUV images using both simulations [7, 8] and lung tumor FDG scans [9,
10]. Most methods showed good performance as measured maximum diameters derived from
these methods corresponded well with pathological measurements [11]. As most of tumor
delineation methods that correct for local background are less sensitive to changes in local
contrast, these methods might show better correspondence between measured tumor volumes
derived from either Patlak or SUV images. Therefore, the purpose of this study was to
systematically compare measured metabolic tumor volumes derived from SUV and Patlak
images using a variety of (semi-)automatic tumor delineation methods.
Materials and methods
Patient data
Dynamic FDG PET scans from 10 non-small cell lung cancer [NSCLC] (stages IIIB to IV)
patients [12] and 8 gastrointestinal [GI] (colorectal carcinoma) cancer patients [13] were
included retrospectively. All scans had been acquired prior to therapy. All patients had given
written informed consent, and both studies had been approved by the Medical Ethics Review
Committee of the VU University Medical Center.
For NSCLC patients (three females, seven males; weight 76 ± 10 kg, range 56 to 94
kg), blood glucose levels were within the normal range (mean 5.5 ± 0.6 mmol·L
−1
, range 4.4
to 7.0 mmol·L
−1
). The same was true for blood glucose levels (mean 5.6 ± 0.8 mmol·L
−1
,
range 3.9 to 7.0 mmol·L
−1
) of patients with advanced GI malignancies (one female, seven
males; weight 85 ± 15 kg, range 60 to 110 kg).
3
PET scanning protocol
All patients fasted for at least 6 h before scanning. Patients were prepared in accordance with
recently published guidelines for quantitative PET studies [14]. They were scanned in a
supine position and received an intravenous catheter for tracer administration. During
dynamic scanning, blood samples for determining plasma glucose levels were collected at
fixed times (i.e., at 35, 45, 55 min post injection). All dynamic scans were performed using an
ECAT EXACT HR+ scanner (Siemens/CTI, Knoxville, TN, USA) [15], having a 15.5-cm
axial field of view. Each scan session started with a 10-min transmission scan using three
retractable rotating
68
Ge line sources. After completion of the transmission scan, a bolus of
FDG was administrated intravenously (388 ± 71 and 459 ± 97 MBq for NSCLC and GI
cancer, respectively), at the same time starting a dynamic emission scan in a 2-D acquisition
mode. Each dynamic scan consisted of 40 frames with the following lengths, 1 × 30, 6 × 5, 6
× 10, 3 × 20, 5 × 30, 5 × 60, 8 × 150, 6 × 300 s. In addition, a static scan was created by
summing the sinograms of the last three frames (i.e., 45 to 60 min post injection).
All data were normalized and corrected for attenuation, random coincidences, scatter
radiation, dead time, and decay. Reconstructions were performed using normalization and
attenuation-weighted ordered subsets expectation maximization [OSEM] with 2 iterations and
16 subsets, followed by post-smoothing using a 0.5 Hanning filter. This resulted in an image
resolution of approximately 6.5 mm full width at half maximum. An image matrix size of 256
× 256 × 63 was used, corresponding to a pixel size of 2.57 × 2.57 × 2.43 mm
3
.
After reconstruction, the summed image (45 to 60 min post injection) was used to
generate a SUV image by normalizing local tissue concentrations to injected dose and body
weight. In addition, Patlak analysis, a kinetic linearized model [16] for irreversible tracer
uptake, was applied to the interval 10 to 60 min post injection to generate an image of net
influx rate [K
i
] of FDG, which is proportional to the metabolic rate of glucose. Image-derived
input functions [IDIF] were used as plasma input curves and obtained as described by
Cheebsumon et al. [17]. In short, 3-D volumes of interest [VOI] were drawn manually in three
vascular structures (i.e., the left ventricle, aortic arch, and ascending aorta) using an early
frame that highlights the blood pool [18]. These VOI were then projected onto all frames
yielding arterial whole blood time activity curves (i.e., IDIF). The average input curves from
VOI defined in the three vascular structures were used as an input function during Patlak
analysis.
Data analysis
For the 10 NSCLC patients, VOI were defined for 54 lesions that were all located in the lung.
For the 8 GI cancer patients, VOI were defined for 37 lesions that were located in the liver (n
= 23), lung (n = 12), or colon (n = 2). All lesions that could be identified by an expert
physician were included in this study. Metabolic tumor volumes were obtained using the
following five different types of (semi-)automatic VOI methods:
1. Fixed threshold of 50% and 70% (VOI
50
, VOI
70
). In this method, a fixed threshold
(i.e., 50% or 70%) of the maximum voxel value within a tumor is used to delineate the
tumor [19].
2. Adaptive threshold of 41%, 50%, and 70% (VOI
A41
, VOI
A50
, VOI
A70
). This is similar to
the fixed threshold method, except that it adapts the threshold relative to the local
average background, thereby correcting for the contrast between the tumor and local
background [19].
3. Contrast-oriented method (VOI
Schaefer
). This method uses the average of SUV within a
70% threshold of SUV
max
isocontour (meanSUV
70%
) and background activity for
various sphere sizes. Regression coefficients are calculated, which represent the
4
relationship between the optimal threshold and image contrast for various sphere sizes
[3]. This threshold equation is given by:
optimal 70%
Threshold meanSUV Background
A B
= × + ×
,
where A and B are fitted using phantom studies [3]. When applied to Patlak images, K
i
rather than SUV is used. In general, different values are applied for sphere diameters
smaller and larger than 3 cm in diameter. In the present study, this method was
recalibrated, i.e., specific A and B values for the image characteristics used were
determined.
4. Background-subtracted relative-threshold level [RTL] method (VOI
RTL
). This method
is an iterative method that is based on a convolution of the point-spread function,
which takes into account differences between various sphere sizes and the scanner
resolution [4].
5. Gradient-based watershed segmentation method. This method uses two steps before
calculating the VOI [2]. First, a gradient image is calculated on which a ‘seed’ is
placed in the tumor (tumor basin) and another in the background (background basin).
Next, a watershed [WT] algorithm is used to grow both seeds in the gradient basins,
thereby creating boundaries on the gradient edges. In the present study, two different
types of gradient basins were used. In the first approach [Grad
WT1
], all voxels on the
edge between the tumor and background are assigned to the tumor [8, 10]. In the
second approach [Grad
WT2
], an upsampled image is used to ensure less effects of
sampling. In addition, a voxel on the edge between the tumor and background is
allocated to either the tumor or background based on the smallest difference with that
voxel value.
To reduce sensitivity to noise, for all methods, the maximum voxel value was obtained using
a cross-shaped pattern. This method searches for the region with the (local) average maximum
intensity based on the average of seven neighboring voxels, which was then used as a
maximum or ‘peak’ value. The tumor-to-background ratio was calculated by dividing this
maximum value by the background value surrounding the tumor.
Statistical analyses
Both metabolic volumes and differences in measured volumes derived from two image types
are reported. The percentage volume difference was defined as
SUV
Patlak
Volume
1 100%
Volume
− ×
. Note
that this value can be negative, indicating an underestimation of the SUV-derived metabolic
volume compared with the Patlak-derived volume. In addition, for each delineation method,
mean, median, first quartile, third quartile, minimum, and maximum values, including
statistical outliers, are reported in box plots. Moreover, visual outliers were identified as VOIs
that showed unrealistically large or small volumes when compared visually with the tumor.
These outliers were not included in the statistical analysis when calculating p values. A two-
tailed Wilcoxon signed-rank test was used to indicate statistically significant differences
between measured volumes derived from SUV and Patlak images, where p values less than
0.05 were considered to be significant.
Results
Table 1 shows the number of visual outliers (i.e., those cases where there is an obvious
mismatch between derived VOI and tumor boundaries) for all methods applied to both Patlak
and SUV images, specifying results for NSCLC and GI cancer separately. In general, most
tumor delineation methods provided more outliers when metabolic volumes were derived
from SUV images rather than Patlak images. Only gradient-based methods showed more
5
outliers for Patlak-based tumor delineation. VOI
70
and VOI
A70
provided no outliers for either
image or cancer type.
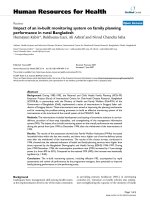
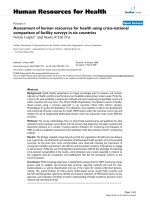
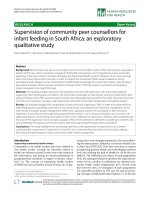
In general, measured tumor volumes derived from SUV images were larger than those
derived from Patlak images. Example images of the measured tumor volumes derived from
SUV and Patlak images are shown in Figure 1. Exceptions were VOI
A70
for both types of
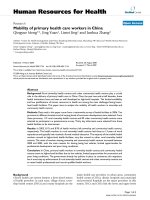
cancer and the two gradient-based methods for GI cancer (Tables 2 and 3). Large differences
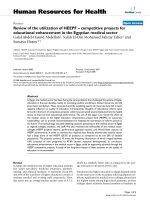
(up to 58.7% and 28.1% for NSCLC and GI cancer, respectively) in measured metabolic
volume based on the two image types were observed for the various delineation methods
(Figure 2A). In the case of NSCLC, the median difference in volume was higher for fixed
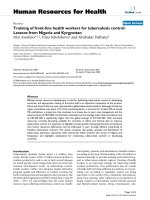
threshold methods than for adaptive, contrast-oriented, or gradient-based methods. This is
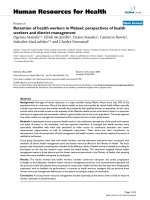
further illustrated by Figure 3A, where VOI
A50
(i.e., with background correction) shows better
correspondence between SUV- and Patlak-based volumes than VOI
50
(i.e., without
background correction). Only Grad
WT1
provided no significant difference (p > 0.05) in the
metabolic volume derived from SUV and Patlak images, but this may be due to the large
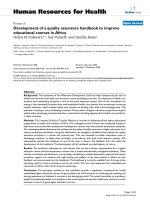
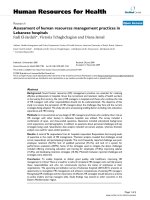
spread in differences (Figure 3B). Similar results were found when these differences in
volume were compared to SUV (or K
i
values, Figures 4A,B). In general, we observed that
smaller lesions also had the lowest SUV. Consequently, the largest volume differences
between SUV and Patlak image-based tumor delineations were seen for lesions having a low
SUV and a small metabolic volume.
Similar trends were observed for GI cancer (Figures 2B and 3C,D). Here, Grad
WT1
(only after removal of visual outliers), Grad
WT2
, and VOI
A50
provided no significant
differences (p > 0.05) between measured volumes derived from both image types. In addition,
similar trends were observed when data from both studies were pooled and presented
separately for the specific locations of the tumors (i.e., the liver or the lung, Figure 2C).
Discussion
The main use of FDG is measurement of glucose metabolism. However, FDG PET can also
be used to measure the volume with increased metabolism. In a previous report [6], it was
shown that tumor delineation using Patlak-derived glucose metabolism images provided
smaller volumes and sharper borders than when SUV images were used. This was due to a
higher local contrast in Patlak images than in SUV images. Patlak analysis, however, may not
always be feasible or optimal because it requires (measured) arterial input data and a dynamic
scan, which limits coverage to a single bed position. Therefore, in clinical practice, a static
whole-body scan (covering the whole body) might be preferred, in which case data can only
be analyzed using a SUV approach. It is well known, however, that SUV may be affected by
technical, biological, and physical factors [20] that could hamper tumor delineation using this
image type.
In agreement with Visser et al. [6], the present study showed (for two types of cancer)
that when a fixed percentage threshold method (i.e., VOI
50
) was used, significantly larger
metabolic volumes were obtained from SUV images than from Patlak images. However, these
differences reduced when using methods that correct for local background and/or contrast,
and in the case of gradient-based methods (Figure 2, Tables 2 and 3). This confirms that
SUV-based tumor delineation is sensitive to signal-to-background ratios. Differences in
Patlak- and SUV-derived volumes were larger for NSCLC than for GI cancer, especially in
the case of methods that use a fixed percentage threshold without background correction. As
local (image) contrast for GI cancer was larger than that for NSCLC (average tumor-to-
background ratios 7.4 and 5.3, respectively), this further illustrates the sensitivity to signal-to-
background ratio.
Some tumor delineation methods (i.e., VOI
50
, VOI
A41
, and Grad
WT1
) provided visually,
unrealistically large tumor volumes (in up to 41% of cases) when applied to SUV images,
6
while VOI
Schaefer
did the same (in up to 8% of cases) for both image types (Table 1). In
contrast, Grad
WT2
provided many unrealistically small tumor volumes (in up to 24% of cases)
for both image types. This suggests that these methods should be applied carefully and that
their performance should be supervised.
Two different implementations of gradient-based methods were evaluated in the
present study. In a previous NSCLC study [11], tumor diameters obtained using Grad
WT2
corresponded better to pathology than those obtained using Grad
WT1
. As shown in Figure 3B,
the present study also showed that measured volumes obtained from Grad
WT2
were smaller
than those from Grad
WT1
. However, Grad
WT1
showed better correspondence between SUV-
and Patlak-derived volumes than Grad
WT2
(1.9% and 18.2%, respectively). In contrast, for GI
cancer, Grad
WT2
showed better correspondence between SUV- and Patlak-derived volumes
than Grad
WT1
(−2.1% and −9.1%, respectively). This suggests that the performance of
gradient-based methods may also depend on signal-to-background ratios.
Differences between metabolic volumes obtained from SUV and Patlak images
reduced when signal-to-background-corrected delineation methods are used. This finding is in
line with previous studies reporting on test-retest variability using various tumor delineation
methods [10, 21] that confirmed that VOI
A50
seems to be a good possible candidate for
response monitoring purposes. However, gradient-based methods have been shown to be good
candidates for radiotherapy purposes [10, 22]. Therefore, either signal-to-background-
corrected or gradient-based methods may be good candidates for response assessments and
radiotherapy purposes.
Limitations
A limitation of this study is the lack of an independent reference standard to define tumor
volumes, and consequently, in this paper, we could only study differences in (semi-)automatic
tumor delineation method performance when applied onto Patlak versus SUV images.
However, the accuracy and precision of several (semi-)automatic tumor delineation methods
have been studied previously using simulations [8] and clinical test-retest data [10]. Both
articles showed that performance of tumor delineation methods are affected by several factors,
such as scanner type, radiotracer, image noise, and tumor characteristics. It is generally
accepted that pathology is the gold standard. Therefore, studies are needed and are currently
performed that compare the tumor volumes obtained using (semi-)automatic delineation
methods with pathology [11].
Although the Patlak analysis was performed on OSEM-reconstructed images in order
to reduce the levels of noise, Patlak images still showed a small fraction (<1%) of voxels that
had a negative slope, exclusively seen in non-tumor tissue locations. Correlation-coefficient
filtered parametric imaging, as proposed by Zasadny and Wahl [23], could potentially
enhance the quality of the Patlak images and could be further investigated to improve the
accuracy of automated tumor delineation. Despite the lack of using such a denoising method,
our results were in line with those published by Visser et al. [6], and we could identify that
tumor delineation methods that correct for local signal-to-background contrast or use
gradients showed a better agreement in tumor volume assessment between Patlak and SUV
images than those tumor delineation methods that did not.
Conclusion
Large differences may exist in metabolic volumes derived from static (SUV) and dynamic
(Patlak) FDG image data. These differences depend strongly on the delineation method used.
(Semi-)automatic tumor delineation methods that correct for local signal-to-background
contrast or use gradients provide the most consistent results between SUV and Patlak images.
7
Competing interests
The authors declare that they have no competing interests.
Authors' contributions
PC performed the data analysis and data interpretation and was the main author of the
manuscript. FHPvV performed the data interpretation, implemented some of the tumor
delineation methods, and assisted in drafting the manuscript. MY implemented some of the
tools to perform tumor delineations and critically reviewed the manuscript. CJH performed
part of the data acquisition and critically reviewed the manuscript. LMV provided the PET
image data and reviewed the manuscript. WH provided/collected the PET image data and
reviewed the manuscript. OSH reviewed the manuscript and approved its final content. AAL
reviewed the manuscript, contributed to the intellectual content (supervision), and approved
the final content of the manuscript. RB performed the study design, implemented some of the
tumor delineation methods, supervised the project, and reviewed and approved the final
content of the manuscript. All authors reviewed the collected data and interpretation, provided
feedback for further research during the study, and approved the final submitted version of
this manuscript.
Acknowledgments
This study was performed within the framework of the Center for Translational Molecular
Medicine (CTMM), AIRFORCE project (grant 03O-103). Data used in this paper were
derived in part from a study financed by Bristol-Myers Squibb. Patsuree Cheebsumon was
supported by a scholarship from the National Science and Technology Development Agency
of the Royal Thai Government.
8
References
1. de Geus-Oei LF, van der Heijden HF, Corstens FH, Oyen WJ: Predictive and prognostic
value of FDG-PET in nonsmall-cell lung cancer: a systematic review. Cancer 2007,
110:1654-1664.
2. Geets X, Lee JA, Bol A, Lonneux M, Gregoire V: A gradient-based method for
segmenting FDG-PET images: methodology and validation. Eur J Nucl Med Mol
Imaging 2007, 34:1427-1438.
3. Schaefer A, Kremp S, Hellwig D, Rube C, Kirsch CM, Nestle U: A contrast-oriented
algorithm for FDG-PET-based delineation of tumour volumes for the radiotherapy of
lung cancer: derivation from phantom measurements and validation in patient data.
Eur J Nucl Med Mol Imaging 2008, 35:1989-1999.
4. van Dalen JA, Hoffmann AL, Dicken V, Vogel WV, Wiering B, Ruers TJ, Karssemeijer N,
Oyen WJ: A novel iterative method for lesion delineation and volumetric
quantification with FDG PET. Nucl Med Commun 2007, 28:485-493.
5. Nestle U, Weber W, Hentschel M, Grosu AL: Biological imaging in radiation therapy:
role of positron emission tomography. Phys Med Biol 2009, 54:R1-25.
6. Visser EP, Philippens ME, Kienhorst L, Kaanders JH, Corstens FH, de Geus-Oei LF, Oyen
WJ: Comparison of tumor volumes derived from glucose metabolic rate maps and
SUV maps in dynamic 18F-FDG PET. J Nucl Med 2008, 49:892-898.
7. Hatt M, Cheze le RC, Albarghach N, Pradier O, Visvikis D: PET functional volume
delineation: a robustness and repeatability study. Eur J Nucl Med Mol Imaging 2011,
38:663-672.
8. Cheebsumon P, Yaqub M, van Velden FH, Hoekstra OS, Lammertsma AA, Boellaard R:
Impact of [(18)F]FDG PET imaging parameters on automatic tumour delineation:
need for improved tumour delineation methodology. Eur J Nucl Med Mol Imaging
2011, 38:2136-2144.
9. Hatt M, Cheze-Le RC, Aboagye EO, Kenny LM, Rosso L, Turkheimer FE, Albarghach
NM, Metges JP, Pradier O, Visvikis D: Reproducibility of 18F-FDG and 3'-deoxy-3'-
18F-fluorothymidine PET tumor volume measurements. J Nucl Med 2010, 51:1368-
1376.
10. Cheebsumon P, van Velden FH, Yaqub M, Frings V, de Langen AJ, Hoekstra OS,
Lammertsma AA, Boellaard R: Effects of image characteristics on performance of
tumor delineation methods: a test-retest assessment. J Nucl Med 2011, 52:1550-1558.
11. Cheebsumon P, van Velden FHP, de Ruysscher D, van Elmpt W, Yaqub M, Hoekstra OS,
Lammertsma AA, Boellaard R: Assessment of tumour volume in lung cancer: PET
versus CT based methods [abstract]. Eur J Nucl Med Mol Imaging 2010, 37:s257.
12. Hoekstra CJ, Hoekstra OS, Stroobants SG, Vansteenkiste J, Nuyts J, Smit EF, Boers M,
Twisk JW, Lammertsma AA: Methods to monitor response to chemotherapy in non-
small cell lung cancer with 18F-FDG PET. J Nucl Med 2002, 43:1304-1309.
13. Velasquez LM, Boellaard R, Kollia G, Hayes W, Hoekstra OS, Lammertsma AA,
Galbraith SM: Repeatability of 18F-FDG PET in a multicenter phase I study of
patients with advanced gastrointestinal malignancies. J Nucl Med 2009, 50:1646-1654.
14. Boellaard R, O'Doherty MJ, Weber WA, Mottaghy FM, Lonsdale MN, Stroobants SG,
Oyen WJ, Kotzerke J, Hoekstra OS, Pruim J et al: FDG PET and PET/CT: EANM
procedure guidelines for tumour PET imaging: version 1.0. Eur J Nucl Med Mol
Imaging 2010, 37:181-200.
15. Brix G, Zaers J, Adam LE, Bellemann ME, Ostertag H, Trojan H, Haberkorn U, Doll J,
Oberdorfer F, Lorenz WJ: Performance evaluation of a whole-body PET scanner using
9
the NEMA protocol. National Electrical Manufacturers Association. J Nucl Med
1997, 38:1614-1623.
16. Patlak CS, Blasberg RG: Graphical evaluation of blood-to-brain transfer constants
from multiple-time uptake data. Generalizations. J Cereb Blood Flow Metab 1985,
5:584-590.
17. Cheebsumon P, Velasquez LM, Hoekstra CJ, Hayes W, Kloet RW, Hoetjes NJ, Smit EF,
Hoekstra OS, Lammertsma AA, Boellaard R: Measuring response to therapy using
FDG PET: semi-quantitative and full kinetic analysis. Eur J Nucl Med Mol Imaging
2011, 38:832-842.
18. van der Weerdt AP, Klein LJ, Boellaard R, Visser CA, Visser FC, Lammertsma AA:
Image-derived input functions for determination of MRGlu in cardiac (18)F-FDG
PET scans. J Nucl Med 2001, 42:1622-1629.
19. Boellaard R, Krak NC, Hoekstra OS, Lammertsma AA: Effects of noise, image
resolution, and ROI definition on the accuracy of standard uptake values: a
simulation study. J Nucl Med 2004, 45:1519-1527.
20. Boellaard R: Standards for PET image acquisition and quantitative data analysis. J
Nucl Med 2009, 50:11S-20S.
21. Frings V, de Langen AJ, Smit EF, van Velden FH, Hoekstra OS, van TH, Boellaard R:
Repeatability of metabolically active volume measurements with 18F-FDG and 18F-
FLT PET in non-small cell lung cancer. J Nucl Med 2010, 51:1870-1877.
22. Wanet M, Lee JA, Weynand B, De BM, Poncelet A, Lacroix V, Coche E, Gregoire V,
Geets X: Gradient-based delineation of the primary GTV on FDG-PET in non-small
cell lung cancer: a comparison with threshold-based approaches, CT and surgical
specimens. Radiother Oncol 2011, 98:117-125.
23. Zasadny KR, Wahl RL: Enhanced FDG-PET tumor imaging with correlation-
coefficient filtered influx-constant images. J Nucl Med 1996, 37:371-374.
Figure 1. Coronal images of the measured tumor volumes. Coronal images of the
measured tumor volumes derived from SUV and Patlak images of one patient with NSCLC,
obtained using four different tumor delineation methods (i.e., VOI
50
, VOI
A50
, Grad
WT1
, and
Grad
WT2
).
Figure 2. Box-and-whisker plots of the percentage differences between measured
volumes derived from SUV and Patlak images. Box-and-whisker plots of the percentage
differences between measured volumes derived from SUV and Patlak images for different
tumor delineation methods in (A) NSCLC and (B) GI cancer, and (C) the pooled data from
both studies specified per location, i.e., the liver and the lung. The median is the horizontal
line between the lower (first) and upper (third) quartiles. Empty square represents the average
value, cross, the minimum and maximum values, and filled left-pointing pointer, the number
of statistical outliers. The percentage difference was defined as
SUV
Patlak
Volume
1 100%
Volume
− ×
.
Figure 3. Percentage difference in measured volumes compared to the measured volume.
Percentage difference in measured volumes compared to the measured volume derived from
SUV and Patlak images for various delineation methods applied to (A, B) NSCLC and (C, D)
GI cancer. Note that some data points (for VOI
50
and Grad
WT2
) fall outside the range of the
figure. The percentage difference was defined as
SUV
Patlak
Volume
1 100%
Volume
− ×
.
10
Figure 4. Percentage difference in measured volumes compared to SUV. Percentage
difference in measured volumes compared to SUV derived from SUV and Patlak images for
various delineation methods applied to (A, B) NSCLC and (C, D) GI cancer. Note that some
data points (for VOI
50
and Grad
WT2
) fall outside the range of the figure. The percentage
difference was defined as
SUV
Patlak
Volume
1 100%
Volume
− ×
.
Table 1. Number of visual outliers in SUV- and Patlak-derived measured metabolic
volumes for both cancer
NSCLC GI cancer Delineation
method
SUV image Patlak
image
SUV image Patlak
image
VOI
50
9 - 5 3
VOI
70
- - - -
VOI
A41
4 1 5 3
VOI
A50
- - - 1
VOI
A70
- - - -
VOI
RTL
- 1 3 -
VOI
Schaefer
2 2 3 2
Grad
WT1
- 3 13 15
Grad
WT2
2 5 5 5
NSCLC, non-small cell lung cancer; GI, gatrointestinal; SUV, standardized uptake value;
VOI, volumes of interest; Grad
WT1
, gradient-based watershed first approach; Grad
WT2
,
gradient-based watershed second approach.
Table 2. Mean, median, minimum, and maximum values of metabolic volumes and their
median differences for NSCLC
Volume obtained from SUV
image (mL)
Volume obtained from Patlak
image (mL)
Delineation
method
Mean Median Min Max Mean Median Min Max
% Median
difference
a
P
value
b
P
value
b
VOI
50
84.2 6.9 1.2 950.2
7.7 2.7 0.7 74.4 58.7 <0.001 <0.001
VOI
70
4.9 1.5 0.5 50.2 2.5 1.1 0.3 23.7 48.0 <0.001 <0.001
VOI
A41
22.7 5.2 1.2 294.4
10.9 3.5 0.9 95.2 25.8 <0.001 <0.001
VOI
A50
8.8 2.4 0.6 97.0 6.6 2.4 0.5 70.6 15.0 <0.001 <0.001
VOI
A70
2.1 0.5 0.1 23.4 1.8 0.8 0.2 19.9 −25.0 0.044 0.044
VOI
RTL
10.4 3.6 0.4 101.9
7.7 3.1 0.3 73.1 15.6 <0.001 <0.001
VOI
Schaefer
17.2 5.1 1.0 125.7
13.8 4.2 0.9 104.2
14.3 <0.001 <0.001
Grad
WT1
12.3 3.9 1.4 163.2
10.4 5.4 1.6 50.9 1.9 0.725 0.324
Grad
WT2
5.8 2.7 0.6 63.2 3.7 2.1 0.5 28.2 18.2 <0.001 0.001
a
The percentage difference was defined as
SUV
Patlak
Volume
1 100%
Volume
− ×
. The average tumor-to-
background ratio was 5.3 (range 2.7 to 12.7) and 18.8 (range 6.1 to 81.0) when derived from
SUV and Patlak images, respectively.
b
Without visual outliers. SUV, standardized uptake
value; min, minimum; max, maximum; VOI, volumes of interest; Grad
WT1
, gradient-based
watershed first approach; Grad
WT2
, gradient-based watershed second approach.
11
Table 3. Mean, median, minimum, and maximum values of metabolic volumes and
median differences for GI cancer
Volume obtained from SUV
image (mL)
Volume obtained from Patlak
image (mL)
Delineation
method
Mean Median Min Max Mean Median Min Max
% Median
difference
a
P
value
b
P
value
b
VOI
50
190.4 15.4 2.7 2297.8 65.2 10.1 2.1 822.9 28.1 <0.001 <0.001
VOI
70
10.5 3.9 1.3 57.6 8.8 3.5 1.0 45.2 18.5 <0.001 <0.001
VOI
A41
195.4 28.6 3.3 2402.5 86.1 11.9 2.5 1257.6 16.5 <0.001 <0.001
VOI
A50
20.3 6.0 2.1 121.2 22.2 6.8 1.9 107.3 8.1 0.364 0.215
VOI
A70
5.1 1.7 0.7 38.8 6.57 2.38 0.51 34.26 −13.3 0.001 0.001
VOI
RTL
33.3 7.2 0.3 538.2 17.78 6.75 0.26 111.14 7.5 0.040 0.042
VOI
Schaefer
158.0 14.7 3.4 2212.0 48.1 13.0 2.5 564.6 8.3 0.003 0.004
Grad
WT1
43.5 32.8 9.1 223.5 51.2 43.2 10.2 229.4 −9.1 0.025 0.085
Grad
WT2
12.4 6.8 1.5 74.1 14.2 8.6 1.6 85.3 −2.1 0.625 1.000
a
The percentage difference was defined as
SUV
Patlak
Volume
1 100%
Volume
− ×
. The average tumor-to-
background ratio was 7.4 (range 2.4 to 31.6) and 16.0 (range 3.0 to 32.0) when derived from
SUV and Patlak images, respectively.
b
Without visual outliers. SUV, standardized uptake
value; min, minimum; max, maximum; VOI, volumes of interest; Grad
WT1
, gradient-based
watershed first approach; Grad
WT2
, gradient-based watershed second approach.
Figure 1
Figure 2
Figure 3
Figure 4