Báo cáo sinh học: " PET kinetics of radiolabeled antidepressant, [N-methyl-11C]mirtazapine, in the human brain" ppt
Bạn đang xem bản rút gọn của tài liệu. Xem và tải ngay bản đầy đủ của tài liệu tại đây (302.97 KB, 18 trang )
This Provisional PDF corresponds to the article as it appeared upon acceptance. Fully formatted
PDF and full text (HTML) versions will be made available soon.
PET kinetics of radiolabeled antidepressant, [N-methyl-11C]mirtazapine, in the
human brain
EJNMMI Research 2011, 1:36 doi:10.1186/2191-219X-1-36
Ole L Munk ()
Donald F Smith ()
ISSN 2191-219X
Article type Original research
Submission date 9 September 2011
Acceptance date 15 December 2011
Publication date 15 December 2011
Article URL />This peer-reviewed article was published immediately upon acceptance. It can be downloaded,
printed and distributed freely for any purposes (see copyright notice below).
For information about publishing your research in EJNMMI Research go to
/>For information about other SpringerOpen publications go to
EJNMMI Research
© 2011 Munk and Smith ; licensee Springer.
This is an open access article distributed under the terms of the Creative Commons Attribution License ( />which permits unrestricted use, distribution, and reproduction in any medium, provided the original work is properly cited.
1
PET kinetics of radiolabeled antidepressant, [N-methyl-
11
C]mirtazapine, in the
human brain
Ole L Munk*
1
and Donald F Smith
2
1
Department of Nuclear Medicine & PET Centre, Aarhus University Hospital, Nørrebrogade 44,
Aarhus C 8000, Denmark
2
Center for Psychiatric Research, Aarhus University Hospital, Risskov 8240, Denmark
*Corresponding author:
Email addresses:
OLM:
DFS:
Abstract
Background: We compared six kinetic models with and without the requirement of arterial
cannulation for estimating the binding potential of [N-methyl-
11
C]mirtazapine in the living
human brain.
Methods: Distribution volumes of [N-methyl-
11
C]mirtazapine in brain regions were estimated
using single- and two-tissue compartment models as well as a graphical plasma input model. The
two-tissue compartment model provided a direct estimate of the binding potentials of [N-methyl-
11
C]mirtazapine in brain regions, while binding potentials of the single-tissue compartment model
and the graphical plasma input model were estimated indirectly from ratios of distribution
volumes in brain regions. We obtained also direct estimates of binding potentials using a
graphical reference tissue model and two nonlinear reference tissue models.
Results: The two-tissue compartment model required several fits with different initial guesses for
avoiding negative values of parameters. Despite the extra fits, estimates of distribution volumes
and binding potentials of [N-methyl-
11
C]mirtazapine obtained by the two-tissue compartment
model were far more variable than those produced by the other methods. The graphical plasma
input method and the graphical reference tissue method provided estimates of the binding
potential that correlated closely, but differed in magnitude. The single-tissue compartment model
provided relatively low estimates of binding potentials with curves that failed to fit the data as
well as the three other methods that used the entire series of positron emission tomography data.
The reference tissue method and the simplified reference tissue method provided similar,
consistent estimates of binding potentials. However, certain assumptions of the simplified
reference tissue method may not be fulfilled by the radioligand.
Conclusion: The reference tissue method is appropriate for estimating the binding potential of
[N-methyl-
11
C]mirtazapine in regions of the human brain so that the binding potential of [N-
methyl-
11
C]mirtazapine can be estimated without arterial cannulation.
Keywords: [
11
C]mirtazapine; antidepressant; PET; kinetic models; distribution volume; binding
potential; human brain.
2
Background
Mirtazapine is an atypical antidepressant drug belonging to a class of compounds known as
noradrenergic and specific serotonergic antidepressants [1-5]. Extensive clinical trials have
shown mirtazapine to be among the most effective antidepressants [3, 4]. The antidepressant
enters the central nervous system rapidly [6], which makes it a suitable candidate for short-term
kinetic modeling [7]. Previously, we radiolabeled mirtazapine with
11
C (Figure 1) and studied it
by positron emission tomography [PET] in anesthetized pigs [8, 9]. We obtained arterial blood
samples for kinetic data analysis and found that the compound had a differential distribution in
brain regions, with the highest binding potentials in the frontal and temporal cortices,
intermediate binding potential in the thalamus, and low binding potentials in the striatum,
hypothalamus, and brainstem. Thereafter, we initiated PET studies with arterial sampling in
humans and used a single-tissue compartment model to estimate brain regional binding potentials
[10]. We found that regions of the human brain also differed markedly in the distribution and
binding of [N-methyl-
11
C]mirtazapine, which has furthered our interest in using the radioligand
for PET. Experience with arterial cannulation in humans has, however, indicated that the
procedure can be disadvantageous for routine brain imaging [7], in part occasionally due to
discomfort at the cannulation site. Here, we carried out the present study to determine whether a
reference region method, which requires no arterial blood sampling, can also provide reliable
estimates of binding potentials of [N-methyl-
11
C]mirtazapine in human brain regions.
Methods
Subjects
The study was approved by the Danish Medicines Agency, the Ethics Committee of Aarhus
Municipality, and the Committee for Good Clinical Practice of Aarhus University Hospital. We
used five males (ranges 37 to 66 years old, 70 to 94 kg) who gave informed consent to participate
in the study after receiving a written and oral account of the project. They were currently in good
general health with no indication of past or present mental illness.
Scanning procedure
For brain imaging, we used an ECAT EXACT HR PET camera (CTI/Siemens, Knoxville, TN,
USA) with a radiation shield located on each side of the neck (NeuroShield®, Scanwell Systems,
Montreal, Canada). After a transmission scan, subjects received an intravenous injection of [N-
methyl-
11
C]mirtazapine (ranges: radioactivity injected = 175 to 413 MBq, specific activities = 13
to 67 GBq/µmol, stable mirtazapine dosage = 15 to 50 µg) at the start of a 60-min dynamic PET
scan of 28 frames (6 × 10 s, 4 × 30 s, 7 × 60 s, 5 × 120 s, 4 × 300 s, 2 × 600 s) recorded in 3D
mode. PET data were reconstructed using filtered backprojection and a Hanning filter with a
cutoff frequency of 0.5 per cycles, resulting in a special resolution (FWHM) of about 5 mm.
Correction for attenuation was based on a transmission scan. The dynamic PET data were decay-
corrected to the scan start.
Radiochemistry, blood chemistry, and metabolite analysis
[N-methyl-
11
C]Mirtazapine was prepared from (±)-N-desmethyl mirtazapine (Z)-2-butenedioate,
and analytical high-performance liquid chromatography [HPLC], determination of radiochemical
purity, and product identity were done as described elsewhere [9, 11]. Thirty-five blood samples
(18 × 10 s, 4 × 30 s, 5 × 1 min, 7 × 5 min, 1 × 15 min) were obtained manually from an
antecubital artery and were decay-corrected to the scan start. The fraction of unchanged [N-
methyl-
11
C]mirtazapine in the plasma was determined with radiodetection by integration of the
peak corresponding to the radiopharmaceutical identity and was expressed as a percentage of the
total of all radioanalytes recovered by HPLC. Seven radiochemical fractionations of extracts of
plasma samples were measured at 1, 2.5, 5, 15, 25, 40, and 60 min. A double-exponential
function was fitted to these measurements and was used to estimate the continuous time-course of
3
the radiochemical fractions of [N-methyl-
11
C]mirtazapine needed to calculate the metabolite-
corrected arterial input function.
Image analysis
The data of the dynamic [N-methyl-
11
C]mirtazapine scan were summed for each subject, and
each summed image was coregistered automatically using a software based on the medical image
NetCDF [MINC] programming package developed at the Montreal Neurological Institute [MNI].
Briefly, the summed PET scans were converted into the MINC format and were linearly
registered to the MNI/International Consortium for Brain Mapping [ICBM] 152 T1 brain
template [12]. The transforms were concatenated to produce the transformation used for bringing
the dynamic PET images into the MNI/ICBM 152 common standardized space.
Representative regions of interest were obtained automatically from each subject's data by a
custom-made software and a segmented atlas of the human brain [13]. Time-activity curves
[TACs] were generated from the dynamic PET study for five regions: the cerebellum (region 1),
striatum (region 2), hippocampus (region 3), frontal lobe (region 4), and thalamus (region 5).
Kinetic analyses
Time-activity curves for each subject were analyzed using six kinetic methods: (A) single-tissue
compartment model with uncorrected and metabolite-corrected arterial plasma input functions,
(B) two-tissue compartment model with uncorrected and metabolite-corrected arterial plasma
input functions, (C) graphical plasma input model with metabolite-corrected arterial plasma input
function [14], (D) graphical reference tissue model with a cerebellum TAC [15], (E) reference
tissue model with a cerebellum TAC [16], and (F) simplified reference tissue model with a
cerebellum TAC [17]. Methods A and B use metabolite-corrected arterial plasma curves as input
function to the kinetic model, and uncorrected arterial plasma curve including metabolites for the
blood volume. The reference tissue models, namely methods D, E, and F, use a cerebellum TAC
instead of plasma input functions and do not require blood sampling. Method D can be applied
with or without a k
2
correction [15]; we excluded the correction to maintain a linear method
without assumptions about the k
2
values.
All models can be described in terms of microparameters: K
1
(ml ml
−1
min
−1
) denotes the influx
rate constant of the parent compound from the plasma to the free tissue compartment; k
2
(min
−1
)
is the rate constant of transfer from the free to the plasma compartment; k
3
(min
−1
) is the rate
constant for transfer from the free to the bound compartment; k
4
(min
−1
) is the rate constant for
transfer from the bound to the free compartment; and V
0
(ml ml
−1
) is the fractional blood volume
in the brain. In methods A and B, we assumed a fixed fractional blood volume of 7% [18].
Estimates of microparameters may be uncertain due to noise. However, data analyses of receptor
studies focus on physiologic macroparameters, such as distribution volumes [V
T
] (the ratio at
equilibrium of the tracer concentration in the tissue to that in the plasma) and binding potentials
[BP
ND
] (the ratio at equilibrium of a specifically bound tracer to that of a non-displaceable tracer
in the tissue), which are more stable and can be derived in terms of the microparameters. Method
A provides estimates of the distribution volumes (V
T
= K
1
/k
2
). In addition, indirect estimates of
binding potentials were calculated for the binding regions by relating fitted values for the
distribution volume in the binding region to that of the reference region, assuming that
distribution volume of the non-displaceable compartment [V
ND
] in the receptor-deficient
reference region and in the receptor-rich binding region are equal:
(
)
ND T ND ND
BP /
V V V
= − . (1)
Method B provides estimates of the distribution volumes (V
T
= (K
1
/k
2
) (1 + k
3
/k
4
)) and binding
potentials (BP
ND
= k
3
/k
4
). Method C provides estimates of V
T
as the slope of a linear regression to
4
the late linear part of the Logan representation. For method C, BP
ND
can be indirectly calculated
according to Equation 1. Method D provides estimates of the distribution volume ratio V
T
/V
ND
as
the slope of a linear regression from which the binding potential (BP
ND
= V
T
/V
ND
− 1) is derived
(Equation 1). Methods E and F directly include BP
ND
= k
3
/k
4
as a model parameter.
It has been shown for neuroreceptor modeling that weights should not be based on noisy TACs
and that uniform weighting is recommended if nothing is known about the noise of the
measurements [19]. We tested two simple weighting schemes by comparing kinetic parameters
estimated by nonlinear regression with uniform weighting and with weighting by frame duration.
Goodness-of-fit was measured by the Akaike criterion [20]. Parameter estimates may fluctuate
considerably when fitted by the nonlinear methods A, B, E, and F. We report the best fits and
their corresponding parameter estimates that represent the best mathematical representation of the
data as found by an automatic optimization routine [21]. For noisy data, the resulting parameters
can depend on the initial guess due to local minima, which may be unphysiologic and even
include negative microparameters that are not compatible with the kinetic model. In these cases,
the data analysis is less straightforward since quality control of the fits is needed. In this study,
our only exclusion criterion was the negative parameters, and those fits were remade with a
different initial guess. Otherwise, we report parameters from the fits that yielded the lowest
Akaike value. Except for the non-negativity constraint, we did not introduce subjective upper or
lower limits for parameter estimates. In reality, we only had problems with local minima when
using Method B that led to estimates of k
3
and k
4
that were particularly unreliable; its sensitivity
to noise was systematically dealt with by making 20 fits using randomized initial guesses and
reporting the parameters from the fit with the lowest Akaike value with non-negative parameters.
For the other methods, we would get the same physiologically reasonable parameter estimates
using any reasonable initial guess. Thus, the extensive procedure using 20 fits was not necessary
for the other methods.
We used nonparametric tests (chi-square test, Kruskal-Wallis H test, Mann-Whitney U test, and
Spearman's rho) with Bonferroni correction for multiple comparisons for determining the
statistical significance of the results.
Results
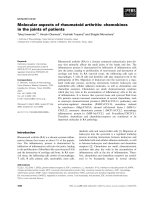
Figure 2 shows time-radioactivity curves for [N-methyl-
11
C]mirtazapine in the bloodstream and
the brain. Considerable amounts of unmetabolized [N-methyl-
11
C]mirtazapine remained in the
bloodstream throughout the scan, with 30% to 60% of the radioactivity in the bloodstream arising
from unmetabolized [N-methyl-
11
C]mirtazapine at a 25-min postinjection and 20% to 40% of
[
11
C]-derived radioactivity stemming from an unmetabolized parent compound at the end of the
60-min scan. The range of values of [N-methyl-
11
C]mirtazapine in the bloodstream tended to
increase with time, perhaps due partly to uncertainties in detecting the compound as radioactivity
gradually declined.
Table 1 shows the distribution volume of [N-methyl-
11
C]mirtazapine estimated by methods A, B,
and C. Statistical analysis of the data indicated that the weighting procedure failed to significantly
affect the estimates of distribution volumes (Mann-Whitney U two-tailed test, p = 0.85), so the
data obtained with and without weighting were pooled and used subsequently. Since the two-
tissue compartment model sometimes produced negative values for kinetic parameters, additional
fits were made in order to always obtain a positive estimate of the distribution volume of [N-
methyl-
11
C]mirtazapine. Despite that procedure, the statistical analysis confirmed that the
estimates of distribution volumes provided by the three methods differed significantly (χ
2
= 24.4,
df = 2, p = 0.001), and the table shows that the two-tissue compartmental model produced higher
and more variable values than those provided by methods A and C.
5
Table 2 shows estimates of the binding potentials of [N-methyl-
11
C]mirtazapine obtained by the
six methods. The weighting procedure failed to significantly affect the estimates of binding
potentials (Mann-Whitney U two-tailed test, p = 0.68), so the data obtained with and without
weighting were pooled for each method and used for subsequent statistical tests. The statistical
analysis confirmed that the estimates of binding potentials of [N-methyl-
11
C]mirtazapine
provided by the six methods differed significantly (χ
2
= 64.4, df = 5, p < 0.001), and it is evident
from the table that the values obtained by the two-tissue compartment model differed markedly
from those provided by the other methods.
Table 3 compares the values for the binding potentials of [N-methyl-
11
C]mirtazapine obtained by
pairs of methods. The statistical analysis showed that the values obtained by the two-tissue
compartment model (i.e., method B) were significantly higher than those obtained by each of the
other methods. Moreover, the graphical reference tissue model (i.e., method D) produced values
of the binding potential that were significantly lower than those obtained by the graphical plasma
input model, the reference tissue model, and the simplified reference tissue model (p values <
0.05), while the binding potential values obtained by the graphical plasma input method, the
reference tissue model, and the simplified reference tissue model did not differ significantly.
Table 4 presents correlations between the values for the binding potential of [N-methyl-
11
C]mirtazapine obtained by pairs of methods. The values obtained by the single-tissue
compartment model (i.e., method A) correlated significantly with those obtained by the graphical
plasma input model and the graphical reference tissue model (i.e., methods C and D,
respectively). In addition, the values obtained by the graphical plasma input model correlated
significantly with those obtained by the graphical reference tissue model and the simplified
reference tissue model. A reliable correlation also occurred between the reference tissue model
(method E) and the simplified reference tissue model (method F) for the binding potential values.
Table 5 compares Akaike values for fits of the data by methods A, B, E, and F, the methods that
use all data points for estimating the binding potential. The weighting procedure failed to affect
the Akaike values significantly although there was a tendency for weighing to reduce the Akaike
scores (Mann-Whitney U two-tailed test p = 0.08). The data obtained with and without weighting
were pooled for subsequent statistical tests. The Akaike values obtained by methods A, B, E, and
F differed significantly (mean ± s.e.m. 77 ± 3, 41 ± 6, 18 ± 5, and 23 ± 5, respectively; Kruskal-
Wallis H test, p < 0.001). Subsequent statistical analysis showed that the Akaike values obtained
by method A, the single-tissue compartment model, were significantly greater than those obtained
by the other three methods (p values < 0.05). On the other hand, the Akaike values provided by
the reference tissue model (method E) were significantly smaller than the scores obtained by the
two-tissue compartment model (method B) (p < 0.05).
Discussion
Central actions of psychotropic drugs continue to be of interest in PET brain imaging [22-24].
Our work shows that mirtazapine, an effective antidepressant drug, has favorable properties for
PET brain imaging when the compound is radiolabeled with
11
C in the N-methyl position [10, 25-
26]. As far as we know, [N-methyl-
11
C]mirtazapine is the only radioligand of a popular
antidepressant drug that is suitable for PET imaging of the brain in humans. We realize, of
course, that mirtazapine affects multiple receptor systems, including alpha-adrenergic, histamine
type 1, and serotonin type 2 [5, 27, 28] receptors. Some may view the lack of receptor specificity
of [N-methyl-
11
C]mirtazapine as a disadvantage for PET neuroimaging, whereas we view the
radioligand as a potential screening device for assessing multireceptor disorders in the living
human brain.
Several methods are currently in use for studying the pharmacokinetics of PET radioligands [29-
30]. Of particular interest for the present report are methods requiring no arterial cannulation.
6
We have, therefore, compared kinetic models, with and without the requirement of arterial
cannulation, for estimating the distribution volume and binding potential of [N-methyl-
11
C]mirtazapine in the living human brain. In a previous study, we used method A, the single-
tissue compartment model with arterial cannulation, for assessing the pharmacokinetics of the
radiotracer. That method has few parameters and typically provides stable fits with reproducible
estimates of parameters. However, some volunteers experienced pain at the site of cannulation. In
addition, the relatively high Akaike scores found for that method indicate that the single-tissue
compartment model may oversimplify the dynamics of [N-methyl-11C]mirtazapine data, perhaps
resulting in biased estimates of parameters. The values for the binding potential of [N-methyl-
11
C]mirtazapine obtained by method A were, for instance, markedly lower than those obtained by
the other nonlinear methods assessed in the present study (i.e., methods B, E, and F). Moreover,
the estimates of binding potentials were poorly correlated to those of the other nonlinear methods.
The two-tissue compartment model, method B, provided better fits than method A of the PET
data for [N-methyl-
11
C]mirtazapine, judging from Akaike scores. The fits of method B were,
however, highly sensitive to the initial guess and often had to be redone in order to obtain non-
negative estimates of parameters. Furthermore, the microparameters k
3
and k
4
were poorly
determined by method B, which lead to variable estimates of V
T
and BP
ND
that differed markedly
from the values obtained with other methods. This lack of robustness of method B limits its use
for modeling of the [N-methyl-
11
C]mirtazapine data. It is noteworthy, however, that method B
described the data very well, judging from Akaike values, which suggests that at least two-tissue
compartments are kinetically distinguishable for [N-methyl-
11
C]mirtazapine, namely free and
specifically-bound ligand, assuming that the free and nonspecifically bound compartments reach
equilibrium rapidly. One could speculate that a slower, nonspecific component of binding might
also be present using a third compartment for the radioligand, but we did not examine that model
in the present study, in part due to uncertainties that can arise from an excessive number of
parameters.
The graphical linear models, methods C and D, provide estimates of macroparameters that are
independent of the underlying compartment scheme. We found that the values of binding
potentials provided by methods C and D were reliably correlated. In addition, BP
ND
estimates
using method C were similar to those obtained by the nonlinear reference region methods E and
F. In contrast, method D provided BP
ND
values that were markedly lower than those obtained
with methods C, E, and F, and the estimates of binding potential provided by method D were not
reliably correlated to those obtained using methods E and F. Thus, the estimates of BP
ND
provided by method C corresponded better than those of method D to BP
ND
values of [N-methyl-
11
C]mirtazapine obtained by the nonlinear methods. However, several factors affect BP
ND
values
obtained by the standard implementations of methods C and D used in the present study [14-15,
31]. Firstly, exclusion of vascular volume in method C causes distribution volumes to be
overestimated and binding potentials to be underestimated, although the bias may be small [14].
In accordance with that, we found in supplementary studies that the effect was of minor
importance for [N-methyl-
11
C]mirtazapine, being less than 3%. Secondly, exclusion of the k
2
-
correction term for method D can cause underestimation of the V
T
ratio [15], and noisy data can
cause slopes to be underestimated by both methods [31]. Thirdly, because methods C and D
involve fitting of the slope of the linear part of the Logan plot, curvature of the plot throughout
the duration of scanning impairs the estimation of the binding potential (see Figure 3). Since the
binding of [N-methyl-
11
C]mirtazapine may be relatively slow in some brain regions, methods C
and D may have underestimated the distribution volumes and binding potentials in such regions
under the conditions of the present study. Perhaps lengthening the duration of the scanning
interval could minimize this potential source-of-error so that methods C and D could be used
routinely for estimating the binding potential of [N-methyl-
11
C]mirtazapine.
7
The reference tissue model (method E) and the simplified reference tissue model (method F) are
nonlinear procedures that rely on the entire data set. The BP
ND
values obtained by the two
methods were reliably correlated and did not differ significantly. The present findings show that
methods E and F described the data better than methods A and B, judging from Akaike scores.
This could be partly due to the variance inherent in the analysis over time of rapidly decaying
radionuclides in the bloodstream.
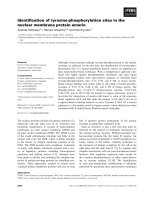
Methods E and F use the cerebellum as a tissue-reference region for the indirect input function of
[N-methyl-
11
C]mirtazapine, based on previous findings [9]. The present findings show, however,
that [N-methyl-
11
C]mirtazapine in the cerebellum may be described by two compartments (see
Figure 4): a free compartment and a small compartment of nonspecific binding. If two
compartments are present for [N-methyl-
11
C]mirtazapine in the cerebellum, then methods E and F
may underestimate the binding potential of the radioligand [16]. Unlike method E, method F
requires that rates of exchange between the free, possibly nonspecific, and specific compartments
are so fast that they are kinetically indistinguishable [17]. That assumption may be incorrect for
[N-methyl-
11
C]mirtazapine because multiple components may have been identified by methods A
and B (see Figure 3), making method F less appropriate than method E for estimating regional
binding potentials in the living human brain.
In this paper, we have compared estimates of kinetic parameters using [N-methyl-
11
C]mirtazapine
data in a homogenous group of volunteers. Six models were evaluated based on their robustness
and by statistical comparisons of their parameter estimates and ability to describe data. In a future
work, a comparison study between different groups of subjects could be used to further validate
the parameter estimates and the model selection.
Conclusions
Taken together, the present findings indicate that the reference tissue model is appropriate for use
in PET imaging for obtaining estimates of pharmacokinetic parameters, such as the binding
potentials of [N-methyl-
11
C]mirtazapine in regions of the living human brain. Since that method
does not depend on metabolite-corrected plasma input functions, we conclude that the binding
potentials of [N-methyl-
11
C]mirtazapine in brain regions can be estimated without arterial
cannulation by PET in humans.
A shortcoming of the present study concerns complications that can arise in the kinetic analysis
of compounds studied as racemates [32]. However, the enantiomers of [N-methyl-
11
C]mirtazapine failed to show marked differences in the binding kinetics in laboratory animals
and healthy humans [26, 33]. We conclude, therefore, that analysis of PET data using the
reference tissue model for racemic [N-methyl-
11
C]mirtazapine can provide insight into
antidepressant actions that cannot otherwise be studied in the living human brain.
Competing interests
The authors declare that they have no competing interests.
Authors' contributions
OLM implemented the kinetic models and performed the kinetic analyses. DFS performed the
experiments and statistical analyses. Both authors wrote and approved the final manuscript.
Acknowledgments
No commercial interests are associated with this project. We thank N.V. Organon for kindly
supplying samples of mirtazapine and N-desmethyl mirtazapine, the bioanalysts and technicians
at the PET Center of Aarhus University Hospital for their skillful assistance, Anders, Yoshitaka,
and Pedro for the computer support, and Katalin Marthi for all kinds of help. The following
8
organizations provided the financial support: Fonden af 17-12-1981, Wørzner's Mindelegat,
Fonden til Psykiatriens Fremme, Pulje til Styrkelse af Psykiatrisk Forskning, Fonden til
Lægevidenskabens Fremme, and the Danish Medical Research Council.
References
1. Benjamin S, Doraiswamy PM: Review of the use of mirtazapine in the treatment of
depression. Expert Opin Pharmacother 2011, 12:1623-1632.
2. Croom KF, Perry CM, Plosker GL: Mirtazapine: a review of its use in major depression
and other psychiatric disorders. CNS Drugs 2009, 23:427-452.
3. Montgomery SA, Baldwin DS, Blier P, Fineberg NA, Kasper S, Lader M, Lam RW, Lepine
JP, Moller HJ, Nutt DJ, Rouillon F, Schatzberg AF, Thase ME: Which antidepressants
have demonstrated superior efficacy? A review of the evidence. Int Clin
Psychopharmacol 2007, 22:323-329.
4. Watanabe N, Omori IM, Nakagawa A, Cipriani A, Barbui C, McGuire H, Churchill R,
Furukawa TA: Mirtazapine versus other antidepressants in the acute-phase treatment
of adults with major depression: systematic review and meta-analysis. J Clin
Psychiatry 2008, 69:1404-1415.
5. Millan MJ, Gobert A, Rivet JM, Adhumeau-Auclair A, Cussac D, Newman-Tancredi A,
Dekeyne A, Nicolas JP, Lejeune F: Mirtazapine enhances frontocortical dopaminergic
and corticolimbic adrenergic, but not serotonergic, transmission by blockade of
alpha2-adrenergic and serotonin2C receptors: a comparison with citalopram. Eur J
Neurosci 2000, 12:1079-1095.
6. Timmer CJ, Paanakker JE, van Hal HJM: Pharmacokinetics of mirtazapine from orally
administered tablets: influence of gender, age and treatment regimen. Human
psychopharmacol 1996, 11:497-509.
7. Lammertsma AA: Radioligand studies: imaging and quantitative analysis. Eur
Neuropsychopharmacol 2002, 12:513-516.
8. Smith DF, Dyve S, Minuzzi L, Jakobsen S, Munk OL, Marthi K, Cumming P: Inhibition of
[11C]mirtazapine binding by alpha2-adrenoceptor antagonists studied by positron
emission tomography in living porcine brain. Synapse 2006, 59:463-471.
9. Marthi K, Bender D, Gjedde A, Smith D: [11C]Mirtazapine for PET neuroimaging:
radiosynthesis and initial evaluation in the living porcine brain. Eur
Neuropsychopharmacol 2002, 12:427-432.
10. Smith DF, Stork BS, Wegener G, Jakobsen S, Bender D, Audrain H, Jensen SB, Hansen SB,
Rodell A, Rosenberg R: Receptor occupancy of mirtazapine determined by PET in
healthy volunteers. Psychopharmacology (Berl) 2007, 195:131-138.
11. Marthi K, Hansen SB, Jakobsen S, Bender D, Smith SB, Smith DF: Biodistribution and
radiation dosimetry of [N-methyl-11C]mirtazapine, an antidepressant affecting
adrenoceptors. Appl Radiat Isot 2003, 59:175-179.
12. Collins DL, Neelin P, Peter TM, Evans AC: Automatic 3D intersubject registration of MR
volumetric data in standardized Talairach space. J Comput Assist Tomogr 1994, 18:192-
205.
13. Kabani N, MacDonald D, Holmes C, Evans AC: 3D anatomical atlas of the human brain.
NeuroImage 1998, 7:S717.
14. Logan J, Fowler JS, Volkow ND, Wolf AP, Dewey SL, Schlyer DJ, MacGregor RR,
Hitzemann R, Bendriem B, Gatley SJ, Christman DR: Graphical analysis of reversible
radioligand binding from time-activity measurements applied to [N-11C-methyl]-(-)-
cocaine PET studies in human subjects. J Cereb Blood Flow Metab 1990, 10:740-747.
15. Logan J, Fowler JS, Volkow ND, Wang GJ, Ding YS, Alexoff DL: Distribution volume
ratios without blood sampling from graphical analysis of PET data. J Cereb Blood
Flow Metab 1996, 16:834-840.
9
16. Lammertsma AA, Bench CJ, Hume SP, Osman S, Gunn K, Brooks DJ, Frackowiak RS:
Comparison of methods for analysis of clinical [11C]raclopride studies. J Cereb Blood
Flow Metab 1996, 16:42-52.
17. Lammertsma AA, Hume SP: Simplified reference tissue model for PET receptor studies.
NeuroImage 1996, 4:153-158.
18. Tomita M: Significance of cerebral blood volume. In Cerebral Hyperemia and Ischemia:
From the Standpoint of Cerebral Blood Volume. Edited by Tomita M, Sawada T, Naritomi
H, Heiss WD. Amsterdam: Elsevier Science Publishers BV; 1988:3-31.
19. Thiele F, Buchert R: Evaluation of non-uniform weighting in non-linear regression for
pharmacokinetic neuroreceptor modelling. Nucl Med Commun 2008, 29:179-88.
20. Akaike H: A new look at the statistical model identification. IEEE Trans Automat Control
1974, AC-19:716-723.
21. Marquardt DW: An algorithm for least-squares estimation of nonlinear parameters. J Soc
Ind Appl Math 1963, 11:431-441.
22. Meyer JH: Imaging the serotonin transporter during major depressive disorder and
antidepressant treatment. J Psychiatry Neurosci 2007, 32:86-102.
23. Zimmer L: Positron emission tomography neuroimaging for a better understanding of
the biology of ADHD. Neuropharmacology 2009, 57:601-607.
24. Smith DF, Jakobsen S: Molecular tools for assessing human depression by positron
emission tomography. Eur Neuropsychopharmacol 2009, 19:611-628.
25. Smith DF, Stork BS, Wegener G, Ashkanian M, Jakobsen S, Bender D, Audrain H, Vase KH,
Hansen SB, Videbech P, Rosenberg R: [11C]Mirtazapine binding in depressed
antidepressant nonresponders studied by PET neuroimaging. Psychopharmacology
(Berl) 2009, 206:133-140.
26. Smith DF, Hansen SB, Jakobsen S, Bender D, Audrain H, Ashkanian M, Stork BS, Minuzzi
L, Hall H, Rosenberg R: Neuroimaging of mirtazapine enantiomers in humans.
Psychopharmacology (Berl) 2008, 200:273-279.
27. Millan MJ. Multi-target strategies for the improved treatment of depressive states:
conceptual foundations and neuronal substrates, drug discovery and therapeutic
application. Pharmacol Ther 2006, 110:135-370.
28. Millan MJ. Dual- and triple-acting agents for treating core and co-morbid symptoms of
major depression: novel concepts, new drugs. Neurotherapeutics 2009, 6:53-77.
29. Talbot PS, Laruelle M: The role of in vivo molecular imaging with PET and SPECT in
the elucidation of psychiatric drug action and new drug development. Eur
Neuropsychopharmacol 2002, 12:503-511.
30. Ichise M, Liow JS, Lu JQ, Takano A, Model K, Toyama H, Suhara T, Suzuki K, Innis RB,
Carson RE: Linearized reference tissue parametric imaging methods: application to
[11C]DASB positron emission tomography studies of the serotonin transporter in
human brain. J Cereb Blood Flow Metab 2003, 23:1096-1112.
31. Logan J, Fowler JS, Volkow ND, Ding YS, Wang GJ, Alexoff DL: A strategy for removing
the bias in the graphical analysis method. J Cereb Blood Flow Metab 2001, 21:307-320.
32. Smith DF, Jakobsen S: Stereoselective neuroimaging in vivo. Eur Neuropsychopharmacol
2007, 17:507-522.
33. Smith DF, Marthi K, Munk OL, Cumming P, Hansen SB, Jakobsen S: PET neuroimaging of
[11C]mirtazapine enantiomers in pigs. Eur Neuropsychopharmacol 2006, 16:350-357.
10
Figure 1. Structure of [N-methyl-
11
C]mirtazapine.
Figure 2. Time-radioactivity curves for [N-methyl-
11
C]mirtazapine in the bloodstream and
the brain. (A) Percentage of [
11
C]-derived radioactivity corresponding to the unmetabolized [N-
methyl-
11
C]mirtazapine in the bloodstream of each subject after intravenous injection. The five
symbols correspond to the five subjects. (B) Decay-corrected time-radioactivity curves for
[
11
C]mirtazapine in the plasma after intravenous bolus injection in one subject. (C) Decay-
corrected time-activity curves for [
11
C]mirtazapine in brain regions in one subject.
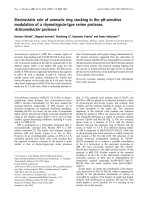
Figure 3. Decay-corrected time-radioactivity curves for [N-methyl-
11
C]mirtazapine in the
thalamus and hippocampus fitted by method D. Method D is the graphical reference tissue
model. Note in the Logan representation that the data of the thalamus become linear within 60
min, whereas the data of the hippocampus exhibit a curvature for a longer time.
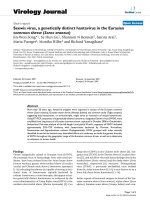
Figure 4. Decay-corrected time-radioactivity curve for [N-methyl-
11
C]mirtazapine in the
cerebellum of a single subject. Note that the data are fitted better by method B (two-tissue
compartment model; Akaike score, 31.8) than by method A (single-tissue compartment model;
Akaike score, 46.1).
11
Table 1. Distribution volume of [N-methyl-
11
C]mirtazapine estimated using three methods
Subject Method Region
1 2 3 4 5
1 6.3 7.9 5.4 6.6 6.5
2 9.0 11.2 9.6 10.2 10.2
3 11.9 14.1 10.7 13.3 11.7
4 8.6 10.6 10.5 9.8 10.3
A
5 8.8 10.8 9.1 10.1 9.4
1 297.9 7.9 5.4 8.6 7.2
2 25.2 11.6 9.7 33.4 18.3
3 187.1 14.1 10.9 39.1 14.0
4 26.5 34.3 11.0 31.6 17.3
B
5 19.2 10.8 9.2 169.5 39.9
1 7.7 7.7 5.2 9.0 6.9
2 11.9 11.4 9.6 14.2 11.8
3 17.8 15.0 10.6 25.9 13.4
4 13.8 11.7 11.4 18.5 13.1
C
5 10.8 10.4 8.9 13.7 10.2
Method A is the single-tissue compartment model with uncorrected and metabolite-corrected arterial plasma input functions. Method B is
the two-tissue compartment model with uncorrected and metabolite-corrected arterial plasma input functions. Method C is the graphical
plasma input model with metabolite-corrected arterial plasma input function. Region 1 is the cerebellum, region 2 is the striatum, region 3
is the hippocampus, region 4 is the frontal lobe, and region 5 is the thalamus.
12
Table 2. Binding potential of [N-methyl-
11
C]mirtazapine estimated using six methods
Subject Method Region
1 2 3 4 5
2 0.44 0.41 0.78 0.54 0.56
3 0.99 0.78 0.99 1.00 0.80
4 0.36 0.34 0.94 0.47 0.57
A
5 0.40 0.36 0.69 0.51 0.44
2 2.94 0.35 34.3 3.58 1.34
3 26.1 5.71 23.4 4.53 0.98
4 4.90 3.72 11.3 5.22 1.90
B
5 1.74 0.25 10.0 21.6 3.77
2 0.55 0.47 0.83 0.58 0.70
3 1.32 0.94 1.04 1.89 0.93
4 0.81 0.51 1.17 1.06 0.88
C
5 0.41 0.34 0.70 0.53 0.46
2 0.42 0.35 0.77 0.48 0.57
3 0.78 0.61 0.91 0.88 0.72
4 0.38 0.27 0.98 0.43 0.59
D
5 0.38 0.29 0.69 0.45 0.43
2 0.52 1.16 0.91 0.61 0.66
3 1.28 1.53 1.07 1.15 0.98
4 1.01 2.18 1.79 0.79 1.62
E
5 0.38 0.32 0.72 0.45 0.45
2 0.51 0.85 0.99 0.56 0.97
3 1.10 1.06 1.32 1.14 1.05
4 1.58 2.67 3.11 1.08 2.85
F
5 0.39 0.32 0.82 0.47 0.45
Method A is the single-tissue compartment model with uncorrected and metabolite-corrected arterial plasma input functions. Method B is
the two-tissue compartment model with uncorrected and metabolite-corrected arterial plasma input functions. Method C is the graphical
plasma input model with metabolite-corrected arterial plasma input function. Method D is the graphical reference tissue model with a
cerebellum time-activity curve. Method E is the reference tissue model with a cerebellum time-activity curve. Method F is the simplified
reference tissue model with a cerebellum time-activity curve. Region 2 is the striatum, region 3 is the hippocampus, region 4 the is frontal
lobe, and region 5 is the thalamus.
13
Table 3. Comparisons of binding potentials of [N-methyl-
11
C]mirtazapine estimated by six methods
Method
a
B C D E F
A 5.3* 2.5 0.9 3.5* 3.9*
B 4.7* 5.5* 4.1* 3.7*
C 3.2* 1.4 2.0
D 4.0* 4.4*
E 0.6
a
See the legend of Table 2 for a description of the methods. The nonparametric statistical comparison (z-scores) in the table denotes the
degree of difference between the binding potential values provided by the methods; *the binding potentials obtained by the two methods
differed significantly (two-tailed tests, Bonferroni correction for multiple comparisons, p < 0.0016).
Table 4. Correlations between binding potentials of [N-methyl-
11
C]mirtazapine obtained by six methods
Method
a
B C D E F
A 0.52 0.83* 0.98* 0.39 0.42
B 0.56 0.60 0.27 0.35
C 0.83* 0.60 0.72*
D 0.38 0.45
E 0.90*
a
See the legend of Table 2 for a description of the methods. The nonparametric Rho scores in the table denote the correlation between the
binding potential values provided by the methods; *statistically significant correlations (two-tailed tests, Bonferroni correction for multiple
comparisons, p < 0.0016).
Table 5. Comparisons of Akaike values for nonlinear fits of [N-methyl-
11
C]mirtazapine-PET data
Method
a
B E F
A 4.7* 6.9* 7.1*
B 2.9* 2.5
E 0.5
a
See the legend of Table 2 for a description of the methods. The nonparametric statistical comparison (z-scores) in the table reflects the
degree of difference between the binding potential values provided by the methods being compared. *Akaike values obtained by the two
methods differed significantly (two-tailed tests, Bonferroni correction for multiple comparisons, p < 0.0042). A nonsignificant z-score
indicates that the Akaike values provided by the two methods did not differ reliably.
N
N
N
C
11
H
3
Figure 1
a)
b)
c)
T
ime (min)
0 10 20 30 40 50 60
[N-
methyl-
11
C] Mirtazapine (% unmetabolized)
0
20
40
60
80
100
Time
(min)
0 10 20 30 40 50 60
Activity
concentration (kBq mL
-1
)
0
5
10
15
20
25
Uncorre
cted plasma
Met
abolite-corrected plasma
Time (min)
0 10 20 30 40 50 60
Activity
concentration (kBq mL
-1
)
0
2
4
6
8
10
12
14
Cer
ebellum
S
triatum
Hippocampus
Frontal
lobe
Thalamus
Figure 2
0 10 20 30 40 50 60
Activity concentration (kBq mL
-1
)
0
5
10
15
20
1-comp model
2-comp model
Cerebellum
Figure 4