Báo cáo sinh học: " Impact of changes in diet on the availability of land, energy demand and greenhouse gas emissions of agriculture" pot
Bạn đang xem bản rút gọn của tài liệu. Xem và tải ngay bản đầy đủ của tài liệu tại đây (274.58 KB, 27 trang )
This Provisional PDF corresponds to the article as it appeared upon acceptance. Fully formatted
PDF and full text (HTML) versions will be made available soon.
Impact of changes in diet on the availability of land, energy demand and
greenhouse gas emissions of agriculture
Energy, Sustainability and Society 2011, 1:6 doi:10.1186/2192-0567-1-6
Karin Fazeni ()
Horst Steinmueller ()
ISSN 2192-0567
Article type Original
Submission date 10 November 2011
Acceptance date 9 December 2011
Publication date 9 December 2011
Article URL />This peer-reviewed article was published immediately upon acceptance. It can be downloaded,
printed and distributed freely for any purposes (see copyright notice below).
For information about publishing your research in Energy, Sustainability and Society go to
/>For information about other SpringerOpen publications go to
Energy, Sustainability and
Society
© 2011 Fazeni and Steinmueller ; licensee Springer.
This is an open access article distributed under the terms of the Creative Commons Attribution License ( />which permits unrestricted use, distribution, and reproduction in any medium, provided the original work is properly cited.
1
Impact of changes in diet on the availability of land, energy
demand, and greenhouse gas emissions of agriculture
Karin Fazeni*
1
and Horst Steinmüller
1
1
Energy Institute at the Johannes Kepler University (JKU Linz), Altenbergerstrasse, 69,
Linz, 4040, Austria
∗Corresponding author:
Email addresses:
KF:
HS:
2
Abstract
Background: Recent scientific investigations have revealed a correlation between
nutrition habits and the environmental impacts of agriculture. So, it is obviously
worthwhile to study what effects a change in diet has on land use patterns, energy
demand, and greenhouse gas emissions of agricultural production. This study calculates
the amount of energy and emission savings as well as changes in land use that would
result from different scenarios underlying a change in diet.
Methods: Based on the healthy eating recommendations of the German Nutrition
Society, meat consumption in Austria should decrease by about 60%, and consumption of
fruits and vegetables has to increase strongly.
Results: This investigation showed that compliance with healthy eating guidelines leads
to lower energy demand and a decrease in greenhouse gas emissions, largely due to a
decrease in livestock numbers. Furthermore, arable land and grassland no longer needed
for animal feed production becomes redundant and can possibly be used for the
production of raw materials for renewable energy. The scenario examination shows that
in the self-sufficiency scenario and in the import/export scenario, up to 443,100 ha and
about 208,800 ha, respectively, of arable land and grassland are released for non-food
uses. The cumulative energy demand of agriculture is lower by up to 38%, and the
greenhouse gas emissions from agriculture decrease by up to 37% in these scenarios as
against the reference situation.
Conclusion: The land use patterns for the scenario demonstrate that animal feed
production still takes up the largest share of agricultural land even though the extent of
animal husbandry decreased considerably in the scenarios.
Keywords: diet; agriculture; energy.
Introduction
Agriculture has various impacts on the environment. One of the most obvious impacts is
the emission of methane [CH
4
], nitrous oxide [N
2
O], and other greenhouse gases from
ruminant animals and manure management, the application of mineral and organic
fertilizers [1], and soil management practices [2, 3]. These greenhouse gas emissions
contribute significantly to climate change in line with their global warming potential [1].
In addition, agriculture also contributes to emissions by the consumption of energy, both
directly, in the operation and maintenance of plant and machinery used to cultivate
cropland and maintain livestock housing, and indirectly, in the form of manufactured
mineral fertilizers and pesticides. The level of energy consumption and greenhouse gas
emissions depends on the production system, for example, whether organic or not, and on
the product mix, i.e., the mix of crops and livestock. It has been shown that organic
farming consumes less energy and contributes less to greenhouse gas emissions than
conventional agriculture because of the abandonment of fossil-fuel-derived nitrogen and
synthetic pesticides [4-11]. Besides the approach to input use, soil management practices,
3
such as tillage, irrigation, use of cover crops [2] in cropping systems, and storage of
slurries and manures in livestock systems, also influence greenhouse gas emissions from
agriculture. In the context of choice of the cropping system, crop rotation has a strong
influence on emissions. For example, adapting crop rotations to include more perennial
crops, thereby avoiding use of bare and fallow land, reduces greenhouse gas emissions
from agriculture by accumulating soil carbon stocks [3]. Animal husbandry is recognized
to have higher energy consumption and therefore has more greenhouse gas emissions
than arable agriculture. In fact, 18% of the global greenhouse gas emissions stems from
livestock production, whereby CH
4
from enteric fermentation in ruminant animals is a
major contributor, followed by N
2
O and carbon dioxide [CO
2
] [12]. The high levels of
animal protein found in modern western diets does not only affect land use
a
, but is also a
significant driver of current levels of energy consumption and greenhouse gas emissions
of agriculture [4-5, 7-13]. The correlation between nutritional habits and emissions from
agriculture has already been shown in other studies with different geographical foci [14-
15].
The high land requirements of livestock production, coupled with a growing demand for
meat in developing countries, raise the specter of shortages of arable land over the next
few decades [16]. Indeed, some authors have also questioned whether it will be at all
possible to feed so many animals in the future [17]. In addition, there is a growing
demand for land for the production of renewable energy feedstocks [18]. As the markets
for crop feedstocks for bioenergy and biofuels grow [19], arable land is bound to be
reallocated to meet these new demands [19]. Demand for feedstock for bioenergy can
affect food supplies in two ways: first, by diverting land to the production of non-food
crops and second, by diverting food and feed crops to renewable energy uses. Both of
these outcomes constrain food and feed supply, and this in turn impacts on prices [20].
The years 2007 and 2008 witnessed very significant food price rises, which especially
affected the developing countries. One of the major factors for these price increases was
the demand for maize for bioethanol production. Although demand for biofuel feedstocks
is only one factor pushing food prices up, alongside droughts and bad harvests, biofuel
production exacerbated the situation [21]. Among experts, there is an agreement that
biofuels have an important role in reducing greenhouse gas emissions, and with energy
prices rising and public policies supporting their use, the demand for biofuels will
continue to grow. The challenge for governments is to find approaches that can
accommodate the competing demands of the food and biofuel sectors. One possible
future option is to make biofuels from a cellulosic feedstock which does not compete
with food production [22]. Another approach is to encourage a shift to a diet with less
meat intake [23]. Stehfest et al. [12] showed that land which becomes redundant because
of changed nutritional habits could possibly be used for energy crop production. Table 1
gives estimates of the area which currently might be used for renewable energy feedstock
production in Austria, together with a number of scenarios of land use change as modeled
in this study.
Both the correlation between the choice of diet, agricultural greenhouse gas emissions,
and energy consumption and the land use competition between food and energy crops
have already been discussed in past publications, e.g., [12, 17, 24-25]. A similar work by
4
Freyer and Weik [13] has been done for Austria. They found out that the CO
2
e emissions
related to a nutritional recommendation by the German Nutrition Society [DGE] are
about 1,031 kg per capita and year.
Although a good deal of research has been done on these topics, only a few studies, e.g.,
[12], have investigated the impacts of a change in diet on agricultural greenhouse gas
emissions, energy consumption, and land use in an integrated way for a whole country.
The present study addresses this deficit by analyzing the impacts of a change in diet on
land use, energy consumption, and the emissions of Austrian agriculture, together with
the potential for producing renewable energy feedstocks using redundant land. A major
aim of this work is to show the complex interactions between food demand, agriculture,
emissions, and renewable energy production.
Finally, we estimate how much renewable energy feedstocks may be produced in Austria
without competing with food production in the case of changed nutritional habits. This
approach also makes it possible to discuss whether changed nutritional habits are an
available future option to limit the extent of competition between food production and
renewable energy feedstock production. The results of this work may provide starting
points for an integrated policy addressing the diet of the population, agriculture, and
renewable energy production.
Materials and methods
The life cycle assessment [LCA] (EN ISO 14040:2006) approach was chosen to quantify
the cumulative energy demand [CED] of and the related greenhouse gas emissions from
the conventional agriculture in Austria. The LCA method seems to be appropriate for
reaching this goal because the CED and the corresponding emissions are an integrated
component of every LCA study [26].
There is no agreed standard for calculating energy balances in the context of agriculture,
with various approaches documented in the literature. In terms of analyzing the energetic
aspects of agro-ecosystems, a hierarchy of methods exists. The approach adopted for this
study is a mechanistic, technical one, where all energy inputs are traced into an
agricultural system as physical material flows [27]. The involvement of material flows
shows again that the application of the EN ISO 14040:2006 method for this work is
appropriate. As a method for measuring the energy demand of agriculture, CED was
chosen. The CED was developed in the 1980s and has played an important part in impact
assessment since the early development of LCA. Because CED aggregates all forms of
energy consumed over the whole life cycle including losses, it is a sum parameter, i.e., a
meaningful parameter used to quantify the primary energy demand of a system and its
upstream stages. CED is derived from inventory analysis, where mass and material flows
have to be known [28], so it does not depend on any assumptions and their associated
uncertainties made in impact assessment [29]. CED is also an appropriate yardstick for
comparing products [30] and scenarios [31-32]. According to EN ISO 14040:2006, LCA
is divided into four steps: goal and scope definition, inventory analysis, impact
assessment, and finally, interpretation. The approach taken in this study stops just short of
a full conventional LCA, but nevertheless, it consists of a life cycle inventory analysis
5
survey although an impact assessment is carried out for the impact categories, global
warming potential and CED. The impact assessment steps of characterizing and
classifying inventory results (EN ISO 14040:2006) are necessary to show the results in
CO
2
equivalent and the CED [33].
Employing the LCA method on the entire Austrian agricultural system posed some
difficulties because LCA methods developed for agriculture are mostly designed for use
at farm level [34]. Other agricultural LCA approaches are tailored to just a single
agricultural sector [35] or a single agricultural product [36-37]. Therefore, a manageable
approach had to be developed to employ the LCA method on the whole of Austrian
agriculture. As a result, to reduce complexity, Austrian agriculture is treated as a single
average farm. This average farm cultivates all Austrian farmland, grows all demanded
crops, and breeds all demanded animals. Crop rotation is determined by the current
pattern of crop cultivation, both in the reference case and in the scenario analysis. As a
consequence, the LCA can be thought of as being performed at the ‘notional’ farm level.
Methodology of energy accounting
Definition of the goal and scope for energy accounting in conventional agriculture in
Austria
In line with the goal definition and principles of LCA (ISO, 2006) and following the
approach taken by Hülsbergen et al. [38], the agricultural production process chain, i.e.,
all relevant upstream stages of agricultural production (such as the production of
fertilizers and pesticides and the upstream stages of energy supply), is taken into account
for current energy accounting. On the downstream side, the farm gate is treated as the
system boundary. So, transporting crops from the field to the farmyard takes place within
the system, but not transporting or processing beyond that point. This ensures the same
system boundary for animal husbandry and crop production. The construction and
maintenance of agricultural infrastructure such as farm buildings and machines are not
within the system boundaries. Other inputs not taken into account are solar energy used
by growing crops and energy inputs to human labor.
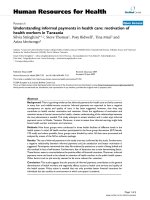
Figure 1 is a simplified diagram of the LCA system boundaries. The picture shows the
main inputs into the Austrian agricultural production system, consisting of mineral
fertilizers, organic fertilizers, pesticides, electricity, diesel fuel, thermal energy, and
animal feed from industry. The stages of processing the agricultural operating resources
are taken into account in the calculations. The CED of seeds is estimated as the CED
used for the part of current crop production that is retained for use as seeds in the next
cultivation period. In Austrian agriculture, seed retention ranges from 0.5% to 7%
depending on the crop. A transport process between field and farm takes place.
Cultivated crops and grass forages are brought from the field to the farm, where they are
either exported off the farm or fed to livestock. The animal products accounted for are
meat, milk, and eggs. The processing stages of food transport off the farm processing are
not taken into account.
6
Life cycle inventory analysis for Austrian agriculture
A life cycle inventory analysis characterizes the juxtaposition of the quantified inputs and
outputs [39] of agricultural production. In the present case, the inputs are fertilizer,
pesticides, animal feed, and energy; the outputs are the emissions involved in consuming
these factors of production. The software model Global Emission Model for Integrated
Systems [GEMIS] (Version GEMIS Austria 4.42-2007, Institut für angewandte Ökologie
e.V., Vienna, Austria) [40] was used to quantify the associated emissions and CED.
GEMIS comprises a lot of different agricultural processes including the correlation of
energy demands and CO
2
e emissions, describing both plant production and animal
production. Consequently, GEMIS makes it possible to take all relevant agricultural
processes into account, including energy demand and the associated emissions from
upstream stages such as mineral fertilizer and synthetic pesticide production. Not all
processes relevant to calculating the CED of Austrian agriculture were available in
GEMIS for carrying out process chain analysis; so, some processes had to be modeled,
and other processes had to be adapted to Austrian agricultural conditions. For adapting
the processes in GEMIS, special data on fertilizer and pesticide application as well as
data on the direct energy demand of Austrian agriculture had to be obtained. Data on
fertilizer and pesticide application were provided by the Austrian Association for
Agricultural Research. Details of the data set used and methods of data generation are
described in the literature [11]. For determining the average rates of fertilizer and
pesticide application in Austrian agriculture, guidelines published by the Austrian
Ministry of Agriculture were used. Other data, especially concerning the direct energy
consumption of agriculture, were obtained from the literature [41-46] and from
stakeholder interviews. For more details on this procedure and the data that were derived,
read about the study of Zessner et al. [47]. In GEMIS, a separate process exists for each
agricultural product. As a first step, the CED and emissions are calculated for each
agricultural product separately. As GEMIS outputs are denominated per ton of a specific
product, the outcome has to be multiplied by the whole production volume determined
for the baseline situation and for the scenarios. By this means, the CED and CO
2
e for the
whole Austrian production of a specific crop or animal product are calculated.
Aggregating these results yields the entire CED and greenhouse gas emissions for the
whole of Austrian agriculture.
Scenario definition and description
Scenario definition: common assumptions
Initially, it has to be clarified that the scenarios examined in this paper are retrospective.
By this means, uncertainties concerning future states of drivers of change such as
increasing technical efficiency, demographic changes in Austria, or developments in
agricultural policy are avoided. These influencing parameters stay constant vis-à-vis the
baseline period, i.e., the average of 2001 to 2006. As already stated, in all the scenarios
the impacts on the existing conventional agricultural system of changing nutritional
habits among the population of Austria are examined. The scenarios have been developed
on the assumption that only conventional farming methods are used [47].
7
For the purposes of scenario analysis (all scenarios), it is assumed that dietary change
involves the compliance of the Austrian population with the recommendations of the
DGE. Today, meat consumption in Austria exceeds the levels recommended in healthy
eating guidelines. According to the DGE recommendations, meat consumption of the
average Austrian inhabitant would need to decrease by about 60% of today's level of 57
kg per capita per year. This will result in a shift to more plant-based nutrition, with the
consumption of fruits and vegetables increasing by about 50% and 60%, respectively (for
a more detailed information, read more on the study of Zessner et al. [48]).
The DGE recommendations refer to specific product groups such as fruits. To calculate
the amount of food needed for the population of Austria in one year, the average
recommended daily or weekly intake of a specific food product was taken. Next, the
amounts of agricultural products, such as milk, eggs, cereals, and oil, needed to meet the
demand for healthy nutrition were determined. To calculate total agricultural production,
net food consumption was derived using correction factors for each food category. Net
food consumption determines how much livestock and arable land is needed to produce
all the agricultural goods in demand. Animal feed amounts were derived from the specific
animal feed demand per animal category. A distinction was made between ruminant
animals and monogastric animals. This calculation yielded the area of arable land and
grassland needed for animal feed production [47].
The starting point of each scenario is a change in diet among the population of Austria in
line with the DGE recommendations. This change in diet between the baseline situation
and the scenarios is presented in Table 2.
Agricultural production has to be adjusted to these changes in commodity demand. In the
case of meat consumption, it is assumed that consumption of all meats decreases to the
same extent. Although common healthy eating guidelines recommend eating more white
meat than red meat, this study assumes that the shares of the various sorts of meat stay
the same because people would still prefer red meat. The consumption and production of
alcoholic beverages are left unchanged because no commonly accepted recommendation
is available from nutrition scientists. As the efficiency of agricultural production is
assumed to be the same as in the baseline period, the same amount of resources is
consumed in producing a given product conventionally as in the baseline situation.
Agricultural production is not expanded to forest areas, and the amount of fallow land
cannot increase beyond the level observed in the baseline period [47].
In the import/export scenario, net imports change in proportion to the change in food and
animal feed demand in Austria. An exception is made in the case of saltwater fish
because it is assumed that there is no potential, in view of depleted fish stocks, to increase
the supply of fish from the world's oceans. The lack of omega-3 and omega-6 fatty acids
is made good with vegetable oils. In this scenario, exports stay at the same level as in the
baseline situation in absolute terms. Currently, about 26,000 t of meat and 361,700 t of
milk are exported per year, with most of the meat exported being beef [47]. Once the
main assumptions for the scenario definition have been settled, the different scenarios
and sub-scenarios examined in this work can be described.
8
The scenario development largely depends on the assumed self-sufficiency in agricultural
production. Even in the baseline situation, Austria is already close to self-sufficiency in
some agricultural goods. Self-sufficiency in grain in Austria was about 100% and self-
sufficiency in potatoes, about 96% in 2005/2006; self-sufficiency in meat in Austria was
about 106% and in milk, about 136% in the year 2006. Austria is much further from self-
sufficiency in oil seeds (59%), fruits (69%), and vegetables (57%). Where Austria is quite
close to self-sufficiency, the simplifying assumption is made that the country is 100%
self-sufficient in these products. Where full self-sufficiency in agricultural goods is
assumed, some consumption assumptions are also required. For example, because rice
plays a role in the diet of the average Austrian and because domestic rice cultivation is
not possible, in the scenario, modeling has to be replaced by other starchy foods such as
potatoes and cereals. Full self-sufficiency also means that the amount of fish
recommended by the DGE cannot be produced in Austria, so the Austrian population is
assumed to be supplied with omega-3 and omega-6 fatty acids in the form of linseed oil,
walnut oil, and rape seed oil. Again, in the full self-sufficiency scenario, tropical and
subtropical fruits are replaced by domestic fruits. The substitution was done in line with
the ratio of domestic fruit types actually consumed. For example, as apples have the
largest share of fruit consumption in Austria, most tropical and subtropical fruits are
replaced by apples [47].
In determining agricultural production, crop rotation constraints have to be taken into
account. In this case, the following crop rotation constraints were assumed for
conventional agriculture in Austria: the share of grains in crop rotation should be <65%;
the share of oil seeds, <25%; the share of legumes, <25%; and the share of root crops,
<50%. These constraints are crucial for determining the energy feedstock crops to be
produced in the various scenarios [47].
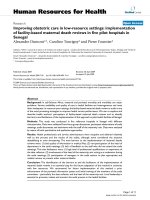
Using the assumptions outlined above, the following scenarios were developed [47] (see
Figure 2):
• ‘Self-sufficiency’ scenario. The central assumption in this scenario is that Austria
is 100% self-sufficient in agricultural goods. No agricultural products are
imported or exported.
• ‘Import/export’ scenario. In contrast to the self-sufficiency scenario, agricultural
goods are imported and exported in the import/export scenario. Exports stay at the
same level as in the baseline situation from 2001 to 2006. Imports are adapted to
the new demand pattern in Austria after the change in diet. These assumptions are
scenario constraints, not a market outcome.
For both the self-sufficiency scenario and the import/export scenario, the following sub-
scenarios are examined. In conclusion, six sub-scenarios are calculated.
• Sub-scenario a. In this sub-scenario, the agricultural production is limited to food
production. The production of renewable energy feedstocks is constant at the level
already produced in the baseline situation (2001 to 2006).
9
• Sub-scenario b. In addition to food production, agriculture produces renewable
raw materials for supplying itself with bioenergy and biofuels on released arable
land and grassland. Furthermore, biofuels for fulfilling the transport fuel
renewable obligation as per mandate of the European Parliament [49] are
produced.
• Sub-scenario c. This sub-scenario assumes maximum energy production from
agricultural raw materials based on first generation bioenergy and biofuel
technologies. The general assumption is that all the redundant agricultural land is
used for energy feedstock production.
Determining the production of renewable energy feedstocks in the sub-scenarios self-
sufficiency (a, b, and c) and import/export (a, b, and c)
One of the main outputs of this analysis is the quantity of renewable energy feedstocks
produced under the conditions of the various sub-scenarios. The volumes produced will
obviously be dependent on the area of land made available due to decreased meat
production. It was assumed that where arable land and grassland are released due to falls
in livestock production, this occurs evenly all over Austria. This assumption is necessary
because of uncertainties over the likely real world location of the land that was released.
It is assumed that this redundant grass is harvested as a feedstock for bioenergy
production.
Due to the necessity of crop rotation, oilseed (rape and sunflower) cultivation cannot be
expanded in any of the scenarios. The cultivation areas currently observed, 59,000 ha of
which is currently used to supply biodiesel feedstocks, are retained as upper constraints.
In the scenario analysis, it is assumed that any biodiesel produced is used only within
agriculture.
Free grassland and silage maize are used for biogas production. There are two different
technical options for the use of biogas for heat and electricity production. One option is
combined heat and power generation, and the other option is to feed upgraded biogas into
the natural gas grid for power generation in a large-scale gas-power station. A mix of
these two technologies is also possible.
In the case of bioethanol production, i.e., to meet the feedstock requirements of the
national bioethanol plant, a maize wheat ratio of 1:1 is assumed. As a result, based on
average yields, 52,000 ha of wheat and 25,000 ha of maize would be needed to meet the
demand.
Results
Because the baseline situation and scenario results that follow are derived from a process
chain analysis carried out by means of GEMIS, it is important to show how upstream
stages, such as fertilizer production, contribute to a single agricultural production process.
To facilitate this, the results are presented by the agricultural sector for each scenario and
also for the baseline situation.
10
The contribution of upstream processing stages to CO
2
e and CED
As mentioned above, CED has been chosen as the most appropriate measure to quantify
the energy and emission balance of Austrian agriculture in this study because it includes
all primary energy used throughout the life cycle. This measure permits the contribution
of upstream processing stages, such as fertilizer production, to CO
2
e emissions to be
estimated. Rather than try to estimate the emissions of all upstream processing, the
upstream contribution to wheat production was chosen as an exemplar for the
contribution of upstream production stages in general. Wheat was chosen due to its heavy
reliance on mineral fertilizer production, which accounts for a large part of the upstream
CO
2
e contribution of conventional agricultural production. Accounting for all sources,
the production of 1 t of wheat yields a CED of 676 kWh and emissions of 360 kg of
CO
2
e, where 31% of the CED and 27% of the CO
2
e emissions are attributable to the
processing stage of mineral fertilizer production. It is therefore safe to say that the CED
and CO
2
e emissions of agricultural products are closely related to the use of mineral
fertilizers. It should be mentioned that the use of mineral fertilizers and pesticides in the
scenarios stays at the same level as in the baseline situation.
CED and CO
2
e emissions in the baseline situation and the scenarios
CED and CO
2
e values, for both the baseline and the scenarios, are calculated for Austrian
agriculture and displayed for each agricultural sector in Tables 3 and 4. In the scenarios,
CED ranges from 30% to 38% lower than in the baseline situation, while CO
2
e ranges
from 30% to 37% lower. These headline statistics show the significant changes in energy
demand and greenhouse gas emissions that would likely accompany a change to a
healthier diet.
Although the CED of animal husbandry in the scenarios is nearly halved in comparison to
the baseline situation, it remains the agricultural sector with the highest energy demand.
Furthermore, these reductions are somewhat offset by a rise in energy demand from
vegetable and fruit production, which would see an expansion in production area as a
consequence of changed nutritional habits. Taken overall, the CED of Austrian
agriculture shrinks in comparison to the baseline situation because less animal feed is
needed. The CED of crop cultivation and grassland farming is lower in the scenario ‘self-
sufficiency a’ than in the scenario ‘import/export a’ because of a difference in animal
husbandry. In the scenario ‘import/export a’ there are more livestock to be fed due to the
export of animal products. In sub-scenarios b and c, the CED of renewable energy
feedstocks also needs to be included in the calculations, with sub-scenario c yielding a
higher CED than b.
More specifically, the difference in CED between sub-scenarios a and b is due to the
share of the CED derived from renewable energy feedstock production in sub-scenario b.
In sub-scenario c, the use of grass from pasture as a renewable energy feedstock leads to
a further increase in CED. An additional rise in crop cultivation in sub-scenario c is not
possible because no more arable land is available.
The emission of CO
2
e is closely connected with the CED of agriculture. Animal
husbandry causes most of the CO
2
e emissions of Austrian agriculture. Under the dietary
11
change scenarios, CO
2
e emissions fall reflecting an increased vegetable and fruit
production and a decreased grassland farming and animal feed crop cultivation.
Renewable energy feedstock production leads to an additional CO
2
e emission from
agriculture in the sub-scenarios b and c. This additional CO
2
e emission is the difference
between the emissions in sub-scenarios a and b compared with b and c. Although
renewable energy feedstocks are also produced on arable land in sub-scenario c, there is
no increase in CO
2
e emissions compared to scenario b because no further expansion of
crop cultivation is possible.
Current research shows that Austrian agriculture would emit about 578 kg CO
2
e per
capita and year provided that nutrition is adapted to DGE recommendations. This
discrepancy occurs because of taking the processing of foodstuffs into account [13]. It is
difficult to compare the results from this research with other results due to differences in
spatial and temporal system boundaries.
Production of renewable energy based on agricultural raw materials
In sub-scenario ‘self-sufficiency c’, the modeling projects 443,100 ha of renewable
energy feedstock production, made up of 86,641 ha of arable land and 356,452 ha of
grassland. The area of land used for renewable energy feedstock production in sub-
scenario ‘import/export c’ is less than half of that used in sub-scenario self-sufficiency c,
i.e., 208,800 ha, made up of 21,464 ha arable land and 187,360 ha of grassland. Looking
at the outputs of the modeling, it is apparent that in practice, it would be all but
impossible for Austrian agriculture to be self-sufficient in energy through the production
of renewable energy feedstocks. However, a partial covering of CED is possible (Table
5).
Table 6 illustrates that agriculture is able to make good a part of its CED by producing
renewable feedstocks for energy production. In the best case (sub-scenario self-
sufficiency c), enough energy is produced from renewable feedstocks to make good more
than half of the entire agricultural CED. Determining factors in the level of CED
replacement in agriculture are biofuel and biogas production. With diminished biodiesel
production in the sub-scenario ‘import/export b,’ 21% of the CED can be made good by
renewable energy feedstock production. In the sub-scenario import/export c, 37% of the
entire CED can be made good. By contrast, in the sub-scenario self-sufficiency c, 68% of
the CED is made good by renewable energy feedstock production. As much less
bioethanol is produced in the scenarios ‘import/export b/c,’ total energy feedstock
production in these scenarios, and therefore the extent to which CED is made good, is
lower than in the case of the self-sufficiency scenarios. It should be pointed out that the
data in Table 6 do not take into account the energy consumed in producing renewable
energy feedstocks. Consequently, the values given for a share of CED made good are
likely to overestimate the actual net level of replacement. Despite this, it is obvious that
significant partial agricultural self-sufficiency in energy from renewable feedstocks is
possible under the given conditions.
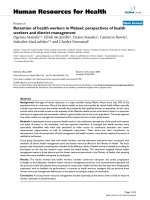
In the sub-scenario ‘self-sufficiency b,’ about 521,916 ha are used for food production,
with a much larger area (1,520,710 ha) used for animal feed production. About 8% of the
12
whole cultivated agricultural area is used for renewable energy feedstock production. The
picture is similar in the sub-scenario import/export b, where 461,416 ha of land are used
for food production and 1,949,839 ha are used for animal feed production. Only about
10% of the entire agricultural land employed in this sub-scenario is applied for renewable
energy feedstock production.
The direct energy demand of agriculture
In self-sufficiency scenario, Austrian agriculture requires about 713 GWh of fuel, 815
GWh of thermal energy, and about 134 GWh of electricity per year. These results were
derived by taking the direct energy requirements (per unit of the different crop and
animal enterprises), multiplying these by the observed crop production areas and
livestock numbers and aggregating to the national level [50]. For the sub-scenarios self-
sufficiency b and import/export b, the target is that agriculture produces enough
renewable energy feedstocks on free agricultural land to make it as close to self-
sufficiency as possible in biodiesel as well as heat and electricity from biogas technology.
In addition, enough feedstocks (wheat and maize) have to be cultivated by agriculture
annually in order to utilize the capacity of Austria's agriculture and only bioethanol plants
to the fullest.
The direct energy demand of agriculture in the import/export scenario is slightly lower
than in the self-sufficiency scenario. This is because of the higher proportion of imported
goods. So, in import/export scenario, agriculture needs about 755 GWh of fuel, 802 GWh
of thermal energy, and about 130 GWh of electricity in total per year [50]. Various
factors influence the amount of direct energy needed. The ratio of imported to
domestically produced agricultural products has a significant impact on direct energy
consumption. A larger share of imported vegetables implies a decrease in the thermal
energy needed for cultivation under glass and a lower fuel demand for machinery.
Additionally, higher exports of animal products cause an increase in fuel demand for crop
cultivation because more animal feed has to be produced domestically.
Consequently, there is a supply gap of 105 GWh. As a result, agriculture cannot be self-
sufficient in biodiesel in the sub-scenarios nor can the additive obligation of 5.75 % to
fossil fuels be fulfilled [51]. The situation is different in the import/export scenario: the
ratio of imports to exports not only determines the direct energy consumption, but also
influences land use and consequently crop rotation. As a result of decreased land use due
to imports and changes in crop rotation, rape for biodiesel production is cultivated on
154,320 ha. The expansion of rape cultivation is attributable to the imports of oil seeds
for human nutrition. Another important fact is the import of fish, which is an important
supplier of omega-3 and omega-6 fatty acids. As a result, less oil seeds are needed to
meet the fatty acid needs of the Austrian population [50]. This implies a biodiesel
production of 1,512 GWh. Agriculture consumes only 755 GWh of biodiesel, and
consequently, 757 GWh of biodiesel is available to fulfill the additive obligation or for
other uses.
In the sub-scenario self-sufficiency b, 45,143 ha grassland and in sub-scenario
import/export b, about 82,000 ha grassland are used for biogas production. In the sub-
13
scenario self-sufficiency b, silage maize is used for biogas production in addition to
grassland. In all, 10,393 ha for silage maize is available for biogas production. By
contrast, no land is available for silage maize production in the import/export scenario;
so, more grassland has to be assigned to the production of biogas. The difference in silage
maize production between the two scenarios, self-sufficiency and import/export, again
reveals the impact of importing and exporting agricultural goods in Austria. In the
import/export scenario, the export of meat induces more animal husbandry so more land
is needed for animal feed production, and given the crop rotation constraints, it is not
possible to produce more silage maize in this scenario.
In the scenario self-sufficiency b, a total of 200,000 m
3
bioethanol is produced. In the
import/export scenario, the production situation for bioethanol feedstocks differs; overall,
maize is grown on 6,949 ha and wheat, on 14,515 ha for bioethanol production. In all,
64,522 m
3
are produced in the import/export scenario; so, the capacity of Austria's only
bioethanol production plant is not used to the fullest. The increase in meat exports and in
animal husbandry necessitates more animal feed production so less land is available for
the production of wheat and maize as bioethanol feedstocks.
The only difference between the scenarios self-sufficiency b and self-sufficiency c and
between the scenarios import/export b and import/export c is the full usage of grassland
for biogas production. In the scenario self-sufficiency c, an additional of 356,452 ha of
grassland is used for biogas production. A different situation is indicated in the scenario
import/export c, in which the area of grassland for biogas production is lesser than in the
scenario self-sufficiency c. In the scenario import/export c, a total of 192,444 ha
grassland is available for biogas production. The area of grassland available for biogas
production in the scenario import/export c is smaller because of the export of animal
products and the simultaneous increase in animal husbandry so that more grass is needed
for animal feed. The results of the various scenarios are shown in Figure 3 of this article.
Discussion
This research has shown the extent to which the energy demand and greenhouse gas
emissions of agriculture can be influenced by changes in human nutritional habits. A
strong correlation between nutritional habits, resource demand, and the environmental
burden of agriculture can be inferred. Although the study has Austrian agriculture as its
particular focus, this correlation has already been shown in other studies with a different
territorial focus [14-15, 52]. The results of the present study show that a decrease in meat
consumption, arising from a change in diet, causes a release of arable land. This would be
a significant outcome for Austrian agriculture with its current dominance by livestock
production, driven by high rates of meat consumption both in Austria and its trading
partners. These results confirm the findings of other research carried out internationally
[14-20, 52].
It is important to examine the correlation of nutritional habits with agricultural energy
demand and greenhouse gas emissions at a regional level because specific production
methods and circumstances can then be taken into account. The main aim of this study
was to examine how a change in diet (and concomitant release of land for renewable
14
energy feedstock production) influences the CED and CO
2
e emissions of Austrian
agriculture. To do this, Austrian agricultural production was modeled as a single average
farm, where all agricultural goods in demand are produced. Applying this method
involves some uncertainties because some parameters cannot be determined in detail. As
a result, no statements about soil quality and soil management methods are made. As soil
management influences emissions from agriculture and the demand for energy, a detailed
scenario calculation for each Austrian production area would lead to results different
from the ‘averages’ presented in this study. In some cases, the values for emissions and
energy demand would be higher, for example, in intensive production areas; in other
cases, they would be lower, for example, in extensive production areas. Another
limitation of this study is that, for energy crop production on redundant land, no precise
statements can be made about where this production is located and whether this land is in
fact suitable for energy production, or even whether it would be economic to convert
surplus land to these uses. Sustainable economic activity by farmers may not lead to the
release of land where there are no profitable alternative uses; under these circumstances,
land is likely to remain in livestock production, albeit under more extensive conditions. It
is therefore a simplifying assumption of the modeling that land that is surplus to food and
feed production must be diverted to renewable energy crop production and to only these
uses.
Other limiting factors can be identified in the CED calculation. Agriculture receives no
energy or emission credits in the sense of the LCA methodology according to ISO 14040
for producing energy crops. As a result, the emissions and energy demand of agriculture
are slightly overestimated because emission and energy credits would lower the values of
these parameters [52]. Regarding the energy consumption of agriculture, the aim was to
examine the demand side; so, the energy input to and output from agriculture are not
compared. A further change in energy demand and emissions can be induced if
agricultural emissions and energy consumption abroad are calculated. System boundaries
have to be set so as to reduce the amount of data that has to be analyzed to manageable
proportions. This should not be taken to mean that energy demand and emission output
from Austrian agriculture can be brought to zero by simply importing all goods.
BRAINBOWS estimates for Austria that in the year 2020 about 455,000 ha agricultural
land could be used for renewable energy crop production [53]. This is slightly higher than
the estimate in the sub-scenario self-sufficiency c, where 443,000 ha are projected to be
available for renewable energy crop production. It is questionable whether the potential
estimated in the study by BRAINBOWS [53] is realistic because this estimate is based on
the assumption that set-aside land is used, that surplus goods which are exported at the
moment are used domestically, and that demand for animal feed goes down because of
the use of co-products from food and particularly biofuel processing. In addition, the
development of higher yielding crops and the use of catch crops should guarantee that
this potential is realized by 2020. Even if, under the assumptions made in the study by
BRAINBOWS [53], a similar amount of agricultural land can be used for energy crops, a
change in diet generates further potential. Another advantage of land released because of
a change in diet is that this land does not compete with food production.
15
Conclusion
The present work has shown that change in nutritional habits can have a great influence
on agricultural energy consumption and greenhouse gas emissions. Above all, eating less
meat would lead to a decrease in negative agricultural environmental impacts. This
research involves some uncertainties caused by the simplifications necessarily involved
with treating Austrian agriculture as a single ‘average’ farm. As a result, it was not
possible to consider the different conditions of production specific to various farming
regions. Despite these uncertainties, the positive effects of reducing meat consumption
and basing nutrition on plants to a greater extent on the agricultural energy and emission
balance are obvious from the modeling and well attested in the literature. Furthermore,
changed nutritional habits can contribute to the achievement of policy targets defined for
renewable energy use through the release of redundant land, where a large part of which
can be used for renewable energy crops. So, the solution to the problem of increased
competition for land for bioenergy production might well be not to increase the area
under cultivation in sensitive regions, not to plow up grassland for crop cultivation, nor to
increase the agricultural output by applying more pesticides and fertilizers. Even under
consistent agricultural production methods in Austria, changed nutritional habits make
more arable land available for renewable energy crops. As a consequence, changing
nutritional habits would be desirable not only because of the potential benefits that might
be obtained in terms of human health, but also because of these secondary emissions and
renewable energy benefits.
The novelty of this work is that the impacts of dietary choices on the availability of land
for renewable energy production and the positive CED and emissions benefits are
examined simultaneously. Existing studies on this topic often focus on the impact of
dietary choices either on energy and emissions or on the availability of land, e.g., in the
studies conducted by Carlsson-Kanyama [4], Eshel and Martin [9], Risku-Norja et al.
[11], Gerbens-Leenes and Nonhebel [54], Elferink and Nonhebel [23], and Dale et al.
[52]. This study merges these approaches. The results of this analysis suggest that new
options for mitigating greenhouse gas emissions and reducing the use of fossil energy are
feasible. A change in diet would be the first step to a more sustainable agriculture and
more sustainable production of renewable energy crops. Thus, this work also
demonstrates the importance of an integrated policy design, encapsulating nutrition,
agriculture and renewable energy.
The assumption on arable land and grassland available for renewable energy feedstock
production in the examined scenario involves an expansion compared to the baseline
situation. On the other hand the scenario estimates are lower than the estimates presented
in the Austrian Biomass Action Plan. In particular, the import/export scenario shows
more modest results than the Biomass Action Plan. By contrast, the self-sufficiency
scenario shows results quite similar to the potential estimated in a biomass resource
potential study for Austria [52]. For purposes of comparison with existing studies of
biomass potential in Austria, the scenario results for maximum renewable energy
feedstock production were chosen. In future the role of energy production from
agricultural residues will be strengthened and therefore the renewable energy production
potential will increase further [55].
16
However, with a maximum of about 8% of agricultural land used for renewable energy
crops under any scenario, the results of the study also show that most of the greater part
of agricultural land will always be needed for food and feed production, even if we
assume the most positive outcomes in terms of changed nutritional habits.
Competing interests
The authors declare that they have no competing interests.
Authors' contributions
KF carried out the CED and CO
2
e calculations as well as the calculation of the energy
produced on the redundant land, wrote the manuscript, and was responsible for textual
design of the paper. HS contributed to the underlying assumptions and the scenario
definition. Furthermore, HS proofread the manuscript and gave some important evidences
concerning the structure and content of the paper. All authors read and approved the final
manuscript.
Acknowledgments
This publication has evolved from a project within the proVISION program, funded by
the Austrian Federal Ministry of Science and Research. ProVISION is aimed at
implementing Austria's FORNE strategy (research for sustainable development) together
with complementary research programs, creating the scientific basis for the country's
sustainability strategy.
Endnotes
a
Production of 1 kg of beef requires an area of 20.9 m
2
, while 1 kg of cereals only
requires about 1.4 m
2
of arable land [54].
References
[1] Steinfeld H, Gerber P, Wassenaar T, Castel V, Rosales M, de Haan C (2006)
Livestock's long shadow: environmental issues and options. FAO, Rome
[2] Mummey D, Smith J, Bluhm G (1998) Assessment of alternative soil management
practices on N
2
O emissions from US agriculture. Agr Ecosyst Environ 70:79-87
[3] Smith P, Martino D, Cai Z, Gwary D, Janzen H, Kumar P, McCarl B, Ogle S,
O´Mara F, Rice C, Scholes B, Sirotenko O, Howden M, MacAllister T, Pan G,
Romanenkov V, Schneider U, Towprayoon S (2007) Policy and technological
constraints to implementation of greenhouse gas mitigation options in agriculture.
Agr Ecosyst Environ 118:6-28
[4] Carlsson-Kanyama A (1998) Climate change and dietary choices−how can emissions
of greenhouse gases from food consumption be reduced? Food Pol 23:277-293
[5] Kramer KJ, Moll HC, Nonhebel S, Wilting HC (1999) Greenhouse gas emissions
related to Dutch food consumption. Energy Pol 27:203-216
17
[6] Pimentel D, Pimentel M (2003) Sustainability of meat-based and plant-based diets
and the environment. Am J Clin Nutr 78
[7] Reijinders L, Soret S (2003) Quantification of the environmental impact of different
dietary protein choices. Am J ClinNutr 78
[8] Wallen A, Brandt N, Wennersten R (2004) Does Swedish consumer's choice of food
influence greenhouse gas emissions? Environ Sci Pol 7:525-535
[9] Eshel G, Martin P (2006) Diet, energy and global warming. Earth Interact 10:1-16
[10] Weber Ch, Matthews HS (2008) Food-miles and the relative climate impacts of food
choices in the United States. Envrion Sci Technol 42:3508-3513
[11] Risku-Norja H, Kurppa S, Helenius J (2009) Impact of consumers' diet choices on
greenhouse gas emissions. In: Koskela M, Vinnari M (eds) Future of the consumer
society. Writers & Finland Futures Research Center, Tampere 159-17.
[12] Stehfest E, Bouwman L, van Vuuren D, den Elzen M, Eickhout B, Kabat P (2009)
Climate benefits of changing diet. Climatic Change 95:83-102
[13] Freyer B, Weik S (2008) Impact of different agricultural systems and patterns of
consumption on greenhouse-gas emissions in Austria. In 16th IFOAM Organic
World Congress, Modena, 16-20 June 2008
[14] Garnett T (2009) Livestock-related greenhouse gas emissions: impacts and options
for policy makers. Environ Sci Technol 12:491-503
[15] Popp A, Lotze-Gampen H, Bodirsky B (2010) Food consumption, diet shifts and
associated non-CO
2
greenhouse gases from agricultural production. Global Environ
Change 20:451-462
[16] McMichael AJ, Powles JW, Butler CD, Uauy R (2007) Food, livestock production,
energy, climate change, and health. Lancet 370:1253-1263
[17] Keyzer MA, Merbis MD, Pawel IFPW, van Wesenbeeck CFA (2005) Diet shifts
towards meat and the effects on cereal use: can we feed the animals in 2030? Ecol
Econ 55:187-202
[18] Rathmann R, Szklo A, Schaeffer R (2010) Land use competition for production of
food and liquid biofuels: an analysis of the arguments in the current debate. Renew
Energy 35:14-22
[19] Karp A, Richter GM (2011) Meeting the challenge of food and energy security. JExp
Bot 1-9
18
[20] Babcock, BA (2008) Breaking the link between food and biofuels. Briefing Paper
08-BP 53. Center for Agricultural and Rural Development, Iowa State University
[21] Rosegrant MW (2008) Biofuels and grain prices. International Food and Policy
Institute
[22] Young AL (2009) Finding the balance between food and biofuels. Environ Sci Pol
Res 16:117-119
[23] Elferink EV, Nonhebel S (2007) Variations in requirements for meat production. J
Clean Prod 15:1778-1786
[24] Wallén A, Brandt N, Wennersten R (2004) Does Swedish consumers' choice of food
influence greenhouse gas emissions? Environ Sci Pol 7:525-535
[25] Nonhebel S (2007) Energy from agricultural residues and consequences for land
requirements for food production. Agr Syst 94:586-592
[26] Owens JW (1996) Life-cycle assessment in relation to risk assessment: an evolving
perspective. Risk Anal 17:359-365
[27] Jones MR (1989) Analysis of the use of energy in agriculture-approaches and
problems. Agr Syst 29:339-355
[28] Hutter C, Koehler D (1999) Ökobilanzierung mit Hilfe der KEA-Datenbank.
Forschungsstelle für Energiewirtschaft, München
[29] Kloepffer W (1997) In Defense of the cumulative energy demand. Int J LCA 2:61
[30] Seebacher U, Oehme I, Suscheck-Berger J, Windsperger A, Steinlechner S (2003)
PUIS-Produktbezogene Umweltinformationssysteme in österreichischen
Unternehmen. BMVIT, Wien
[31] Fischer J (1999) Energy inputs in Swiss agriculture. FAT. Working Paper 99-01
[32] Biedermann G (2009) Kumulierter Energieaufwand (KEA) der Weizenproduktion
bei verschiedenen Produktionssystemen (konventionell und ökologisch) und
verschiedenen Bodenbearbeitungssystemen (Pflug, Mulchsaat, Direktsaat). Master’s
Thesis. University of Natural Resources and Life Science Vienna
[33] Payraudeau S, van der Werf HMG (2005) Environmental impact assessment for a
farming region: a review of methods. Agr Ecosyst Environ 107:1-19
[34] Olesen JE, Schelde K, Weiske A, Weisbjerg MR, Asman WAH, Djurhuus (2006)
Modelling greenhouse gas emissions from European conventional and organic dairy
farms. Agr Ecosyst Environ 112:207-220
19
[35] Bentrup F, Küsters J, Kuhlmann H, Lammel J (2004) Environmental impact
assessment of agricultural production systems using the life cycle assessment
methodology. I. Theoretical concept of a LCA method tailored to crop production.
Eur J Agron 20:247-264
[36] Haas G, Wetterich F, Geier U (2000) Life cycle assessment framework in agriculture
on the farm level. Int J LCA 5:345-348
[37] Roy P, Nei D, Orikasa T, Xu Q, Okadome H, Nakamura N, Shiina T (2009) A
review of life cycle assessment (LCA) on some food products. J Food Eng 90:1-10
[38] Hülsbergen KJ, Feil B, Biermann S, Rathke GW, Kalk WD, Diepenbrock W (2001)
A method of energy balancing in crop production and its application in a long-term
fertilizer trial. Agr Ecosyst Environ 86:303-321
[39] Jones MR (1989) Analysis of the use of energy in agriculture-approaches and
problems. Agr Syst 29:339-355
[40] Institut für Angewandte Ökologie e.V (2008) Globales Emission Modell Integrierter
Systeme (GEMIS)
[41] KTBL (2008) KTBL-Datensammlung Betriebsplanung 2008/09
[42] OEKL (2009) Treibstoffverbrauch in der Land- und Forstwirtschaft 2009
[43] Demerci M (2001) Ermittlung der Deckungsbeiträge der wichtigsten
Gemüsekulturen im Gewächshaus in Österreich. PhD Thesis. University of Natural
Resources and Life Science Vienna
[44] Statistic Austria (2005) Garten-, Feldgemüsebau.
/>echen_ertraege/gartenbau_feldgemueseanbau/index.html. Accessed 10 Sept 2010
[45] Statistik Austria (2010a) Energiegesamtrechnung.
/>mtrechnung/index.html. Accessed 10 Sept 2010
[46] Statistik Austria (2010b) Energieeinsatz der Haushalte.
/>z_der_haushalte/index.html. Accessed 10 Sept 2010
[47] Zessner M, Steimueller H, Wagner KH, Krachler MM, Thaler S, Fazeni K, Helmich
K, Weigl M, Ruzicka K, Heigl M, Kroiss H (2011a) Gesunde Ernährung und
Nachhaltigkeits-Grundlagen, Methodik und Erkenntnisse eines Forschungsprojektes
im Rahmen des proVision Programmes des BMWF. ÖWAW 5-6
20
[48] Zessner M, Helmich K, Thaler S, Weigl M, Wagner KH, Haider T, Mayer MM,
Heigl S (2011) Ernährung und Flächennutzung in Österreich. ÖWAW 5-6,
forthcoming
[49] European Parliament, European Council (2009) Directive 2009/28/EC of the
Parliament and of the Council of 23 April 2009 on the promotion of the use of
energy from renewable sources and amending and subsequently repealing Directives
2001/77/EC and 2003/30/EC. Brussels
[50] European Parliament, European Council (2003) Directive 2003/30/EC of the
Parliament and of the Council of 8 May 2003 on the promotion of the use of biofuels
or other renewable fuels for transport, Brussels
[51] Steinmueller H, Fazeni K (2011) Energiebilanzen der österreichischen
Landwirtschaft unter Berücksichtigung von Ernährungsgewohnheiten. ÖWAW 5-6
[52] Dale BE, Bals BD, Kim S, Eranki P (2010) Biofuels done right: land efficient animal
feeds enable large environmental and energy benefits. Environ Sci Technol 44:8385-
8389
[53] BRAINBOWS (2007) Biomasse-Ressourcenpotential in Österreich. Studie im
Auftrag der Renergie Raffeisen Managementgesellschaft für erneuerbare Energie
GmbH
[54] Gerbens-Leenes PW, Nonhebel S (2002) Consumption patterns and their effects on
land required for food. Ecol Econ 42:185-199
[55] Nonhebel S (2007) Energy from agricultural residues and consequences for land
requirements for food production. Agr Syst 94:586-592
21
Figure 1. LCA system boundaries. The data are based on the authors' calculation.
Figure 2. Scenario description. The data are from the authors' calculation which is
based on the study of Zessner et al. [47].
Figure 3. Agricultural land for different uses in the sub-scenarios self-sufficiency b
and import/export b. The data are based on the authors' calculation.
Table 1. Area available for renewable energy feedstock production in Austria
currently
Arable land and grassland available for renewable energy feedstock production in Austria
Baseline
situation in
2006
Estimated
potential in 2020
for a national
Biomass Action
Plan
Estimated potential
in a Biomass
Resource Potential
Study in 2020
Estimated
potential in self-
sufficiency
scenario
(maximum)
Estimated potential
in import/export
scenario (maximum)
55,000 ha 1,011,000 ha 455,000 ha 443,100 ha 208,800 ha
The said available area for renewable energy feedstock production is also under a number
of scenarios of land use exchange. The data come from BRAINBOWS [53] and from the
authors' own calculation.
Table 2. Consumption of food by product categories in the baseline situation and the
scenarios
Baseline situation Scenario
situation
Product categories [kg/per capita/annum]
Meat 56.8 23.4
Eggs 11 8 9.5
Milk and milk products
a
257.0 279.9
Fish 9.8 0.4
Cereals/rice/potatoes 114.6 129.7
Fruits 58.6 91.3
Vegetables 89.6 146.0
Vegetable oils 9.7 6.8
Sugar 33.0 18.3
a
Raw milk equivalent; The data are based on the authors' own calculation which is based
on the study of Zessner et al.[48].
22
Table 3. CED in the baseline situation and the scenarios
Baseline
situation
Scenario self-
sufficiency a
Scenario
self-
sufficiency b
Scenario self-
sufficiency c
Scenario
import/export
a
Scenario
import/export
b
Scenario
import/export
c
CED [MJ/capita]
Crop
cultivation
726 460 595 595 550 724 724
Grassland 460 143 152 220 152 169 198
Animal feed
crop
cultivation
363 319 325 320 290 290 290
Vegetable
production
99 190 190 190 102 102 102
Fruit
production
111 245 245 245 142 142 142
Animal
husbandry
2,252 1,146 1,146 1,146 1,294 1,294 1,294
Sum 4,005 2,505 2,648 2,715 2,531 2,721 2,75
where the additional energy crop production is calculated as follows:
Crop
cultivation
135 0 174 0
Grassland
9 68 17 6
Sum without
additional
energy crop
production
2,504 2,647 2,530 1,288
The data are based on the authors' own calculation.
23
Table 4. CO
2
e emissions in the baseline situation and the scenarios
Baseline
situation
Scenario
self-
sufficiency
a
Scenario
self-
sufficiency b
Scenario
self-
sufficiency c
Scenario
import/export a
Scenario
import/export
b
Scenario
import/export c
CO
2
e [kg/per capita/annum]
Crop
cultivation
104 69 89 89 86 106 106
Grassland 118 39 42 61 42 47 53
Animal feed
crop
cultivation
62 56 56 56 50 50 50
Vegetable
production
22 43 43 43 23 23 23
Fruit
production
7 16 16 16 10 10 10
Animal
husbandry
573 355 355 355 377 377 377
Sum 887 578 601 620 587 612 619
The data are based on the authors' own calculation.
Table 5. Contribution of renewable energy feedstock production to the CO
2
e
emissions of agriculture
Scenario self-
sufficiency b
Scenario self-
sufficiency c
Scenario
import/export
b
Scenario
import/export
c
CO
2
e [kg/per capita]
Crop
cultivation
20 0 21 0
Grassland
3 19 5 6
The data are based on the authors' own calculation.
Table 6. Comparison of CED and energy production (self-sufficiency scenario and
import/export scenario)
Scenario self-
sufficiency b
Scenario self-
sufficiency c
Scenario
import/export b
Scenario
import/export c
Biodiesel [TJ] 2 2 5 5
Bioethanol [TJ] 4,862 4,862 1,366 1,366
Biogas [TJ] 3,415 10,035 3,203 6,773
Sum [TJ] 8,279 14,897 4,577 8,141
CED [TJ] 21,530 22,091 22,115 22,359
Proportion of CED made
good [%]
38% 68% 21% 37%
The data are based on the authors' own calculation. TJ, terajoule.
Figure 1