báo cáo hóa học: " Testing a model of association between patient identified problems and responses to global measures of health in low back pain patients: a prospective study" pdf
Bạn đang xem bản rút gọn của tài liệu. Xem và tải ngay bản đầy đủ của tài liệu tại đây (262.14 KB, 11 trang )
BioMed Central
Page 1 of 11
(page number not for citation purposes)
Health and Quality of Life Outcomes
Open Access
Research
Testing a model of association between patient identified problems
and responses to global measures of health in low back pain
patients: a prospective study
Ricky Mullis*, Martyn Lewis and Elaine M Hay
Address: Arthritis Research Campaign National Primary Care Centre, Keele University, Keele, UK
Email: Ricky Mullis* - ; Martyn Lewis - ; Elaine M Hay -
* Corresponding author
Abstract
Background: Self-rated health status has been shown to be related to physical function.
Therefore, changes in functional ability should be associated with changes in general health.
However, functional needs may vary greatly between individuals. The purpose of this study was to
propose and test a model of association between patient identified functional problems and
responses to global measures of health in low back pain patients.
Methods: Participants in a low back pain clinical trial were followed up for 12 months. A series of
analyses were undertaken using the Jonckheere-Terpstra test and chi-square for trends to
determine the associations between two individualised items related to function, and measures of
"overall improvement in condition", "general health status" and performance of "usual activities".
Results: Significant associations between responses to the five items were found. Performance of
usual activities is significantly associated with ratings of general health status (p < 0.001) and overall
condition of the back (p < 0.001). The extent to which the patient identified problems influence an
individual's perception on multi-task performance is dependent upon the degree of difficulty and
level of importance attached to these problems.
Conclusion: The relationship between patient identified problems and responses to global
measures of health is complex. The explanatory model proposed here may improve our
understanding of these interactions.
Trial Registration: ISRCTN 32765488
Background
Theory underpinning possible associations between
responses
Measuring the success of an intervention to change a
patient's health is central to both research and clinical
practice. Self-rated health status has been shown to be
related to a number of distinct constructs including phys-
ical function, medication use and mental well-being [1-3].
Wilson and Cleary [4] described a five level classification
scheme for different measures of health outcome, ranging
from biological and physical factors, symptoms, function-
ing, general health perceptions, through to overall quality
of life (QoL). Further, they proposed a causal link
between the levels, with each becoming "increasingly
Published: 5 August 2009
Health and Quality of Life Outcomes 2009, 7:74 doi:10.1186/1477-7525-7-74
Received: 19 February 2009
Accepted: 5 August 2009
This article is available from: />© 2009 Mullis et al; licensee BioMed Central Ltd.
This is an Open Access article distributed under the terms of the Creative Commons Attribution License ( />),
which permits unrestricted use, distribution, and reproduction in any medium, provided the original work is properly cited.
Health and Quality of Life Outcomes 2009, 7:74 />Page 2 of 11
(page number not for citation purposes)
integrated and increasingly difficult to define and meas-
ure". Smith et al. [5] explored a structural model of the
determinants of health status and QoL, suggesting that
self-evaluation of these two constructs are "determined
jointly by assessments of several domains". They hypoth-
esised a cognitive process that involved:
1) identifying the relevant domains comprising the con-
struct
2) determining where one stands on each domain
3) integrating the separate domain judgements into an
overall assessment
Self-rated recovery from back pain has been shown to
depend upon an individual's cognitive appraisal of the
impact of symptoms on their ability to perform meaning-
ful daily activities [6] and functional every day tasks were
found to be important outcome markers for patients with
musculoskeletal pain [7]. Perceptions about QoL and gen-
eral health status are also unique to the individual, and
determination of the relevant domains that comprise
these constructs must take account of what is important at
an individual level. Therefore, if function plays a role in
how general health is perceived (as suggested by Wilson
and Cleary [4]), there should be a clear association
between changes in functional ability and changes in gen-
eral health. Similarly, if specific functional activities are
considered an important element of day to day usual activ-
ities, an association between these items would also be
expected. If a link can be proven, then targeting these
patient-specific functional tasks as an aim of treatment
may lead to improved outcomes.
Individualised or "patient-specific" measures allow the
respondent to select the important issues or concerns
which affect them the most. They are free from the type of
pre-determined items which form the majority of stand-
ardised questionnaires, and which may contain elements
of little importance to some, whilst omitting items of rel-
evance to others. One criticism of this type of measure is
that without standardisation of the items, the scales are
not the same in each patient and the numeric scores do
not hold a common meaning [8]. However, similar argu-
ments may be levelled when comparisons are made across
different fixed item scales which produce very different
impressions of health in the same sample [9].
It has been shown that people who suffer with low back
pain can readily identify important aspects of their lives
that are affected [10]. These ranged from purely functional
daily activities (e.g. washing, dressing, moving from one
position to another) to areas that affect an individuals'
wider role in society and quality of life (e.g. employment
and recreational activities). The breadth of problems expe-
rienced by people with back pain provides the opportu-
nity to explore the concepts proposed by Wilson and
Cleary [4] and Smith et al. [5], and may be illustrated by
reference to five items taken from a questionnaire used in
a clinical trial [11]. Items one (Q1) and two (Q2) were
individualised, requiring the respondent to identify a sin-
gle difficult or usually enjoyed activity affected by their
back pain. Item three (Q3) referred to usual activities,
which could (amongst others) include those things iden-
tified in Q1 and Q2. The theories of Wilson and Cleary [4]
and the model described by Smith et al. [5] would suggest
that the single activities identified from Q1 and Q2 may
act as salient points of reference for individuals when they
consider the usual activities item, and may influence how
they perceive their overall performance of multiple tasks.
Similarly, when appraising the broader constructs of gen-
eral health (Q4) and overall change in condition (Q5) in
the form of single item global measures of health status,
one of the anchors to which an individual may con-
sciously (or otherwise) refer is their performance of usual
activities, which could influence their perception of these
more complex aspects of health.
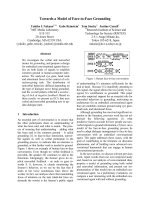
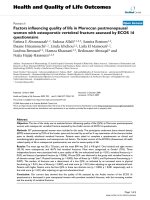
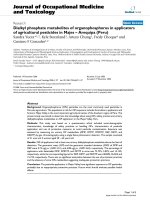
This proposed link between the five items can be visually
depicted as forming a three tier hierarchy. The level at
which each item appears within the hierarchy is deter-
mined by the breadth of factors taken into consideration
in forming a response. Thus, the individualised patient-
identified single activity items (Q1 and Q2) form the bot-
tom tier of the structure. The middle tier contains the usual
activities component of the EuroQol instrument (Q3)
[12], as this calls for a response based across a range of
functional tasks. Ratings of general health status (Q4) and
overall change in condition (Q5) incorporate the broadest
constructs of measurement and occupy the top tier. Figure
1 depicts this three tier structure.
Each layer represents a broader span of considerations
and an increasing level of anchor point complexity over
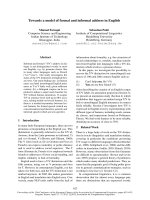
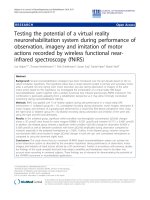
that below it. However, it is hypothesised that these tiers
are not independent of each other. One possible model of
association is that the single activity items in the lowest
tier exist as a simple subgroup within the items above.
This relationship is depicted in figure 2.
If this were so, then the single activities which individuals
identified as important may act as salient points of refer-
ence when considering responses to the multi-task usual
activities item and to broader general health questions.
However, the extent to which these single activity items
influence the more generic measures may not be quite so
simple. Figure 2 suggests that the single activity items
form a set area within the space occupied by usual activi-
ties, which in turn takes up a given area of the larger total
Health and Quality of Life Outcomes 2009, 7:74 />Page 3 of 11
(page number not for citation purposes)
space representing the global measures of health status.
However, the relative proportion of space that the single
activities occupy within the two larger areas differs; and it
could also be surmised that the influence that these items
have on each of the larger areas will also differ. In this con-
text, this would mean that the single activities (occupying
a relatively large proportion of the usual activities space)
would have a greater impact upon an individual's percep-
tion of their ability to perform usual activities, than they
would on broader general health issues (where the "single
activity" occupies proportionately less space).
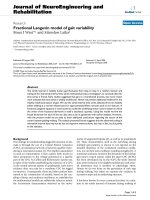
Other factors may also influence these relationships. For
example, the degree of difficulty associated with these sin-
gle activities or the importance attached to them may con-
tribute to the strength of these associations. We
hypothesised that single chosen activities which are rated
higher in difficulty or importance by patients will bear a
greater influence on responses to the items composing
broader contructs when compared with those rated less
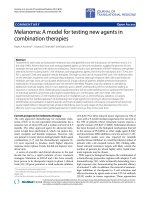
difficult or perceived to be of little importance. The varia-
ble potential of the single chosen activity to influence
responses to more complex items is depicted in figure 3;
with more difficult or important single activities (repre-
sented by the grey shaded area) occupying a larger propor-
tion of space within the diagram.
The aim of this study was to test this model by undertak-
ing a series of analyses to determine the associations
between the two individualised items and measures of
"overall improvement", "general health status" and per-
formance of "usual activities". Specifically, the following
hypotheses were tested:
The structure of a theoretical hierarchy between single activity items and broader constructs of healthFigure 1
The structure of a theoretical hierarchy between single activity items and broader constructs of health.
Global items based upon a broad amalgam of experiences
e.g. Assessment of general health status
or overall change in condition
Usual activities
(spanning a range of functional tasks)
Patient-identified single activities
Venn diagram depicting a simple "sub-group" relationship between the different tiers of the item hierarchyFigure 2
Venn diagram depicting a simple "sub-group" relationship between the different tiers of the item hierarchy.
Usual activities
Single
activity
Global measures of health status
Health and Quality of Life Outcomes 2009, 7:74 />Page 4 of 11
(page number not for citation purposes)
Hypothesis 1 – The perceived ability to perform usual activi-
ties (Q3) will be positively associated with
i) the difficulty associated with the single activity (Q1)
and ii) the importance attached to the single activity (Q2)
Hypothesis 2 – The responses given to the broadest construct
items (Q4 and Q5) will be positively associated with the
responses given to the single activity items (Q1 and Q2).
Hypothesis 3 – The responses given to the broadest construct
items (Q4 and Q5) will be positively associated with perceived
ability to perform usual activities (Q3).
Hypothesis 4 – The strength of the association between meas-
ures which occupy adjacent tiers of the hierarchical model
(described in figure 1) will be greater than that between the
bottom and top tiers
i.e. i) Q1 and Q2 will be more strongly associated with Q3
than with Q4 and Q5;
and ii) Q3 will be more strongly associated with Q4 and
Q5 than will Q1 and Q2.
Methods
The hypotheses were tested by analysing patients'
responses to five items (Q1 to Q5) used in a self-com-
pleted questionnaire in a low back pain trial conducted by
Hay et al. [11]. This randomised controlled trial compared
the clinical effectiveness, in primary care, of a brief pain
management programme delivered by physiotherapists
with that of a programme of spinal manual physiotherapy
in the treatment of non-specific low back pain of less than
12 weeks duration. The primary outcome was change in
self-reported back pain related disability at 12 months.
Favourable ethical opinion for this study was gained from
North Staffordshire Local Research Ethics Committee
(Project No.1123).
Q1 During the baseline assessment, the following ques-
tion was asked:
Because of your back pain, what one thing do you find the most
difficult to do?
Using a 10 cm visual analogue scale (VAS) participants
were then asked to indicate how difficult this thing was (0
= "no difficulty", 100 = "worst imaginable difficulty").
At 12 months follow-up, participants were reminded of
the activity which they had selected at baseline, and asked
to indicate how difficult it currently was.
Q2 At baseline, participants were asked:
Is there one thing that you really enjoy doing usually that you
are unable to do at the moment, because of your back pain?
(Yes/No)
Those who responded "yes" were then asked: What is this
thing that you enjoy and can't do at the moment? and to indi-
cate how important this was to them on a VAS (0 = "not
important", 100 = "very important").
At follow-up, those participants who had identified a usu-
ally enjoyed activity at baseline were reminded of what they
had selected, and asked whether they were now able to do
it.
Venn diagram depicting the variable potential of a single chosen activity to influence responses to items comprising broader constructsFigure 3
Venn diagram depicting the variable potential of a single chosen activity to influence responses to items com-
prising broader constructs.
Usual activities
Single
activity
Global measures of health status
Health and Quality of Life Outcomes 2009, 7:74 />Page 5 of 11
(page number not for citation purposes)
Responses to Q1 and Q2 were unprompted, and recorded
as free text. The content of these responses have been
reported elsewhere [10].
Q3 This item from the EQ-5D [12] relates to problems
with "usual activities", with response options "no prob-
lems", "some problems" and "unable to perform" usual
activities.
Q4 Participants rated their general health status at base-
line and follow-up as either "excellent", "very good",
"good", "fair" or "poor".
Q5 At follow-up, participants were asked: In general, how
has your back been feeling since you entered this study?
Response options were "Completely better", "much bet-
ter", "better", "same", "worse" and "Much Worse".
Analyses
Hypothesis 1
Patients were categorised according to their responses to
Q3. The Jonckheere-Terpstra test for ordered alternatives
was used to identify trends in patient identified single task
difficulty (Q1) and importance scores (Q2) across
responses to Q3. This method is considered appropriate
when the order of the groups is specified a priori [13].
On Q2, the Chi-square test for trend was used to compare
the responses to Q3 of patients who at follow-up were
subsequently able to take part in their selected usually
enjoyed single activity with those who were still not able
to do so.
Hypothesis 2
Patients were grouped according to their general health
status (Q4) and to change in condition (Q5). The Jonck-
heere-Terpstra test was used to identify trends in patient
identified task difficulty (Q1) across responses to Q4 and
Q5.
For Q2, chi-square for trends was used to:
i) compare responses to Q4 in patients who were able to
identify a specific usually enjoyed activity with those who
could not;
ii) compare patients who at follow-up, were able to take
part in their selected usually enjoyed single activity with
those who were still not able to do so.
Hypothesis 3
The Jonckheere-Terpstra test was used to identify trends in
general health status (Q4) across reported ability to com-
plete usual activities, and trends in "change in condition"
(Q5) with changes in ability to complete usual activities.
Hypothesis 4
Findings from the analyses for hypotheses 1, 2 and 3 will
be collated.
Results and discussion
Hypothesis 1
The perceived ability to perform usual activities (Q3) will be
positively associated with
i) the difficulty associated with the single activity (Q1)
and ii) the importance attached to the single activity (Q2)
Q1 and Q3 – Data were available for both items on 396
patients at baseline, and 300 at 12 months follow-up. A
summary of these data can be seen in table 1.
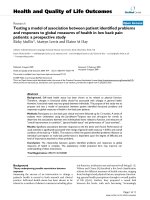
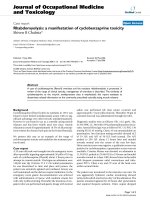
Change in task difficulty between baseline and follow-up
was categorised according to change in usual activities
responses and can be seen in figure 4.
The Jonckheere-Terpstra test revealed a significant trend in
the order of the median scores of task difficulty across the
three usual activities groups at baseline (p = 0.015) and at
12 months (p < 0.001), and across change scores (p <
0.001).
Q2 and Q3 – Data were available for Q2 and Q3 on 405
patients at baseline, and 311 at follow-up.
At baseline 311 patients (76.8%) were able to specify a
usually enjoyed activity that they were prevented from
doing. A cross-tabulation of data from Q2 and Q3 is
shown in table 2.
The Jonckheere-Terpstra test revealed a significant trend in
the order of the median scores of importance of chosen
single activity across the three usual activities groups (p <
Table 1: Task difficulty VAS scores categorised by usual activities
responses at baseline and 12 months
Task difficulty (VAS)
Baseline 12 Months
Usual Activities n Median IQR n Median IQR
No problems 185 61 28 191 1 10
Some problems 181 63 28 100 25 41
Unable 30 74 24 9 71 45
Health and Quality of Life Outcomes 2009, 7:74 />Page 6 of 11
(page number not for citation purposes)
0.001). Chi-square for trends revealed that patients who
were subsequently able to take part in their chosen "usu-
ally enjoyed activity" at 12 months had less problems
doing usual activities compared with those who were still
unable to take part in the single activity (χ
2
= 11.22, p =
0.001).
Discussion
The data demonstrates a clear and significant association
between performance on the individualised single items
and perceived ability to undertake usual activity, although
the relationships are not simple.
Patients who stated that they were "unable" to perform
usual activities rated their self-identified "most difficult
thing" as harder to do, compared with those patients who
had either "no problems" or "some problems" with usual
activities. Furthermore, there were significant trends in the
order of scores of task difficulty across the usual activities
response categories at baseline and follow-up. Those
patients who had improved the most in terms of task dif-
ficulty, also showed the greatest change in ability to per-
form usual activities.
A similar pattern emerged in the responses to Q2. Patients
who indicated that they had "no problems" with usual
activities rated the importance of their specific chosen
activity lower than those patients who had "some prob-
lems" or were "unable to perform" usual activities. At fol-
low-up, patients who were subsequently able to take part
in their chosen "enjoyed activity" were more likely to have
no problems doing usual activities, compared with those
who were still unable to take part in the single activity.
The evidence presented supports hypothesis one.
Hypothesis 2
The responses given to the broadest construct items (Q4 and
Q5) will be positively associated with the responses given to the
single activity items (Q1 and Q2).
Q1 and Q4 – Data were available for both measures on
397 patients at baseline, and 300 at 12 months. A cross-
tabulation of these data can be seen in table 3.
The Jonckheere-Terpstra test found no significant trend in
the order of the median scores of task difficulty across the
five general health categories at baseline (p = 0.668) but
revealed a significant trend at 12 months (p < 0.001).
When the change in task difficulty scores over 12 months
were categorised according to change in general health
status, the Jonckheere-Terpstra test found no significant
trend in the order of the median scores (p = 0.064).
Q1 and Q5 – Data were available for both measures on
299 patients at 12 months follow-up.
Change in task difficulty was categorised according to
overall condition of back, and can be seen in figure 5.
The Jonckheere-Terpstra test revealed a significant trend in
the order of the median scores of change in task difficulty
across the "change in condition of back" categories at 12
months (p < 0.001) Patients reporting themselves as com-
pletely better recorded the most beneficial change in task
difficulty.
Q2 and Q4 – Data were available for both measures on
406 patients at baseline, of which 312 (76.8%) were able
to identify a specific "usually enjoyed activity" that they
were prevented from doing. At 12 months, data were
available on 238 (76.3%) of these original 312 patients. A
cross-tabulation of these data can be seen in table 4.
At baseline, no statistically significant difference was
found on general health status between those who could
identify a "usually enjoyed activity" and those who could
not (χ
2
= 0.68, p = 0.406). At 12 months, those who were
able to perform their chosen activity rated their general
health significantly better than those who were still not
able to (χ
2
= 14.11, p < 0.001).
Q2 and Q5 – Data were available for both measures on
235 patients at 12 months, and a cross-tabulation is
shown in table 5.
Boxplot of task difficulty change scores across change in usual activities at 12 monthsFigure 4
Boxplot of task difficulty change scores across change
in usual activities at 12 months.
12 Month change Usual Activities scores
10-1-2
12 Month change task difficulty VAS
25
0
-25
-50
-75
-100
Health and Quality of Life Outcomes 2009, 7:74 />Page 7 of 11
(page number not for citation purposes)
Chi-square for trends showed that those who were subse-
quently able to participate in their chosen single activity
rated their change in condition significantly better than
those who were still not able to (χ
2
= 17.75, p < 0.001).
Discussion
The association between responses to the single activity
items and perception of general health is equivocal. At
baseline, general health was not associated with the
degree of difficulty experienced with self-selected tasks.
Conversely, at 12 months a significant trend was evident.
Similarly, at baseline there was no difference in the distri-
bution across health status categories between those who
could and those who could not identify a specific "usually
enjoyed activity". However, at follow-up, patients who
were subsequently able to take part in their chosen activity
rated themselves to be in better general health than those
who were still unable to participate. The inconsistency of
the evidence relating responses on the two individualised
items to general health status suggests that any likely asso-
ciation is weak.
Conversely, an improvement in the overall condition of a
patient's back was associated with improvements in per-
forming their chosen single activities. At follow-up, most
patients experienced less difficulty completing their cited
task, and there was a significant trend associated with
improvement in the overall condition of their back. Simi-
Table 2: Cross-tabulation showing frequency of responses (%) to the usual activities item with identification and importance of a specific
single "usually enjoyed activity" and with ability to take part in the single "usually enjoyed activity" at 12 months
Baseline
Usual Activities
Specific "usually enjoyed activity" identified
No Yes
n (%) n (%) Importance
(IQR)
Total
No problems 46 (48.9) 142 (45.7) 76 (30) 188
Some problems 45 (47.9) 142 (45.7) 88 (30) 187
Unable 3 (3.2) 27 (8.7) 93 (21) 30
Total 94 311 405
12 months
Usual Activities
12 months "able to take part in usually enjoyed activity"
no yes Total
No problems 21 (42.0) 120 (63.5) 141
Some problems 24 (48.0) 66 (34.9) 90
Unable 5 (10.0) 3 (1.6) 8
Total 50 189 239
Table 3: Task difficulty VAS scores categorised by general health
status at baseline and 12 months
Task difficulty (VAS)
Baseline 12 Months
General health n Median IQR n Median IQR
Excellent 32 62 26 19 0 2
Very good 137 63 31 110 2 18
Good 171 62 28 112 9 29
Fair 47 68 28 46 35 54
Poor 10 75 23 13 18 61
Health and Quality of Life Outcomes 2009, 7:74 />Page 8 of 11
(page number not for citation purposes)
larly, those who had returned to this activity within the
follow-up period, perceived their condition to have
improved significantly more than those who had not.
Therefore, the data presented here do not fully support
hypothesis 2. Based on the evidence available, there may
be a stronger association between the single activity
responses and overall condition of the back than with per-
ception of general health status.
Hypothesis 3
The responses given to the broadest construct items (Q4 and
Q5) will be positively associated with perceived ability to per-
form usual activities (Q3).
Q3 and Q4 – Data were available for both measures on
405 patients at baseline and 330 at 12 months. The distri-
bution of health status scores across usual activities
responses is shown in figure 6.
The Jonckheere-Terpstra test revealed a significant trend in
the order of the median scores of general health status
across the three usual activities groups at baseline (p <
0.001) and at 12 months (p < 0.001), and also with
change scores across these two measures (p < 0.001).
Q3 and Q5 – Data were available for both measures on
311 patients at 12 months. The distribution of usual activ-
ities change scores across change in condition of back is
shown in figure 7.
The Jonckheere-Terpstra test revealed a significant trend in
the order of the median scores of change in condition of
back across change in usual activities at 12 months (p <
0.001).
Discussion
There were significant associations between perceived
ability to complete usual activities, and both general health
status and change in overall condition of back. When
grouped according to usual activities responses, there were
significant differences in general health status both at
baseline and follow up, as well as significant positive
trends on change scores across both sets of measures.
The data presented here therefore support hypothesis
three.
Hypothesis 4
The strength of the association between measures which occupy
adjacent tiers of the hierarchical model (described in figure 1)
will be greater than that between the bottom and top tiers
i.e. i) Q1 and Q2 will be more strongly associated with Q3
than with Q4 and Q5;
and ii) Q3 will be more strongly associated with Q4 and
Q5 than will Q1 and Q2.
Discussion
The evidence presented above for hypotheses one, two
and three support hypothesis four, although not unequiv-
ocally. Responses to both of the single activity items were
associated with ability to perform usual activities. These
items sit in adjacent layers of the hierarchical model
depicted in figure one. However, the associations between
Q1 and Q2 (occupying the bottom tier) and those in the
top tier (Q4 and Q5) are less consistent; whereas the abil-
ity to perform usual activities (middle tier) is more strongly
associated with the more complex items occupying the
top tier.
Overall, the evidence tends to support hypothesis four.
Conclusion
The relationship between these layers is complex, and the
data more readily fits the model depicted in the Venn dia-
gram of figure three, supporting the theory describing the
variable potential of the single activity items to influence
responses to the items comprising broader constructs. The
degree of difficulty or level of importance ascribed to the
single activities was significant in how patients responded
on the more global measures of health status. The single
Boxplot of the distribution of task difficulty change scores according to self reported condition of back at 12 months (scores of "Worse" and "Much worse" are pooled)Figure 5
Boxplot of the distribution of task difficulty change
scores according to self reported condition of back at
12 months (scores of "Worse" and "Much worse" are
pooled).
worsesamebettermuch bettercompletely better
12 Months Condition of back
40
20
0
-20
-40
-60
-80
-100
Change in task difficulty VAS at 12 Months
Health and Quality of Life Outcomes 2009, 7:74 />Page 9 of 11
(page number not for citation purposes)
items which patients chose may have contributed (along
with a range of other functional tasks) to their perception
of completing usual activities. This in turn fed in (to a lesser
extent) to their perception of general health status and the
overall condition of their back. These associations are in
keeping with the causal link theory [4], and sit within the
structural model proposed by Smith et al. [5] whereby rel-
evant domains are identified, appraised and then inte-
grated to provide an overall assessment of health status.
Functional tasks that affected every day living were found
to be the most important outcome markers for patients
with musculoskeletal pain [7]. Hush et al. described a link
between self-rated recovery from back pain and ability to
perform meaningful daily tasks [6]. However, both of
these reports were based upon qualitative interviews. This
study adds to the body of knowledge by demonstrating a
statistical association between functional every day tasks
and more global measures of health status. The develop-
ment of fixed-item instruments that measure functional
health outcome should take consideration of the impor-
tance as well as the difficulty of completing the tasks
selected.
Furthermore, Carnes & Underwood concluded that
"Treatment progress can be more meaningfully moni-
tored by using patient determined goals, rather than clin-
ical outcomes" [7]. The types of functional activity that
patients identified as important in Q1 and Q2 (described
in detail by Mullis et al [10]) could easily be included
within a clinical assessment and translated into treatment
goals. We have shown that achievement of these activities
is associated with a perceived improvement in overall
condition, and that this association is stronger when these
activities are more important to the individual. Work to
assess whether targeting specifically these goals can lead to
further improvements in outcome is recommended.
Table 4: Cross-tabulation of response frequency (%) on general health status with identification of a specific "usually enjoyed activity"
at baseline, and with ability to perform this activity at 12 months
Baseline General health status Specific "usually enjoyed activity" identified
no yes Total
Excellent 5 (5.3) 27 (8.7) 32
Very good 34 (36.2) 105 (33.7) 139
Good 48 (51.1) 127 (40.1) 175
Fair 7 (7.4) 43 (13.8) 50
Poor 0 10 (3.2) 10
Total 94 312 406
12 Months General health status Now able to perform
"usually enjoyed activity"?
Total
no yes
Excellent 1 (2.0) 12 (6.4) 13
Very good 10 (20.0) 73 (38.8) 83
Good 19 (38.0) 71 (37.8) 90
Fair 15 (30.0) 25 (13.3) 40
Poor 5 (10.0) 7 (3.7) 12
Total 50 188 238
Health and Quality of Life Outcomes 2009, 7:74 />Page 10 of 11
(page number not for citation purposes)
Limitations
These analyses were performed on data collected during a
randomised clinical trial of treatments for low back pain
[11]. Although the breadth of problems experienced by
people with back pain provided the opportunity to
explore associations between the different constructs, the
sample size was not powered to test the hypotheses,
which may present the possibility of a type 2 error. How-
ever, most of the analyses led to the dismissal of the null
hypothesis, thereby suggesting that the risk of this was rel-
atively small.
The trial participants were "a defined subset of all primary
care consulters with non-specific low back pain – those
consulting with a current episode duration of less than 12
weeks" [11]. Such patients account for approximately one
in five of all primary care consulters with low back pain
[14]. It is possible that persistent chronic low back pain
sufferers may respond differently to these questions.
The main findings of this paper are summarised
in the following points
• There are significant associations between responses
to the five questions.
• The extent to which the single activities identified by
patients on the individualised questions influence
their perception on multi-task performance is depend-
ent upon the degree of difficulty and level of impor-
tance attached to these.
• Perception of the performance of usual activities has
an effect upon ratings of general health status and
overall condition of the back.
Table 5: Cross-tabulation showing frequency of responses (%) to
change in condition of back at 12 months with ability to perform
a self-selected "usually enjoyed activity"
12 Months
Change in condition of back
Now able to perform
"usually enjoyed activity"?
Total
No yes
Completely better 6 (12.0) 38 (20.5) 44
Much better 18 (36.0) 101 (54.6) 119
Better 9 (18.0) 22 (11.9) 31
Same 7 (14.0) 18 (9.7) 25
Worse 8 (16.0) 5 (2.7) 13
Much worse 2 (4.0) 1 (0.5) 3
Total 50 185 235
Boxplots of the distribution of health status scores at baseline and 12 months according to usual activities responsesFigure 6
Boxplots of the distribution of health status scores at baseline and 12 months according to usual activities
responses.
Baseline Usual Activities
unable tosome problemsno problems
Baseline General Health Status
5
4
3
2
1
12 Months Usual Activities
unable to performsome problemsno problems
12 Months General Health Status
5
4
3
2
1
Publish with BioMed Central and every
scientist can read your work free of charge
"BioMed Central will be the most significant development for
disseminating the results of biomedical research in our lifetime."
Sir Paul Nurse, Cancer Research UK
Your research papers will be:
available free of charge to the entire biomedical community
peer reviewed and published immediately upon acceptance
cited in PubMed and archived on PubMed Central
yours — you keep the copyright
Submit your manuscript here:
/>BioMedcentral
Health and Quality of Life Outcomes 2009, 7:74 />Page 11 of 11
(page number not for citation purposes)
• Ability to undertake the single activity items is asso-
ciated with improvement in overall condition of the
back, but not general health status.
• The explanatory model proposed may improve our
understanding of these complex relationships.
Competing interests
The authors declare that they have no competing interests.
Authors' contributions
RM contributed to the design of the explanatory model
and the study, data collection and analysis, and writing of
the manuscript. ML contributed to the design of the study,
data analysis and writing of the manuscript. EH contrib-
uted to the design of the study, interpretation of the find-
ings and writing of the manuscript.
Acknowledgements
The clinical trial from which these data were derived was funded by grants
from the UK National Lottery Charities Board and the North Staffordshire
Primary Care Research Consortium, UK. The authors would like to
acknowledge the contribution of all members of the public who took part
as subjects in this study.
References
1. Benyamini Y, Idler EL, Leventhal H, Leventhal EA: Positive affect
and function as influences on self-assessments of health:
expanding our view beyond illness and disability. Journals of
Gerontology. Series B, Psychological Sciences and Social Sciences 2000,
55(2):107-16.
2. Krause NM, Jay GM: What do global self-rated health items
measure? Medical Care 1994, 9:930-42.
3. Mitrushina MN, Satz P: Correlates of self-rated health in the eld-
erly. Aging (Milano) 1991, 3(1):73-7.
4. Wilson IB, Cleary PD: Linking clinical variables with health
related quality of life. A conceptual model of patient out-
comes. Journal of the American Medical Association 1995, 273:59-65.
5. Smith KW, Avis NE, Assmann SF: Distinguishing between quality
of life and health status in quality of life research: A meta
analysis. Quality of Life Research 1999, 8:447-59.
6. Hush JM, Refshauge K, Sullivan G, De Souza L, Maher CG, McAuley
JH: Recovery: What does this mean to patients with low back
pain? Arthritis & Rheumatism (Arthritis Care & Research) 2009,
61(1):124-31.
7. Carnes D, Underwood M: The importance of monitoring
patient's ability to achieve functional tasks in those with
musculoskeletal pain. International Journal of Osteopathic Medicine
2008, 11:26-32.
8. Jolles BM, Buchbinder R, Beaton DE: A study compared nine
patient-specific indices for musculoskeletal disorders. Journal
of Clinical Epidemiology 2005, 58:791-801.
9. Beaton DE, Hogg-Johnson S, Bombardier C: Evaluating changes in
health status: reliability and responsiveness of five generic
health status measures in workers with musculoskeletal dis-
orders. Journal of Clinical Epidemiology 1997, 50:79-93.
10. Mullis R, Barber J, Lewis M, Hay M: The ICF Core Sets for low back
pain: Do they include what matters to patients? Journal of
Rehabilitation Medicine 2007, 39(5):353-7.
11. Hay EM, Mullis R, Lewis M, Vohora K, Main CJ, Watson P, Dziedzic
KS, Sim J, Minns Lowe C, Croft PR: Comparison of physical treat-
ments versus a brief pain management programme for back
pain in primary care: a randomised clinical trial in physio-
therapy practice. Lancet 2005, 365:2024-30.
12. EuroQol Group: EuroQol – a new facility for the measurement
of health related quality of life. Health Policy 1990,
16(3):199-208.
13. Siegel S, Castellan NJ: Nonparametric statistics for the behavioral sciences
2nd edition. New York: McGraw-Hill; 1988.
14. Dunn KM, Croft PR: Classification of low back pain in primary
care: using "bothersomeness" to identify the most severe
cases. Spine 2005, 30(16):1887-92.
Boxplot showing change on usual activities with change in condition of back at 12 monthsFigure 7
Boxplot showing change on usual activities with
change in condition of back at 12 months.
12 Months Condition of Back
much worseworsesamebettermuch bettercompletely
better
12 Months Change in Usual Activties
2
1
0
-1
-2