báo cáo hóa học: " Self-reported physical and mental health status and quality of life in adolescents: a latent variable mediation model" doc
Bạn đang xem bản rút gọn của tài liệu. Xem và tải ngay bản đầy đủ của tài liệu tại đây (572.61 KB, 11 trang )
RESEARC H Open Access
Self-reported physical and mental health status
and quality of life in adolescents: a latent variable
mediation model
Richard Sawatzky
1*
, Pamela A Ratner
2
, Joy L Johnson
2
, Jacek A Kopec
3
, Bruno D Zumbo
4
Abstract
Background: We examined adolescents’ differentiation of their self-reported physical and mental health status, the
relative importance of these variables and five important life domains (satisfaction with family, friends, living
environment, school and self) with respect to adolescents ’ global quality of life (QOL), and the extent to which the
five life domains mediate the relationships between self-reported physical and mental health status and global
QOL.
Methods: The data were obtained via a cross-sectional health survey of 8,225 adolescents in 49 schools in British
Columbia, Canada. Structural equation modeling was applied to test the implied latent variable mediation model.
The Pratt index (d) was used to evaluate variable importance.
Results: Relative to one another, self-reported mental health status was found to be more strongly associated with
depressive symptoms, and self-reported physical health status more strongly associated with physical activity. Self-
reported physical and mental health status and the five life domains explained 76% of the variance in global QOL.
Relatively poorer mental health and physical health were significantly associated with lower satisfaction in each of
the life domains. Glo bal QOL was predominantly explained by three of the variables: mental health status (d =
30%), satisfaction with self (d = 42%), and satisfaction with family (d = 20%). Satisfaction with self and family were
the predominant mediators of mental health and global QOL (45% total mediation), and of physical health and
global QOL (68% total mediation).
Conclusions: This study provides support for the validity and relevance of differentiating self-reported physical and
mental health status in adolescent health surveys. Self-reported mental health status and, to a lesser extent, self-
reported physical health status were associated with significant differences in the adolescents’ satisfaction with
their family, friends, living environment, school experiences, self, and their global QOL. Questions about
adolescents’ self-reported physical and mental health status and their experiences with these life domains require
more research attention so as to target appropriate supportive services, particularly for adolescents with mental or
physical health challenges.
Background
Health researchers and providers increasingly recognize
the importance of obtaining information about adoles-
cents’ perspectives of their quality of life (QOL) [1-10].
Several instruments have been developed for the measure-
ment of adolescents’ QOL to examine the impact of health
care interventions, supportive services, and health
promotion initiatives [e.g., [3,8,11,12]]. These instruments
typically consist of subscales that represent experiences
with various conditions in life (a.k.a. life domains) that are
of general relevance to adolescents, including their per-
ceived: (a) self (e.g., self-esteem), (b) relationships with
friends and family, (c) experiences at school, and (d) living
environment [13,14]. Often, the subscale scores are com-
bined to obtain an overall, or global, QOL score. Other
instruments include one or more general questions for the
measurement of adolescents’ global QOL in terms of their
happiness or satisfaction with their lives. Despite the
* Correspondence:
1
School of Nursing, Trinity Western University, 7600 Glover Road, Langley,
British Columbia (BC) V2Y 1Y1, Canada
Sawatzky et al. Health and Quality of Life Outcomes 2010, 8:17
/>© 2010 Sawatzky et al; licensee BioMed Central Ltd. This is an Open Access article distributed under the terms of the Creative
Commons Attribution License ( which permits unrestricted use, distribution, and
reprodu ction in any medium, provided the original work is properly cited.
increasing availability of such instruments, the relation-
ships among adolescents’ self-reported health status (a.k.a.
perceived or self-rated health status), their experiences
with particular conditions in life, and their global QOL
have not been examined extensively.
Several conceptual models have been developed to
describe the relationships between health and QOL in
adults [15-22]. Most of these models emphasize asses-
sing QOL from the perspective of the individual, and
are based on the general proposition that alterations in
health status affect other conditions in life (life
domains), such as physical and psychological function-
ing, and social and environmental conditions, that are
relevant to a person’s QOL [e.g., [15,20-22]]. For exam-
ple, Wilson and Cleary [15] introduced a very useful
model of health and Q OL wherein alterations in one’s
physiological condition (e.g., disease) result in physical
and psychological changes that affect functional status,
general health perceptions, and global or overall QOL.
Concepts pertaining to characteristics of the individual
(e.g., motivation and values) and characteristics of the
environment (e.g., social support) are also taken into
account. However, the relationship between self-reported
health status and QOL is not expounded in the model;
in particular, it is not clear how self-reported health sta-
tus relates to other life domains relevant to QOL.
There is compelling empirical support for the associa-
tions between self-reported health status and QOL in gen-
eral adult populations. A meta-analysis by Smith, Avis,
and Assmann [23] showed that variation in QOL is
explained by several life domains that are affected by dif-
ferences in physiological health status (e.g., the presence of
disease) and symptom severity. Their “model of the deter-
minants of quality of life” (p. 448) is based on the proposi-
tion that the life domains mediate the associations
between symptom severity and physiological health status,
and QOL. Their regression analyses revealed that, relative
to physical and social function, mental health status was
by far the most important variable explaining QOL. Beckie
and Hayduk [24], using structural equation modeling,
similarly demonstrated that indicators of health status
could be viewed as e xplanatory variables of QOL. Based
on a study of adults who underwent coronary artery
bypass graft surgery, they found that the eight health indi-
cators measured by the Short-Form 36-item instrument
(SF-36) [25] explained 67% of the variance in QOL, and
that the effects of general health perceptions and mental
health status were the most substantial. They concluded
that “quality of life can be considered as a global personal
ass essm ent of a single dimension , which may be causally
responsive to a variety of other distinct dimensions includ-
ing dimensions such as health” (p. 281).
Several other researchers have examined the associations
among self-reported health status, various life domains,
and global QOL in adult populations [e.g., [26-28]]. How-
ever, information about these associations in adolescent
populations is relatively sparse. The potential relevance of
self-reported health status with respect to adolescents’
QOL was shown in a study by Zullig et al. [29] who found
that, in a sample of high-school students in South Carolina
(U.S.A.), adolescents’ self-reported health status was mod-
estly correlated (r ranging from .09 to .22) with five life
domains (satisfaction with family,friends,school,living
environment, and self) and overall life satisfaction (r =
.21). Other research has shown that adolescents’ self-
reported health status is associated with various health
indicators, including physical activity, nutritional status,
health-risk behavior, and physical disability [29-32].
Although these studies provide support for the measure-
ment of adolescents’ self-reported general health status,
the differentiation of adolescents ’ self-reported physical
and mental health stat us has not been extensively exam-
ined. Consequently, it is not known to what extent adoles-
cents differentiate their physical and mental health status
and whether this differentiation is relevant with respect to
their global QOL and particular life domains.
Study objectives
We designed a study to: (a) validate adolescents’ differen-
tiation of their self-reported physical and mental health
status and (b) examine the associati ons of these variables
with glob al QOL and s everal relevant life domains,
including adolescents’ satisfaction with their family,
friends, living environment, school, and self. With respect
to the first objective, we hypothesized that, relative to one
another, self-reported physical health status would be
more strongly associated with physical activity, and self-
repo rted mental health status with depressiv e symptoms.
Drawing on the previously mentioned conceptual models
and empirical research on health and QOL, we f urther
sought to obtain information about (a) the relative
importance of self-reported physical and mental health
status with respect to adolescents’ global QO L and sev-
eral life domains and (b) the extent to which the relation-
ships among self-reported physical and mental health
statusand global Q OL are mediated by the life domains
(see Figure 1). Global QOL is viewed here as a unidimen-
sional construct that pertains to individuals’ satisfaction
with, or appreciation of, their lives overall[18,30-32]. The
life domains represent adolescents’ satisfaction with var-
ious conditions in life that have the potential to contri-
bute to their global QOL [33].
Methods
Sampling
The data were obtained via the British Columbia Youth
Survey on Smoking and Health 2 (BCYSOSHII), a cross-
sectional health survey that was conducted in 2004 to
Sawatzky et al. Health and Quality of Life Outcomes 2010, 8:17
/>Page 2 of 11
obtain information about tobacco dependence, drug and
health-related behavior, and quality of life in adolescents
in grades 7 to 12 in schools in the province of British
Columbia (BC), Canada. The methods of this survey
have been described in detail in several published stu-
dies [e.g., [34-39]]. The survey avoided two regional dis-
tricts within the province that were known to have very
low smoking prevalence rates so as to b e cost-efficient
in assembling a sample of adolescents that us ed tobacco
(the primary purpose of the principal study). Nineteen
of the 60 school districts in BC were sampled to achieve
maximal geographic coverage of regional districts
(remote and sparsely populated areas were not sur-
veyed). Fourteen of the school district administrators
provided permission for their schools to participate.
This resulted in a sample of 89 eligib le schools, ofwhich
49 (42 secondary schools, 5 alternative schools, and 2
middle schools) agreed to participate. Passive parental
consent was obtained by providing parents with letters
that informed them of the survey. Ethical approval was
granted by the Behavioura l Research Ethics Board of the
University of British Columbia.
The survey questionnaire was administered by
research assistants during class-time hours in pen and
paper format (79.6%) or through a computer-based for-
mat (20.4%). The format was primarily determined by
the availability of computers in the various schools. Less
than 1% of the students refused to participate and the
response rate within schools was 84%, on average (non-
response was mostly due to student absenteeism)
[34,36]. The resulting sample consisted of 8,225 adoles-
cents (smokers and non-smokers).
Measurement
Self-reported physical and mental health status were
measured using two questions, “ How would you rate
your physical health?” and “ How would you rate your
emotional or mental health?” with the following
response options, which were taken from the general
health status question of the SF-36 [25 ] and wh ich are
widely used in the national population health surveys of
many countries: “excellent” (coded as “5” ), “very good,”
“good,”“fair,” or “poor” (coded as “ 1” ). The v alidity of
measuring adolescents’ self-reported general health sta-
tus in this manner is supported by observed associations
with various other health status indicators, including
physical activity, nutrition, health-risk behavior, and
physical disability [40-43]. Study findings have consis-
tently revealed that a relative increase in adolescents’
self-reported general health status is associated with less
health-risk behavior and fewer days of limited activity
[41,43].
To v alidate adolescents’ differentiation of their physi-
cal and men ta l health status, we examined the relative
importance of these variables with respect to depressive
symptoms and the frequency of physical activities.
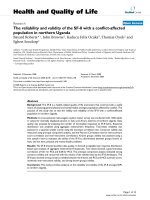
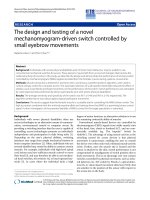
Figure 1 Structural model of the relationships between self-reporte d physical and mental health status, domains of life satisfaction,
and global QOL. Notes: N = 6,932, WLSMV c
2
(178) = 2,083.22 - 2,010.02, RMSEA = .049, CFI = .951. The variances of all latent factors were fixed
at 1.0 for model identification. The measurement structures of the latent factors for each of the life domains are identical to those reported by
Sawatzky et al. [37] (these are not shown here because of space limitations). All parameter values are standardized. The corresponding
unstandardized parameters are provided in Table 4.
1
Self-reported physical and mental health status were modeled as two ordinal variables with
a latent factor that accounts for their correlation (not shown here). *p < .05.
Sawatzky et al. Health and Quality of Life Outcomes 2010, 8:17
/>Page 3 of 11
Depressive symptoms were measured using 12 items
from the Center of Epidemiologic Studies Depression
Scale (CES-D) [44]. The adolescents were asked: “How
often have you felt or behaved in t he following manner
in the past week (7 days)?” (e.g., “ hopeful about the
future,”“happy,”“lonely,”“sad” ). The CES-D provides
four response options ranging from “rarely or none of
the time (less than one day)” (coded as “0”)to“most or
all of the time (5-7 days)” (coded as “ 3” ). The total
score, with a possible range of 0 (no depressive symp-
toms) to 36, was used in the analysis. The estimated
reliability of the 12 items is .87 in this sample (based on
the ordinal Cronbach alpha reliability estimate [45]).
Physical activity was measured using the following ques-
tion adapted from several large surveys (e.g., The USA
Youth Risk Behavior Survey [46] and The Ontario Drug
Use Survey [47]): “On how many of the last 7 days did
you exercise or participate in sports activities for at least
20 minutes t hat made y ou sweat and breathe hard? If
none, enter ‘0’ days. Please include activities such as bas-
ketball, jogging, swimming, cross-country skiing, hockey,
or dance, that you participated in either at school or
outside of school.”
An abridged version of Huebner’s Multidimensional
Students’ Life Satisfaction Scale (MSLSS) [48] was used
to measure adolescents’ satisfaction with five life
domains, including their family (4 items), school (4
items), living environment (2 items), friends (4 items)
and self (4 items) [37]. The original MSLSS consists of
40 items, of which 10 are negatively worded. The psy-
chometric analyses reported by Sawatzky e t al. [37]
revealed that the adolescents may not have interpreted
and responded to all items in the same way. There were
inconsistencies in the responses to the negatively
worded items and several other items. An a bridged 18-
item version was developed by identifying those items
that were found to be most invariant (all positively
worded). Confirmatory factor analyses (CFA) provided
support for its construct validity when allowing for a
few theoretically defensible modifications [37]. The
same measurement s tructu re was u sed to rep resent the
five life domains as latent f actors in the study reported
herein. The ordinal Cronbach alpha reliability estimates
[45] of the abridged subscales with four items were ≥
.80 in this sample. A six-point ordinal response format
(with response optio ns ranging from “strongly disagree”
(coded as “ 1” )to“strongly agree” (coded as “6” )) was
used [49].
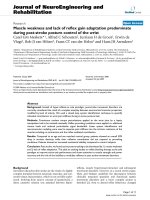
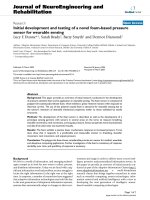
Global QOL was measured with two items. The ado-
lescents were asked to appraise their QOL using a pic-
ture of an eight-rung ladder (Cantril’s self-anchoring
ladder [50], referred to here as the QOL-ladder) (see
Figure 2). The bottom run was coded as “1” and the top
as
“ 8” . The adolescents also were asked to rate their
agreement with the statement, “I am satisfied with my
quality of life” with four response options ranging fro m
“ strongly disagree” (coded as “1” )to“ strongly agree”
(coded as “4”). General questions of this nature, includ-
ing Cantril’s self-anchoring ladder, have been widely
used in surveys for the measurement of various concepts
such as global QOL [51-53]. A latent factor explaining
the variance in both of these variables was used to
represent global QOL.
The adolescents were asked to indicate their age and
sex, and to answer several questions a bout their e thnic
identity and living arrangements. Ethnic identity was
determined by asking, “How would you describe your-
self?” The 12 response o ptions were adapt ed from Sta-
tistics Canada’s [54] classification of “visible minorit ies”
(e.g., “white/Caucasian,” Aboriginal/First Nation, Chi-
nese, South East Asian). The adolescents selected one or
more responses, which were subsequently grouped as:
“white/Caucasia n,” Asian (including Chinese, Japanese,
Korean, South East Asian, and Filipino), Aboriginal/First
Nation, and “ other.” With respect to their living
arrangements, the adolescents were asked, “Which par-
ent or parents do you currently live with most of the
time?” with eight response options (i.e., mother, father,
step-mother, step-father, guar dian(s), foster parent(s),
grandparent(s), and other please specify).
Statistical methods
Structural equation modeling was used to e xamine the
hypothesized relationships b yfittingalatentvariable
mediation model to the sample data (see Figure 1). The
variances of the latent factors were specified to equal
one to avoid indeterminancy and to set the metric of
the latent factors [55]. Polychoric correlations were used
to avoid obtaining biased parameter estimates due to
the ordinal distributions of the observed variables
[56-58]. The MPlus 5.2 software [59] was used to esti-
mate the model parameters by specifying a probit link
function and using a mean and variance adjusted
weighted-least squares estimation method (WLSMV)
suitable for ordinal data [60]. Model fit was evaluated
with several global fit indices, and by comparing the dif-
ferences between the implied and the observed polycho-
ric correlation matrices. Adequate model fit was defined
by a root mean square error of approximation (RMSEA)
of < .06 [61] and a comparative fit index (CFI) of ≥ .95
[62]. In addition, the pattern and magnitudes of the resi-
dual correlations were examined to locate any specific
areas of misfit [63,64]. The percentage of residual corre-
lations with absol ute values greater than .10 is provided
as a summary of this direct comparison.
The relative importance of the explanatory variables
was determined by the Pratt index (d) [65], which quan-
tifies each variable’ s contribution to the explained
Sawatzky et al. Health and Quality of Life Outcomes 2010, 8:17
/>Page 4 of 11
variance (irrespective of the magnitude of the R-
squared), measured as a percentage. The extent to
which the two relationships between global QOL and
physical and mental health status were mediated by the
life domains was evaluated as the division of t he indir-
ect-effects (mediated by the life domains) and the total
effect (the sum of the direct- and indirect-effects for the
associations between global QOL and physical and men-
tal health status), expressed as a percentage [66]. The
standard error of the indirect effects was calculated
using the Delta method, which i s similar to the
approach used in the Sobel test [67].
Of the 8,225 adolescents, 920 did not provide responses
to any of the MS LSS questions. The analysis was limited
to those who r esponded to the global QOL items, the
items measuring menta l or physical health status , and at
least one of the MSLSS items (N = 6,932). Multiple impu-
tation (MI) [68] was used to impute any remaining miss-
ing responses (2.5% imputed data). The results were
compared with those obtained using MI for the subsample
of adolescents who provided a value for at least one of the
analysis variables (N = 8,174; 13.9% imputed data). The
SAS 9.2 software package [69] was used to create 10
imputed datasets for the MI analyses, following the guide-
lines offered by Allison [70] and Enders [71], to assess
convergence and to incorporate a uxiliary variables (i.e.,
demographic variables (sex, ethnicity, school grade), symp-
toms of depression, and two variables pertaining to the
adolescents’ experiences at school).
Results
Sample description
The sample consisted of an approximately equal propor-
tion of boys and girls in grades 7 through 12 (see Table
1). The average age was 15.2 years (SD = 1.5, n = 8,054)
with 7,964 adolescents being between 12 and 18 years.
Although most of the adolescents who identified their
ethni city (n = 7,882) self-ident ified as “white/Caucasian”
(72.6%), the sample also included Aboriginal adolescents
(16.5%), Asian adolescents (Chinese, Japan ese, Korean,
Filipino, or South-East Asian) (5.8%), and adolescents
belonging to one or more other groups (5.1%). A size-
able percentage (17.3% of 7,994 adolescents) i ndicated
regularly speaking a language other than E nglish, and
6.9% of 8,058 reported being born in a country other
than Canada.
Most of the adolescents agreed or strongly agreed to
being satisfied with their QOL (82.3% of 7,606 adoles-
cents)(seeTable1).ThemodeoftheQOL-ladder
responses was at level 6 of 8 rungs (36.7%), with 11.9%
of the ado lescents reporting the best possible life, and
14.0% providing a rating at or below the middle of the
scale (≤ 4) (n = 7,675).
The measurement of self-reported physical and mental
health status
The joint- and margi nal-distributions of self-reported
physical and mental health status are provided in Table
2. The corresponding conditional distributions provide
support for adolescents’ ability to differentiate these
variables. For example, 9.5% of the adolescents who
rated their physical health as good or better rated their
mental health as fair or poor, and 5.3% of the adoles-
cents who rated their mental health as good or better
rated their physical health as fair or poor. The p olycho-
ric correlation was .55, indicating a shared variance of
only 30% among these two (underlying) variables. With
respect to the differentiation of mental and physical
Figure 2 Quality of life ladder. Notes: Derived from Cantr il’s self-anchoring ladder [50]. An error resulted in 8 rungs being presented in th e
paper-based version whereas 10 rungs were presented in the computer version. To remedy this, we rescaled the QOL-ladder for the computer-
and paper-based versions to their common denominator by multiplying the computer-based version of the QOL-ladder by 0.8 and rounding the
resulting scores to zero decimals.
Sawatzky et al. Health and Quality of Life Outcomes 2010, 8:17
/>Page 5 of 11
health status (see Table 3), we found that 94% (d,Pratt
Index) of the explained variance in depressive symptoms
(R
2
= 35.5%) could be attributed to mental health status
(the remai ning 6% was attributed to physi cal health sta-
tus). Conversely, relativ e to self-reported physical health
status, self-reported mental health status accounted for
only 18% of the e xplained variance in physical activity
(R
2
= 7.7%) (see Table 3).
The associations between health status and quality of life
The hypothesized model with the life domains operating
as mediators of the relationships between self-reported
physical and mental health status and global QOL
resulted in acceptable overall fit (WLSMV c
2
ranging
from 2,083.22 to 2,010.02 for the 10 MI datasets (N =
6,932), RMSEA = .0 49, CFI = .951, residual correla tions
ranging from 07 to .07) (see Figure 1). Satisfaction
with family, friends, school, living-environment, and self,
and self-reported physical and m ental health status
explained 76.1% of the variance in global QOL.
Although self-reported physical and mental health status
were bivariately significantly correlated with global QOL
(r = .49 and .70, respectively), their associations were
substantially smaller, albeit statistically significant, in the
multivariate model (see Table 4). The life domains also
were bivariately significantly correlated with global
QOL. However, re latively small and statistically non-sig-
nificant regression coefficients were obtained for satis-
faction with friends and satisfaction with school in the
multivariate model (see Table 4). These variables
accounted for less than 2% (d, Pratt Index) of the
explained variance relative to the other variable s in the
model (see Table 4). Global QOL was mostly explained
by satisfaction with self (d = 42%), self-reported mental
health status (d = 30%), and satisfaction with family (d
= 20%). Self-reported physical health status accounted
for only 3% of the explained variance.
Self-reported physical and mental health status were
significantly correlated with each of the life domains
(r
physical health
ranging from .22 to .45; r
mental health
ran-
ging from .27 to .54), and they predominantly explained
satisfaction with self (R
2
= 33.0%), and, to a lesser
extent, satisfaction with family (R
2
= 16.9%), friends (R
2
= 11.3%), and living environment (R
2
= 14.2%) (see
Table 5). Only 7.9% of the variance in satisfaction with
school was explained by self-reported physical and men-
tal health status. Relative to self-reported physical health
status, most of the variance in each of the life satisfac-
tion dimensions could be attributed to the adolescents’
self-reported mental health status ( d ranging from 68%
to 87% for each of the life domains) (see Table 5).
The parameters for the relationships between physical
and mental health status, the life domains, and global
QOL were used to determine the magnitude of the total
and the indirect relationships between physical and
mental health status and global QOL as mediated by
each of the life domains (see Table 6). The standardized
total effect on global QOL was larger f or self-reported
mental health status (b = .61), while adjusting for self-
reported physical health status, than for self-reported
physical health status (b = .17), while adjusting for self-
reported mental health status. These relationships were
partially mediated by the life domains (67.8% total med-
iation for physical health and 45.4% total mediation for
mental health status). The relationships between the two
health status variables and global QOL were primarily
mediated by satisfaction with self (54.0% mediation for
self-reported physical health and 29.1% mediation for
self-reported mental health) and, to a l esser extent, by
satisfaction w ith family (10.8% mediation for self-
reported physical health an d 13.7% mediation for self-
reported mental health).
Discussion
This study provides support for (a) the notion that ado-
lescents can differentiate between physical and mental
health when they provide reports of their health status
and (b) the relevance of this differentiati on with respect
to five life domains and global QOL. The results
Table 1 Sample description
Variable Percentage
Minority status (N = 7,882)
No, “white” 72.6%
Yes, Asian 5.8%
Yes, Aboriginal 16.5%
Other or mixed 5.1%
Sex (N = 8,163)
Male 49.8%
Female 50.2%
Grade (N = 8,074)
Grades 7 or 8 23.2%
Grade 9 19.4%
Grade 10 23.7%
Grade 11 21.1%
Grade 12 or “other” 12.6%
Living arrangements (N = 7,582)
Lives with mother and father 59.9%
Lives with mother and not father 25.7%
Lives with father and not mother 7.8%
Does not live with mother or father 6.7%
Satisfied with quality of life (N=7,606)
Strongly disagree 4.6%
Disagree 13.0%
Agree 52.7%
Strongly agree 29.6%
Percentages may not sum to exactly 100% due to rounding.
Sawatzky et al. Health and Quality of Life Outcomes 2010, 8:17
/>Page 6 of 11
revealed that relatively poorer self-reported physical and
mental health status were significantly associated with
lower global QOL and lower satisfaction with each of
the life domains. The adolescents’ global QOL was pre-
dominantly explained by mental health status and by
their satisfaction with self and family. Satisfaction with
self and family were the main mediating variables for
the relationships between mental health status (45.4%
total mediation) and physical health status (67.8% total
mediation) and global QOL.
Other studies have shown that self-reported general
health status is significantly associated with health-pro-
moting and health-risk behavior [40-43] and with var-
ious life domains and global QOL [29]. Our study
contributes to this area of research by providing preli-
minary support for the validity and the relevance of dis-
tinguishing between adolescents’ self-reports of their
physical and mental health sta tus. The findings suggest
that, relative to one another, self-reported mental health
status is more strongly associated with depressive symp-
toms and physical health status with physical activity.
Although further research is needed to examine the
validity and relevance of these variables with respect to
other research objectives (e.g., their associations with
particular health-risk behavior), the current findings
suggest that the use of two self-report items for the
measurement of adolescents’ physical and mental health
status could contribute valuable information in popula-
tion-based adolescent health surveys.
There were substantial differences in the associations
between self-reported physical and mental health status
and adolescents’ global QOL and the five life do mains.
The correlations with self-reported mental health status
were greater than were those with physical health status.
This finding is congruent with a study by Zullig et al.
[29] who found that, relative to the self-reported number
of days with poor physical health, the number of poor
mental health days was more strongly correlated w ith
adolescents’ overall life satisfaction (r = 27 versus 15)
and their satisfaction with their family (r = 25versus
14), friends (r = 10 versus 07), living environment
(r = 15 versus 10), school (r = 15 versus 12) and
their self perception (r = 29 versus 2 1). However, in
our study, the correlations with global QOL (r
physical health
= .49; r
mental he alth
= .70), and each of the life domains
(r
physical health
ranging from .22 to .45; r
mental health
ranging
from .27 to .54;) were relatively stronger. It is possible
that the measurement of self-reported physical and men-
tal health status (rather than the number of poor physical
and mental health days), and the use of the abridged
MSLSS for the five life domains (rather than the use of
single items for each of the life domains), resulted in
greater sensitivity to detect these associations.
In addition to these bivariate associations, our study
provides information a bout the relative importance of
self-reported physical and mental health status and the
five life domains in explaining global QOL in
Table 2 Joint and marginal distributions of self-reported physical and mental health status
Mental health
Physical health Excellent Very good Good Fair Poor Total
excellent 1,367 (17.6%) 502 (6.4%) 156 (2.0%) 49 (0.6%) 30 (0.4%) 2,104 (27.0%)
very good 876 (11.3%) 1,333 (17.1%) 563 (7.2%) 160 (2.1%) 39 (0.5%) 2,971 (38.2%)
good 316 (4.1%) 615 (7.9%) 739 (9.5%) 315 (4.0%) 82 (1.1%) 2,067 (26.6%)
fair 53 (0.7%) 89 (1.1%) 181 (2.3%) 167 (2.1%) 52 (0.7%) 542 (7.0%)
poor 15 (0.2%) 7 (0.1%) 18 (0.2%) 25 (0.3%) 35 (0.5%) 100 (1.3%)
total 2,627 (33.7%) 2,546 (32.7%) 1,657 (21.3%) 716 (9.2%) 238 (3.1%) 7,784
All percentages are of the total sample.
Table 3 Relationships between self-reported physical and
mental health status and depressive symptoms and
frequency of physical activity
Variable bSEb b rd
Depressive symptoms (N = 7,985; R
2
= 35.5%)
Physical health -0.46 0.09 06 33 6%
Mental health -3.73 0.08 56 59 94%
Physical activity (N = 7,033; R
2
= 7.7%)
Physical health 0.68 0.04 .24 .27 82%
Mental health 0.18 0.03 .07 .19 18%
Notes: r = bivariate polyserial correlations, d = Pratt Index. All parameter
estimates are statistically significant (p < .05).
Table 4 Relative importance of variables explaining
global QOL
Variable bSEBb rd
Family 0.29* 0.03 .23* .66* 20%
Friends -0.02* 0.02 02* .51* 0%
School 0.02* 0.01 .02* .40* 1%
Living environment 0.05* 0.02 .05* .56* 4%
Self 0.62* 0.03 .41* .78* 42%
Mental health 0.26* 0.01 .33* .70* 30%
Physical health 0.04* 0.01 .05* .49* 3%
Notes: r = bivariate correlation with the latent global QOL variable, d = Pratt
index. N = 6,932. R
2
= 76%. * p < .05.
Sawatzky et al. Health and Quality of Life Outcomes 2010, 8:17
/>Page 7 of 11
adolescents. The results revealed that self-reported phy-
sical health status contributed minimally to global QOL
when controlling for the other variables in the model;
its association with global QOL was significantly con-
founded by self-reported mental health status and the
five life domains. Self-reported mental health status was
relatively more important with respect to each of the
life domains, and it was the second most important
explanatory variable for global QOL. These findings pro-
vide support for attending to the mental health needs of
adolescents.
With respect to each of the life domains, we found
that most of the variance in global QOL could be attrib-
uted to the adolescents’ satisfaction with themselves and
their families. The associations between satisfaction with
friends and school and global QOL were not statistically
significant in the multivar iate model. These findings are
congru ent with a study by Gilman [72] who found that,
in a sample of 321 high-school students in a Southeast-
ern US s tate, the associations between sa tisfaction with
friends and school and global QOL wer e relatively small
when controlling for the other life domains. It is possi-
ble that adolescents’ satisfaction with their friends and
their school is associated with their satisfac tion with
their family, and that these associations are therefore
confounded in the multivariate model. This is an impor-
tant area for further study.
An important theoretical conclusion to be drawn from
these findings is that self-reported physical and mental
health status and the life domains can be viewed as con-
ditions that contribute t o global QOL in adolescents.
These relationships are fundamentally different from
those implied by the common practice of deriving global
QOL scores from the combined scores of particular life
domains. Many multidimensional instruments designed
to measure QOL are based on the assumption that
scores pertaining to various life domains can b e com-
bined so as to obtain an overall (general) QOL score.
For instance, it has been argued that an overall QOL
score could be obtained by averaging the scores of the
five life domain subscales of the MSLSS [49,73,74]. The
theoretical premise of this approach is that the experi-
ences in the various life domains reflect, or arise from,a
common source, labeled global QOL. This premise is
not congruent with the previously noted conceptualiza-
tion of life domains as conditions that contribute to
QOL. Our analyses demonstrate a different approach
that is congruent with the conceptualization of QOL as
a global concept that i s partially explained by various
contributing conditions, s uch as h ealth status and peo-
ple’s experiences with various other aspects of life (life
domains) [23,24,26-28,32,33].
There are several limitations to this study that must
be taken into account. First, the cross-sectional nature
of this analysis does not warrant conclusive statements
about the causal nature of the relationships. Claims
Table 5 Relative importance of variables explaining the
dimensions of life satisfaction
Variable bSEBb rd
Explaining satisfaction with family (R
2
= 16.9%)
Physical health 0.05 0.01 .08 .27 13%
Mental health 0.23 0.01 .36 .41 87%
Explaining satisfaction with friends (R
2
= 11.3%)
Physical health 0.07 0.02 .09 .24 19%
Mental health 0.24 0.01 .28 .33 81%
Explaining satisfaction with school (R
2
= 7.9%)
Physical health 0.09 0.01 .11 .22 32%
Mental health 0.17 0.01 .21 .27 68%
Explaining satisfaction with living environment (R
2
= 14.2%)
Physical health 0.07 0.01 .09 .26 16%
Mental health 0.28 0.02 .32 .37 84%
Explaining satisfaction with self (R
2
= 33.0%)
Physical health 0.11 0.01 .22 .45 30%
Mental health 0.22 0.01 .43 .54 70%
Notes: r = bivariate correlation with the latent variable, d = Pratt index. N =
6,932. All parameter estimates are statistically significant (p < .05).
Table 6 Mediation effects for physical and mental health status and global QOL
Effect of self-reported physical
health status on global QOL
Effect of self-reported mental
health status on global QOL
Mediating variable B
indirect
SE B % mediation B
indirect
SE B % mediation
Family
1
0.01 0.00 10.8% 0.07 0.01 13.7%
Friends
1
-0.00 0.00 -1.0% -0.00 0.00 -0.8%
Living
1
0.00 0.00 2.8% 0.01 0.01 2.8%
School
1
0.00 0.00 1.2% 0.00 0.00 0.6%
Self
1
0.07 0.01 54.0% 0.14 0.01 29.1%
Total indirect effects
2
0.08 67.8% 0.22 45.4%
Notes: Degree of mediation attributed to each satisfaction variable was calculated as the indirect effect for that variable divided by the total effect for physical or
mental health status. N = 6,932.
1
Indirect effect of physical or mental health status on global quality of life as mediated by one of the life domains.
2
Sum of all indirect effects for physical and mental health status explaining global quality of life.
Sawatzky et al. Health and Quality of Life Outcomes 2010, 8:17
/>Page 8 of 11
pertaining to the direction and causal nature of these
relationships require further investigation. Second,
although care was taken to limit the bias that may have
resulted from missing data, it is possible that there were
systematic differences between the adolescents who did
not respond to all the items in comparison with those
whodid.Third,itispossible that different magnitudes
of the observed relationships would be obtained in dif-
ferent populations, or groups, of adolescents. For
instance, the relative importance of the life domains
may be different for boys and girls or for adolescents
from different age-group s or cultural or socio-economic
backgrounds. We therefore recommend further research
to examine the differences in the magnitudes of the
associations between health status, important life
domains, and global QOL in different adolescent
populations.
Conclusions
This study provides support for a conceptual model of
self-repor ted physi cal and mental health status and sev-
eral life domains that contribute to adolescents’ global
QOL. Support is also provided f or the use of distinct
items to measure self-reporte d physical and mental
health status in adolescent population health surveys.
Mental health status and, to a lesser extent, physical
health status were associated with significant differences
in the adolescents’ appraisals of their family, friends, liv-
ing environment, school experi ences, self, and their glo-
bal QOL. Questions pertaining to these important life
domains require more attention in health assessments
and in population health research so as to target appro-
priate supportive services for adolescents with mental or
physical health challenges.
List of abbreviations
BCYSOSH II: British Columbia Youth Survey on Smok-
ing and Health 2; MSLSS: Multidimensional Students’
Life Satisfaction Scale; QOL: Quality of life; b:Standar-
dized regression coefficient; b: Unstandardized regres-
sion coefficient; CFI: Comparative fit index; d:Pratt
index; LR: Likelihood ratio; OR: Odds rat io; RMSEA:
Root mean square error of approximation; r: Correla-
tion; SE: Standard error; SD: Standard deviation;
WLSMV: Weighted least squared, mean and variance
adjusted.
Acknowledgements
This research was completed with support for doctoral research from the
Canadian Institutes of Health Research (CIHR), the Michael Smith Foundation
for Health Research (MSHFR), and the Canadian Nurses Foundation. Dr.
Kopec and Dr. Ratner hold Senior Scholar Awards from the MSFHR and Dr.
Johnson holds a CIHR Investigator Award. Funding for the survey research
was provided by the CIHR (grant #: MOP-62980).
Author details
1
School of Nursing, Trinity Western University, 7600 Glover Road, Langley,
British Columbia (BC) V2Y 1Y1, Canada.
2
School of Nursing, University of
British Columbia, 302-6190 Agronomy Road, Vancouver, BC V6T 1Z3, Canada.
3
School of Population and Public Health, University of British Columbia, 5804
Fairview Avenue, Vancouver, BC V6T 1Z3, Canada.
4
Department of ECPS,
Measurement, Evaluation & Research Methodology, Scarfe Building, 2125
Main Mall, Vancouver, BC V6T 1Z4, Canada.
Authors’ contributions
RS and PR designed and carried out the statistical analyses and drafted the
manuscript. JJ was the principal investigator for the British Columbia Youth
Survey on Smoking and Health 2. All authors contributed substantially to the
design of the study, the interpretation of the results, and the editing of the
manuscript. All authors read and approved the final manuscript.
Competing interests
The authors declare that they have no competing interests.
Received: 10 September 2009
Accepted: 3 February 2010 Published: 3 February 2010
References
1. Kaplan RM: Implication of quality of life assessment in public policy for
adolescent health. Measuring Health-Related Quality of Life in Children and
Adolescents Mahwah, NJ: Lawrence ErlbaumDrotar D 1998, 63-84.
2. Raphael D: Determinants of health of North-American adolescents:
evolving definitions, recent findings, and proposed research agenda. J
Adolesc Health 1996, 19:6-16.
3. Raphael D, Brown I, Rukholm E, Hill-Bailey P: Adolescent health: moving
from prevention to promotion through a quality of life approach. Can J
Public Health 1996, 87:81-83.
4. Dannerbeck A, Casas F, Sadurni M, Coenders G: Quality-of-Life Research on
Children and Adolescents Dordrecht, Netherlands: Kluwer 2004.
5. Topolski TD, Patrick DL, Edwards TC, Huebner CE, Connell FA, Mount KK:
Quality of life and health-risk behaviors among adolescents. J Adolesc
Health 2001, 29:426-435.
6. Wallander JL, Schmitt M, Koot HM: Quality of life measurement in
children and adolescents: issues, instruments, and applications. J Clin
Psychol 2001, 57:571-585.
7. Topolski TD, Edwards TC, Patrick DL: Toward youth self-report of health
and quality of life in population monitoring. Ambul Pediatr 2004,
4:387-394.
8. Huebner ES, Valois RF, Suldo SM, Smith LC, McKnight CG, Seligson JL,
Zullig KJ: Perceived quality of life: a neglected component of adolescent
health assessment and intervention. J Adolesc Health 2004, 34:270-278.
9. Koot HM, Wallander JL: Quality of Life in Child and Adolescent Illness:
Concepts, Methods and Findings Hove, East Sussex: Brunner-Routledge 2001.
10. Huebner ES, Nagle RJ, Suldo S: Quality of life assessment in child and
adolescent health care: the Multidimensional Students’ Life Satisfaction
Scale (MSLSS). Social Indicators Research Series 2003, 20:179-189.
11. Patrick DL, Edwards TC, Topolski TD: Adolescent quality of life, part II:
initial validation of a new instrument. J Adolesc 2002, 25:287-300.
12. Bradford R, Rutherford DL, John A: Quality of life in young people: ratings
and factor structure of the Quality of Life Profile-Adolescent Version. J
Adolesc 2002, 25:261-274.
13. Edwards TC, Huebner CE, Connell FA, Patrick DL: Adolescent quality of life,
part I: conceptual and measurement model. J Adolesc 2002, 25:275-286.
14. Huebner ES: Preliminary development and validation of a
multidimensional life satisfaction scale for children. Psychol Assess 1994,
6:149-158.
15. Wilson IB, Cleary PD: Linking clinical variables with health-related quality
of life. A conceptual model of patient outcomes. J Am Med Assoc 1995,
273:59-65.
16. Ferrans CE: Definitions and conceptual models of quality of life.
Outcomes Assessment in Cancer: Measures, Methods, and Applications
Cambridge, NY: Cambridge University PressLipscomb J, Gotay CC, Snyder C
2005, 14-30.
17. Vallerand AH, Payne JK: Theories and conceptual models to guide quality
of life research. Quality of Life From Nursing and Patient Perspectives: Theory,
Sawatzky et al. Health and Quality of Life Outcomes 2010, 8:17
/>Page 9 of 11
Research, Practice Sudbury, MA: Jones and BartlettKing CR, Hinds PS , 2
2003, 45-64.
18. Nordenfelt L: Quality of Life, Health and Happiness Aldershot, England:
Avebury 1993.
19. Michalos AC: Multiple discrepancies theory (MDT). Soc Indic Res 1985,
16:347-413.
20. Burckhardt CS: The impact of arthritis on quality of life. Nurs Res 1985,
34:11-16.
21. Padilla GV, Grant MM: Quality of life as a cancer nursing outcome
variable. ANS Adv Nurs Sci 1985, 8:45-60.
22. Patrick DL, Chiang YP: Measurement of health outcomes in treatment
effectiveness evaluations: conceptual and methodological challenges.
Med Care. 2000, 38(9 Suppl):II14-25.
23. Smith KW, Avis NE, Assmann SF: Distinguishing between quality of life
and health status in quality of life research: a meta-analysis. Qual Life Res
1999, 8:447-459.
24. Beckie TM, Hayduk LA: Using perceived health to test the construct-
related validity of global quality of life. Soc Indic Res 2004, 65:279-298.
25. Ware JE, Snow KK, Kosinski M, Gandek B: SF-36 Health Survey: Manual and
Interpretation Guide Boston, MA: The Health Institute, New England Medical
Center 1993.
26. Michalos AC, Hubley AM, Zumbo BD, Hemingway D: Health and other
aspects of the quality of life of older people. Soc Indic Res 2001,
54:239-274.
27. Michalos AC, Thommasen HV, Read R, Anderson N, Zumbo BD:
Determinants of health and the quality of life in the Bella Coola Valley.
Soc Indic Res 2005, 72:1-50.
28. Michalos AC, Zumbo BD, Hubley A: Health and the quality of life. Soc Indic
Res 2000, 51:245-286.
29. Zullig KJ, Valois RF, Drane JW: Adolescent distinctions between quality of
life and self-rated health in quality of life research. Health Qual Life
Outcomes 2005, 3:64.
30. Veenhoven R: The four qualities of life. J Happiness Stud 2000, 1:1-39.
31. Musschenga AW: The relation between concepts of quality-of-life, health
and happiness. J Med Philos 1997, 22:11-28.
32. Beckie TM, Hayduk LA: Measuring quality of life. Soc Indic Res 1997,
42:21-37.
33. Campbell A, Converse P, Rodgers WL: The Quality of American Life New
York: Sage 1976.
34. Tu AW, Ratner PA, Johnson JL: Gender differences in the correlates of
adolescents’ cannabis use. Subst Use Misuse 2008, 43:1438-1463.
35. Richardson CG, Johnson JL, Ratner PA, Zumbo BD: The influence of web-
versus paper-based formats on the assessment of tobacco dependence:
evaluating the measurement invariance of the Dimensions of Tobacco
Dependence Scale. Subst Abuse 2009, 3:1-14.
36. Richardson CG, Johnson JL, Ratner PA, Zumbo BD, Bottorff JL, Shoveller JA,
Prkachin KM: Validation of the Dimensions of Tobacco Dependence Scale
for adolescents. Addict Behav 2007, 32:1498-1504.
37. Sawatzky R, Ratner PA, Johnson JL, Kopec J, Zumbo BD: Sample
heterogeneity and the measurement structure of the Multidimensional
Students’ Life Satisfaction Scale. Soc Indic Res 2009, 94:273-296.
38. Okoli CT, Richardson CG, Ratner PA, Johnson JL: An examination of the
smoking identities and taxonomies of smoking behaviour of youth. Tob
Control 2008, 17:151-158.
39. Sawatzky R, Gadermann A, Pesut B: An investigation of the relationships
between spirituality, health status and quality of life in adolescents.
Applied Research in Quality of Life 2009, 4:5-22.
40. Wade TJ, Vingilis E: The development of self-rated health during
adolescence: an exploration of inter- and intra-cohort effects. Can J
Public Health 1999, 90:90-94.
41. Wade TJ, Pevalin DJ, Vingilis E: Revisiting student self-rated physical
health. J Adolesc 2000, 23:785-791.
42. Vingilis ER, Wade TJ, Seeley JS: Predictors of adolescent self-rated health:
analysis of the National Population Health Survey. Can J Public Health
2002, 93:193-197.
43. Vingilis ER, Wade TJ, Adlaf E: What factors predict student self-rated
physical health?. J Adolesc 1998, 21:83-97.
44. Radloff LS: The CES-D Scale: a self-report depression scale for research in
the general population. Appl psychol meas 1977, 1:385-401.
45. Zumbo BD, Gadermann AM, Zeisser C: Ordinal versions of coefficients
alpha and theta for Likert rating scales. J Mod Appl Stat Methods 2007,
6:21-29.
46. Brener ND, Kann L, Kinchen SA, Grunbaum JA, Whalen L, Eaton D,
Hawkins J, Ross JG: Methodology of the youth risk behavior surveillance
system. MMWR Recomm Rep 2004,
53:1-13.
47. Adlaf EM, Bacglia-Boak A, Beitchman JH, Wolfe D: The Mental Health and
Well-Being of Ontario Students, 1991-2007: Detailed OSDUS Findings Toronto,
ON: Centre for Addiction and Mental Health 2007 />Research/Areas_of_research/Population_Life_Course_Studies/OSDUS/
OSDUHS2007_MentalHealth_Detailed_Final.pdf.
48. Huebner ES: Manual for the Multidimensional Students’ Life Satisfaction Scale
Columbia: University of South Carolina 2001 />pdfdocs/huebslssmanual.doc.
49. Gilman R, Huebner ES, Laughlin JE: A first study of the Multidimensional
Students’ Life Satisfaction Scale with adolescents. Soc Indic Res 2000,
52:135-160.
50. Cantril H: Pattern of Human Concerns Piscataway, NJ: Rutgers University
Press 1966.
51. Fayers P, Machin D: Quality of Life: The Assessment, Analysis and
Interpretation of Patient-Reported Outcomes Chichester, West Sussex,
England: John Wiley & Sons 2007.
52. Andrews FM, Robinson JP: Measures of subjective well-being. Measures of
Personality and Social Psychological Attitudes San Diego: Academic
PressRobinson JP, Shaver PR, Wrightsman LS, Andrews FM, Robinson JP
1991, 61-110.
53. Bowling A: Measuring Health: A Review of Quality of Life Measurement Scales
Maidenhead, England: Open University Press, 3 2005.
54. Statistics Canada: Ethnicity Ottawa, ON: Statistics Canada 2003http://www.
statcan.ca/english/concepts/definitions/ethnicity.htm.
55. Schumacker RE, Lomax RG: A Beginner’s Guide to Structural Equation
Modeling Mahwah, NJ: Lawrence Erlbaum, 2 2004.
56. Millsap RE, Yun-Tein J: Assessing factorial invariance in ordered-
categorical measures. Multivariate Behav Res 2004, 39:479.
57. Jöreskog KG: New developments in LISREL: analysis of ordinal variables
using polychoric correlations and weighted least squares. Qual Quant
1990, 24:387-404.
58. Rigdon EE, Ferguson CE Jr: The performance of the polychoric correlation
coefficient and selected fitting functions in confirmatory factor analysis
with ordinal data. J Mark Res 1991, 28:491-497.
59. Muthén B, Muthén L: MPlus (version 5.2) Los Angeles, CA: Statmodel 2008.
60. Finney SJ, DiStefano C: Non-normal and categorical data in structural
equation modeling. Structural Equation Modeling: A Second Course
Greenwich, CT: Information Age PublishingHancock GR, Mueller RO 2006,
269-314.
61. Beauducel A, Herzberg PY: On the performance of maximum likelihood
versus means and variance adjusted weighted least squares estimation
in CFA. Struct equ modeling 2006, 13:186-203.
62. Yu CY: Evaluating cutoff criteria of model fit indices for latent variable
models with binary and continuous outcomes. PhD thesis University of
California, Department of Education 2002.
63. Hayduk LA: Lisrel: Issues, Debates, and Stragies London: The Johns Hopkins
University Press 1996.
64. McDonald RP, Ho MHR: Principles and practice in reporting structural
equation analyses. Psychol Methods
2002, 7:64-82.
65. Thomas DR, Hughes E, Zumbo BD: On variable importance in linear
regression. Soc Indic Res 1998, 45:253-275.
66. Mackinnon DP: Introduction to Statistical Mediation Analysis New York:
Lawrence Erlbaum Associates 2008.
67. Mackinnon DP, Dwyer JH: Estimating mediated effects in prevention
studies. Eval Rev 1993, 17:144-158.
68. Rubin DB: Multiple Imputation for Nonresponse in Surveys New York: Wiley
1987.
69. SAS Institute: Statistical Analysis Software (version 9.2) Cary, NC: Author 2005.
70. Allison PD: Missing Data Thousand Oaks, CA: Sage 2002.
71. Enders CK: Analyzing structural equation models with missing data.
Structural Equation Modeling: A Second Course Greenwich: Information Age
PublishingHancock GR, Mueller RO 2006, 313-342.
72. Gilman R: Validation of the Multidimensional Students’ Life Satisfaction
Scale with adolescents. PhD thesis University of South Carolina,
Department of Psychology 1999.
Sawatzky et al. Health and Quality of Life Outcomes 2010, 8:17
/>Page 10 of 11
73. Huebner ES, Gilman R: An introduction to the Multidimensional Students’
Life Satisfaction Scale. Soc Indic Res 2002, 60:115-122.
74. Huebner ES, Laughlin JE, Ash C, Gilman R: Further validation of the
Multidimensional Students’ Life Satisfaction Scale. J Psychoeduc Assess
1998, 16:118-134.
doi:10.1186/1477-7525-8-17
Cite this article as: Sawatzky et al.: Self-reported physical and mental
health status and quality of life in adolescents: a latent variable
mediation model. Health and Quality of Life Outcomes 2010 8:17.
Submit your next manuscript to BioMed Central
and take full advantage of:
• Convenient online submission
• Thorough peer review
• No space constraints or color figure charges
• Immediate publication on acceptance
• Inclusion in PubMed, CAS, Scopus and Google Scholar
• Research which is freely available for redistribution
Submit your manuscript at
www.biomedcentral.com/submit
Sawatzky et al. Health and Quality of Life Outcomes 2010, 8:17
/>Page 11 of 11