Climate Change and Water Resources in South Asia - Chapter 7 docx
Bạn đang xem bản rút gọn của tài liệu. Xem và tải ngay bản đầy đủ của tài liệu tại đây (1.35 MB, 42 trang )
7
Climatic Change - Implications for India’s
Water Resources
7.1 BACKGROUND
Water is vital to all forms of life on earth, from the simplest of living organisms to the most
complex of human systems. Lack of freshwater to drink, for use in industry and agriculture
and for multitude of other purposes where water is essential, is a limiting factor - perhaps
the most important factor - hindering development in many parts of the globe. In South
Asia, increasing water shortage and declining water quality from pollution during the past
few decades has drawn attention to the inherent fragility and scarcity of water and led to
concern about water availability to meet the requirements of the 21
st
century. Because of
increasing population and changing patterns of water use in South Asia, additional demand
is likely to be accompanied by a sharp decline in per capita water availability. While
consumption of 1,000 m
3
of water per year and per capita is considered a standard for
“well-being” in the developed world, projection of annual water availability per capita by
the year 2025 for South Asia is a mere 730 m
3
. This trend is declining in all parts of the
world, including those that are considered to have ample water resources.
With the growing recognition of such issues as the possibility of global climate change,
an increasing emphasis on the assessment of future availability of water on various spatial
and temporal scales is needed. A warmer climate will enhance the hydrological cycle,
which implies higher rates of evaporation, and a greater proportion of liquid precipitation
compared to solid precipitation; these physical mechanisms, associated with potential
changes in precipitation amount and seasonality, will affect soil moisture, ground water
reserves and the frequency of flood or drought episodes. The supply of water is limited and
governed by the renewal processes associated with the global hydrological cycle.
Future projections of changes in monsoon rainfall patterns are tenuous in currently
available global climate models. Moreover, it has been recognized now that the
superimposed modes of climatic variability (e.g., El Niño and Southern Oscillation), which
can disturb mean rainfall patterns on timescales ranging from seasons to decades, are
important mechanisms to take into account but are not well predicted by the global climate
models.
Water resources will come under increasing pressure in South Asia due to the
changing climate. Changes in climatic conditions will affect demand, supply and water
quality. In regions that are currently sensitive to water stress (arid and semi-arid regions of
M. LAL
Copyright © 2005 Taylor & Francis Group plc, London, UK
India), any shortfall in water supply will enhance competition for water use for a wide
range of economic, social and environmental applications. In the future, larger population
will lead to heightened demand for irrigation and perhaps industrialization at the expense
of drinking water. Disputes over water resources may well be a significant social
consequence in an environment degraded by pollution and stressed by climate change.
7.2 INDIA’S GEOGRAPHY, POPULATION AND WATER NEEDS
India is a land with diverse geographical and climatic endowments. This large expanse of
land (with 328 mha gross area) is bounded by the Himalayan range in the North and the sea
on three sides encompasses varied geographical and climatic zones ranging from the hot
desert of Thar in the Northwestern corner to the cold desert of Ladakh in the extreme
North, the arid region of the Rann of Kutch in the West to the world’s wettest place,
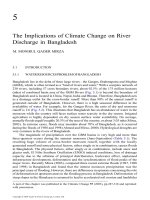
Cherrapunji, in the Northeast (Fig. 7.1). With the icy continent of Antarctica as its major
neighbor to the South with vast stretch of the Indian Ocean in between, India has the
world’s tallest wall (the Himalayas) on its Northern boundary. Adjoining the Himalayas
further North is the Tibetan plateau that is large, massive and about 5 km high - a gigantic
slab of rock protruding up to the middle of the troposphere and acting as a large sized heat
source at the mid-tropospheric level. Physiographically, India comprises of seven regions,
viz., (1) Northern Mountains (the Himalayas), (2) Indo-Gangetic Plains, (3) Central
Highlands, (4) Peninsular Plateau, (5) East Coast, (6) West Coast, and (7) the Islands
(Andaman & Nicobar group in the Bay of Bengal and Lakshadweep group in the Arabian
Sea). India also has the world’s largest estuary and mangroves, the Sundarbans in the East
and biologically rich mountain ranges of the Western Ghats along its West Coast. Apart
from this, India is a home to a billion people that is projected to increase to 1.7 billion by
2050 according to the high scenario assuming a fertility rate of 2.1%.
The surface water and ground water resources in India play vital roles in agriculture,
fisheries, livestock production, forestry, and industrial activity. Water and agriculture
sectors in India are likely to be most sensitive to monsoon rainfall. There have been
considerable spatial and temporal variations in rainwater availability in recent years as a
result of observed swing in the onset, continuity and withdrawal patterns of monsoon. The
pace of the green revolution seems to have started slowing down due to immense pressure
on India’s land and water resources and indiscriminate addition of restorer inputs such as
inorganic fertilizers, pesticides etc. and their inefficient use. Agriculture’s share in Gross
Domestic Product (GDP) of India has also declined recently, thus marking a structural
shift in the composition of the GDP. Though traditionally, agriculture accounted for
two-fifths of the GDP; it accounted for only 31% in 1990-1991 and 25% in 2001 (ADB,
2003). India’s GDP has shown robust growth (never less than 5% since 1990-1991) which
suggests that non-agricultural sectors (particularly the service sector) have grown at the
expense of agriculture. However, as in all developing countries, about 72% (2001 Census)
of India’s population still lives in rural areas. The main source of income for this majority
is either directly or indirectly dependent on agriculture. Hence agricultural progress and
stability, which has strong links to availability of water resources, holds the key to rural
and agrarian prosperity in India.
7.2.1 KEY DEVELOPMENT SECTORS AND WATER SOURCES
In spite of a spurt in industrial growth and activity in the last 30 years, the livelihood of
millions of people in rural India is still drawn from the agriculture sector. Besides this,
156 IMPLICATIONS FOR INDIA’S WATER RESOURCES
Copyright © 2005 Taylor & Francis Group plc, London, UK
there are also major linkages between agriculture and industry. Agriculture supplies the
raw materials for employment-intensive industries. It stimulates and sustains industrial
output through rural household demands for consumer goods and services. It influences
industry through government savings and public investment. Besides irrigation supplies,
large water reservoirs are also required to generate hydropower. But unlike irrigation the
consumptive use of water in this sector is mainly limited to the evaporative losses. Many of
the large reservoirs like Bhakra, Hirakud, Nagarjunasagar, Koyna, Pong, Rihand, Srisailam
and Idduki are excellent examples of providing hydropower to the nation and have ushered
the economic growth and prosperity to the region.
Fig 7.1 Topographic Map of India.
The agricultural output is primarily governed by the availability of water making the
country’s agrarian economy sensitive to the status of water resources and the monsoon in
particular. As the monsoons serve not only as a sole provider of water to large areas of
BAY OF
BENGAL
Myanmar
ARABIAN
SEA
PAKISTAN
T I B E T
Sri
Lanka
> 2,000 m
70
o
75
o
80
o
85
o
90
o
95
o
35
o
30
o
25
o
20
o
15
o
10
o
SCALE
0500 KM
500-1,000 m
0-500 m
1,000-2,000 m
M. LAL 157
Copyright © 2005 Taylor & Francis Group plc, London, UK
rainfed cultivation but also remain the primary source of water to recharge the ground
water resources of the country. The demands on the water resources in the country, by the
several sectors are not surprisingly dominated by the agriculture sector. In the year 1999,
agriculture consumed 85.3% of the water, industry 1.2%, energy sector 0.3% and other
sectors 6.4% whereas domestic consumption was 6.6% (GOI, 2000).
The two sources of freshwater are ground water and surface water; of these the river
basins represent the main source of freshwater in the Indian subcontinent. India is giftedwith
a river system involving over 20 major rivers with many tributaries. The total annual dis-
charge in the rivers that flow in various parts of the country amounts to 1,880 km
3
yr
-1
(CWC, 1995). Many of these rivers are perennial though few are seasonal. The large rivers
such as the Indus, the Ganges and the Brahmaputra have their origin in the Himalayas and
flow throughout the year though their flows significantly reduce during the lean summer
period (March to May). The Himalayan snow and ice supports three main river systems
viz., Indus, Ganges and Brahmaputra having their average annual stream flow of 206 km
2
,
488 km
2
and 510 km
2
respectively. Thus, more than 50% of water resources of India are
located in various tributaries of these three river systems (Fig. 7.2). Average water yield
per unit area of the Himalayan Rivers is almost double that of South Peninsular river
system indicating the importance of snow and glacier melt contribution from high
mountains. The average intensity of mountain glaciations varies from 3.4% for Indus to
3.2% for Ganges and 1.3% for Brahmaputra. The tributaries of these river systems show
maximum intensity of glaciations (2.5% to 10.8%) for Indus followed by Ganges (0.4% to
10%) and Brahmaputra (0.4% to 4%); the average annual and seasonal flows of these
systems give a different picture thereby demonstrating that the rainfall contributions are
greater in the Eastern region while the snow and glacier melt contributions are more
important in the Western and Central Himalayan region.
Most of the rivers in South Peninsular India like the Cauvery, the Narmada and the
Mahanadi are fed through ground water discharges (base-flow) and are supplemented by
the monsoon rains. Therefore, these rivers have very limited flow during the non-monsoon
period. The importance of these rivers lies not just in the size of their basins but also on the
quantity of water they can carry. The flow rate in these rivers is independent of the water
source of the river and depends upon the precipitation rate in the region. Therefore, in
spite of being smaller in size, the rivers flowing West have a higher flow rate due to higher
precipitation over that region.
Apart from the rivers, the Indian subcontinent is covered by a number of reservoirs,
lakes, wetlands, mangroves and ponds. During lean season, these reservoirs are the key
source of water. For example, a large dam in Mettur over Cauvery River has a 40 m high
reservoir with a storage capacity of about 10 km
3
. The amount of water stored here during
the monsoon season is released for irrigation under controlled conditions during the dry
period. Even though various types of freshwater bodies are widely distributed across the
Indian subcontinent, still the availability of drinking water suggests skewed distribution of
actual supply. These water bodies regulate both the quantity and quality of water in
addition to supporting the biota of various species. The importance of these water bodies
is apparent from the fact that in the thirteen States, which experienced frequent floods and
drought in the last few years, 50% of the areas of those States are prone to periodic
droughts possibly due to the shrinking or vanishing of these water bodies. Many lakes in
Rajasthan (including the largest lake in Udaipur) have been heavily silted and the water
levels in the Krishnaraja reservoir in Tamil Nadu on the river Cauvery has gone down
recently due to lack of water input from the upstream region. Table 7.1 presents an
overview of the storage capacity of various reservoirs in India.
158 IMPLICATIONS FOR INDIA’S WATER RESOURCES
Copyright © 2005 Taylor & Francis Group plc, London, UK
Table 7.1 Water storage capacity of reservoirs in India
Reservoir’s storage at the end of
monsoon
1998 1999
Reservoirs (number)
Designed capacity (km
3
)
Storage (km
3
)
Average of last 10 years (km
3
)
Current year’s storage as % of
designed storage
% of this year’s capacity to last
10 years
68
129
106
101
82
106
68
129
95
104
74
92
The ground water resources of the country are also vast. Ground water acts as a
regulating mechanism for storing water during wet season and thus it complements surface
storage, which being location-specific may not be available. The ground water level in the
marshy and swampy Terai region of the Himalayas, the Northern most stretch of the Ganges
basin, is only 2 m-3 m below the ground surface, but it goes down drastically to 15 m-30 m
below the surface in certain parts of the river basin. The amount of freshwater that exists in
Fig. 7.2 Major Rivers of India.
M. L
AL 159
Copyright © 2005 Taylor & Francis Group plc, London, UK
this unconfined aquifer is massive and has not been brought into utilization in any
systematic manner. In fact, a good part of the dry season flow in the river system is
augmented by the flow back of the ground water from the unconfined aquifers in the area
adjoining the Ganges and its tributaries. The deep artesian aquifers underlying millions of
acres of alluvia and deltaic cropland in the Ganges basin are believed to be filled with
freshwater to depths as great as 2,000 m. The total replenishable ground water resource
available in India is currently estimated to be 45.22 million hectare meter/year (mha m/yr).
Of this quantity, 6.933 mha m/yr may be used for drinking and industrial purposes while
the rest can be used for irrigation. Interestingly, almost 80% of domestic water
requirement in India today is met from ground water sources. However, the ground water
resources in several States of India are fast getting depleted primarily due to over
extraction and poor recharging facility.
7.2.2 THE NEED FOR SUSTAINABLE DEVELOPMENT OF WATER RESOURCES
Despite the presence of substantial reserves of water in India, the actual utilizable quantity
is limited and water crisis is seen to be inevitable in the future. The annual quantity of
freshwater including ground water available in India is currently about 1.88 km
3
(CWC,
1995). This puts the per capita availability to be about 2,000 m
3
i.e., 2x10
9
liters per person
per year and this quantity is further expected to drop to 1,480 m
3
in the next decade due to
increase in population coupled with no further augmentation of water resources and also
its consequent decrease over the same time due to consumption. India will reach a state of
water stress before 2025 when the availability falls below 1,000 m
3
. This clearly indicates
the ‘two sided’ effect on water resources - the rise in population will increase the demand
of water leading to faster withdrawal of water and this in turn would reduce the recharging
time of the water tables. As a result, availability of water is bound to reach critical levels
sooner or later. In this regard the emerging disputes are already indicative of what can be
expected in the future. Fights over water have already broken out in between States (Cauvery
issue, Narmada problem, Krishna water disputes). Disputes between nations also already
exist over sharing of river water between India and Bangladesh over the Ganges water and
India and Pakistan over the Indus water. Water riots have also been reported in Bhavnagar
and Rajkot in Gujarat (Ramakrishnan, 1998). This makes it imperative to draw out
appropriate action plans and strategies to conserve our water resources and optimize
utilization of water from the various water sources.
7.3 CLIMATE OF INDIA
7.3.1 PRESENT CLIMATE AND ITS SPATIAL DIVERSITY
India, a country of subcontinental size, is the largest peninsula in the world and is
surrounded by seas on the three sides with an extensive coastline of about 6,000 km.
Climatologically, India covers the tropical, sub-tropical and the temperate regimes. The
country is divided into almost two equal halves by the Tropic of Cancer. The Northern half
cutoff from the rest of the continent by the Himalayan range, experiences temperate type
of climate whereas the extreme Southern part of the country falls within the tropical
latitudes. The inner Himalayas present sub-polar conditions registering extremely low and
even negative temperatures in winter due to the altitude effect while the presence of the
seas on all three sides brings the Southern Peninsular India under direct maritime influence
with low diurnal temperature differences and a very moderate climate. The interior of the
160 IMPLICATIONS FOR INDIA’S WATER RESOURCES
Copyright © 2005 Taylor & Francis Group plc, London, UK
country experiences a continental type of climate with extreme annual temperature swings.
The summer temperatures over this region soar and often go beyond 40
o
C while the
temperature in winter drops radically.
India’s unique geographical configuration gives it the peculiar climate regime with
four seasons. Winter season covering the months of December, January and February is
followed by the summer (pre-monsoon) season extending from March to May. India comes
under the sway of the Southwest monsoon season from June to September and then goes
through post-monsoon season from October to November. The basic driving force behind
the monsoons is the thermal contrast between the land and the sea. During the
pre-monsoon, as the sun progresses Northwards, a simultaneous shift in the converging
zone of the trade winds of the two hemispheres (ITCZ) occurs to the North of the
geographical equator. The Southeasterly trades blowing in from the Southern Hemisphere
get deflected to the right as they enter the Northern Hemisphere and blow into the
subcontinent from the West Coast bringing with it moisture from the adjoining seas. This
marks the advent of the Southwest monsoon over the subcontinent. The point of first entry
of the monsoon in India is the Kerala Coast. These Southwesterlies bring rain throughout
the country, mainly to the South of the monsoon trough. As the Southwest monsoon
winds blow over peninsular India they collect more moisture from the Bay of Bengal and,
on striking the Himalayan range in the North, get deflected Westward. These deflected
Southeasterly trades bring rains to the Northern half of the country. As the summer
monsoon enters from the Southwestern corner of the country, it moves progressively North
and by 15
th
of July, it covers the entire Indian subcontinent (Fig. 7.3). The monsoon
circulation over the subcontinent is associated with several synoptic scale events such as
the development of the heat low over Rajasthan in the Northwest India during the
pre-monsoon season, the Tibetan high occurring over the Tibet plateau, the Mascarene
high off the coast of Madagascar and the weakening of the sub-tropical Westerlies over
North India with the subsequent onset of the tropical Easterly jet stream over the
peninsular India.
Towards the end of the monsoon, as the sun begins its journey Southward
the monsoon starts withdrawing. This event is heralded by the reinforcement of the
sub-tropical Westerlies over North India. The Easterly jet disappears rapidly with
the recession of the monsoons. As the Westerly jet stream re-establishes itself South of
the Himalayas, winter rains start to the Southeast coast near Tamil Nadu in India. This is
known as the Northeast or the winter monsoon. During the winter months, rain also
occurs over North India due to the Southward shift of the polar fronts. Frontal or extra-
tropical cyclones developing over West Asia and the Mediterranean Sea pass through
North India during its passage Eastward. The presence of the Himalayas weakens these
disturbances and the temperature contrast of the air masses is also somewhat reduced
because of which the frontal characteristic of these extra-tropical cyclones is not clearly
evident. Since these disturbances have their origin in the West, the rains which result over
North India is said to be due to the Western disturbances.
The long-term average annual rainfall for the country as a whole is 116 cm - the
highest for a land of comparable size in the world. But this rainfall is highly variable both in
time and space. The percentage areal distribution of annual rainfall over India is given in
Table 7.2 below. The rainfall is highly variable in time as well. The maximum rainfall occurs
in July and August during the four-month (June to September) Southwest monsoon
season. There are considerable intra-seasonal and inter-seasonal variations as well. The
summer monsoon rainfall oscillates between active spells with good monsoon (above
normal) on all India basis and weak spells or the breaks in the monsoon rains when
M. LAL 161
Copyright © 2005 Taylor & Francis Group plc, London, UK
deficient to scanty (≤20%) rains occur on all India basis for a few days at a stretch. Weak
and active spells of the summer monsoon is determined by the position of the monsoon
trough extending from the Northwestern end over the Rajasthan desert to the head Bay of
Bengal. The monsoon trough oscillates either South or North of this normal position over
the Gangetic plains. When the trough is to the South or close to the normal position, active
spells result and when it is near the foothills, weak monsoon conditions prevail. The
average seasonal summer monsoon rainfall of India is about 85 cm with a standard
deviation of about ±10%. Orissa, East Madhya Pradesh, West Bengal, and the
Northeastern States of India, the Western coast and the Ghats receive more than 100 cm of
rainfall during this season. The submontane region extending from North Bihar to Jammu
also receives more than 100 cm of rainfall. The heavy rainfalls in the Northeastern States,
West coast and the Ghats and the submontane regions are influenced by the orography.
The peninsular India South of 15
o
N gets less than 50 cm rainfall. The lowest rainfall is
received in the extreme Southeast Peninsula. The West and the Northwest regions of the
country receive about 50 cm of rain in the season. The rainfall decreases rapidly to less
than 10 cm in the West Rajasthan. Regions above 50 cm in the season are classified as wet
and those less than 50% as dry parts of India.
Fig. 7.3 The onset and withdrawal dates of the Southwest monsoon.
The two monsoon seasons (the Southwest monsoon in June to September and the
Northeast monsoon in November -December bring forth rains - many a times in intensities
and amounts sufficient to cause serious floods creating hazardous (and often disastrous)
situations. Moreover, cyclonic storms in the pre-monsoon months (April-May) and the
162 IMPLICATIONS FOR INDIA’S WATER RESOURCES
Copyright © 2005 Taylor & Francis Group plc, London, UK
post-monsoon months (October-November) cause large-scale inundation, destruction and
deaths. In fact, floods and cyclones are the two major natural disasters, which visit India
quite often. The adverse impacts of these two natural disasters cannot be assessed merely
in economic terms based on destruction of crops, property and infrastructure because
the toll of human misery in the form of death, disease, injury, loss of employment,
psychological trauma, and above all the set-back to development are too difficult to
evaluate.
Table 7.2 Areal Distribution (%) of Annual Rainfall over India
Mean Annual Rainfall Corresponding % Area
0 - 75 cm
75 - 125 cm
125 - 200 cm
> 200 cm
30 %
42 %
20 %
8 %
An annual mean global warming of 0.4°C to 0.8°C has been reported since the late
19
th
century (IPCC, 2001). Surface temperature records indicate that the 1990s have been
the warmest decade of the millennium in the Northern Hemisphere and 1998 is the
warmest year (Fig. 7.4). The observations also suggest that the atmospheric abundances
of almost all greenhouse gases reached their highest values in recorded history during the
1990s (Nakicenovic et al., 2000). Anthropogenic CO
2
emissions due to human activities
are virtually certain to be the dominant factor causing the observed global warming. In
India, the analysis of seasonal and annual surface air temperatures (Pant & Kumar, 1997),
using the data for 1881-1997, has shown a significant warming trend of 0.57
o
C per
hundred years (Fig. 7.5). The warming is found to be mainly contributed by the
post-monsoon and winter seasons. The monsoon temperatures do not show a significant
trend in any major part of the country except for a significant negative trend over
Northwest India. Similar trends have also been noticed in Pakistan, Nepal, Sri Lanka and
Bangladesh. The rainfall fluctuations in India have been largely random over a century,
with no systematic change detectable on either annual or seasonal scale (Fig. 7.6).
However, areas of increasing trend in the seasonal rainfall have been found along the West
Coast, North Andhra Pradesh and Northwest India and those of decreasing trend over
East Madhya Pradesh, Orissa and Northeast India during recent years (Fig. 7.7).
The global warming threat is real and the consequences of the climate change
phenomena are many, and alarming. The impact of future climatic change may be felt more
severely in developing countries such as India whose economy is largely dependent on
agriculture and is already under stress due to current population increase and associated
demands for energy, freshwater and food. In spite of the uncertainties about the precise
magnitude of climate change and its possible impacts particularly on regional scales,
measures must be taken to anticipate, prevent or minimize the causes of climate change
and mitigate its adverse effects.
7.3.2 IMPACT OF GLOBAL WARMING ON INDIA’S CLIMATE
Besides being the most important determinant of the economic welfare of the country, the
monsoon is the predominant source of freshwater required for the rejuvenation of the
water resources after the hot spell of the pre-monsoon season. The leading concern today
M. LAL 163
Copyright © 2005 Taylor & Francis Group plc, London, UK
is the probable impacts that climate change and global warming might have on the annual
cycle of the monsoon and the precipitation pattern. A few of the currently available
state-of-the-art Global Climate Models [CCSR/NIES (Japan), CSIRO (Australia), ECHAM
(Germany) and UKMO (England) global climate models] have the ability to simulate the
monsoon process realistically enough in order to be able to project the plausible regional
climate change and its impacts on the long-term cycle of events including monsoons over
the subcontinent (Lal & Harasawa, 2000). These models have been run with realistic
forcing history for the 20
th
century and allow direct comparison of the model’s response to
the observations. The combination of the warming effects on a global scale from increasing
Fig. 7.5 All-India Mean Annual Surface Air Temperature Anomalies (1881-1997).
Fig. 7.4 Monthly global mean temperature anomalies in the year 1998 and the previous warmest
year.
164 IMPLICATIONS FOR INDIA’S WATER RESOURCES
-1.5
-1
-0.5
0
0.5
1
1.5
Temperature Anomaly (ЊC)
1881 1891 1901 1911 1921 1931 1941 1951 1961 1971 1981 1991
No. of stations
1881-1900 25
1901-1990 121
1991-1997
30
Linear Trend = 0.57ЊC/100 yrs
5-Point Gaussian Lowpass
Filtered
0.0
0.1
0.2
0.3
0.4
0.5
0.6
0.7
0.8
0.9
1.0
Jan Feb Mar Apr May Jun Jul Aug Sep Oct Nov Dec
Month
Increase over 1880-1998 mean (
o
C)
1998
1988
1995
1997
1997
1991
1997
1997
1997
1997
1990
1997
1997
1998
1998
1998
1998
1998
1998
1998
1998
1998
1998
1998
Copyright © 2005 Taylor & Francis Group plc, London, UK
CO
2
and the regional cooling from the direct effect of sulfate aerosols produced a better
agreement with observations of the time evolution of the globally averaged warming and
the patterns of 20
th
century climate change. With the possible effects of future changes of
anthropogenic aerosols as prescribed in the IS92a emission scenario (~1% per year
compound increase of equivalent CO
2
), the coupled atmosphere-ocean global climate models
(A-O GCMs) suggested a global and annual mean warming at 2100 relative to 1990 of
between 1
o
C and 3.5
o
C (at an average rate of 0.3
o
C per decade).
Fig. 7.6 All-India Summer Monsoon Rainfall Anomalies (1871-1999).
-30
-20
-10
0
10
20
30
1870 1880 1890 1900 1910 1920 1930 1940 1950 1960 1970 1980 1990 2000
Years
Rainfall Anomaly (% of Mean)
El Niño
La Nina
Fig. 7.7 Recent trends (1991-1998) in monsoon rainfall in selected regions of the Indian
subcontinent.
Climate change scenarios for the Indian subcontinent based on an ensemble of results
as inferred from the four A-O GCMs (which have demonstrated some skill in simulating
the present-day climatology over Indian subcontinent) on annual and seasonal mean basis
are presented in Table 7.3. Three future time periods centered around 2020s (2010-2039),
2050s (2040-2069) and 2080s (2070-2099) have been considered here for developing
scenarios of changes in surface air temperature and precipitation relative to the baseline
period of 1961-1990 over the Indian subcontinent. The projected area-averaged annual
M. LAL 165
-19
15
-15
-6
-16
-13
11
-9
-18
17
15
-12
-3
12
32
15
37
44
83
-6
-10
-12
20
45
-9
-12
-21
24
14
7
-11
25
42
2
-25
-15
-25
21
-28
6
-40
-20
0
20
40
60
80
100
Punjab Haryana,
Chandigarh &
Delhi
Kerala East Madhya
Pradesh
North Eastern
States
% Departure from normal
Copyright © 2005 Taylor & Francis Group plc, London, UK
mean warming is about 2.7
o
C for the decade 2050s and about 3.8
o
C for the decade 2080s
over the land regions of India as a consequence of increases in atmospheric concentration
of greenhouse gases (Lal & Harasawa, 2001). Under the combined influence of
greenhouse gas and sulfate aerosols, the surface warming is restricted to only 1.9
o
C and
3.0
o
C for the decade 2050s and 2080s, respectively. In general, the projected warming is
found to be higher during winter than during monsoon. The A-O GCMs show high
uncertainty in future projections of both winter and summer precipitation over the Indian
subcontinent (with or without aerosol forcing). The magnitude as well as the sign of
projected changes in monsoon rainfall over the region varies significantly among the
models. This is largely attributed to complex feedbacks due to differences in treatment of
ground hydrology and cloud-radiation interactions in these models. The likely magnitude
of mean sea level rise along the Indian Coastline due to thermal expansion of seawater has
also been calculated and is included in Table 7.3. Even though the aerosol forcing reduces
the surface warming, its magnitude is still considerable and could substantially impact the
Indian subcontinent. The inter-model differences over the tropics represent the primary
source of uncertainty in regional projections of simulated precipitation changes in current
A-O GCMs.
In order to predict the changes in the seasonal as well as annual variability of the
monsoons in response to increases in radiative forcing of the atmosphere, climate change
scenarios over Indian subcontinent under the new SRES ‘Marker’ scenarios have also
been developed based on the data generated in more recent numerical experiments with
A-O GCM of the CCSR/NIES, Japan (Lal et al., 2001). The new set of emission scenarios
covers a wide range of the main demographic, technological, and economic driving forces
of future global emissions (Nakicenovic et al., 1998). Four ‘Marker’ scenarios (namely
A1, A2, B1 and B2 scenarios) have been identified each of which describes a different
world evolving through the 21
st
century and each of which may lead to quite different
greenhouse gas emission trajectories. The scenario B1 projects the most conservative
future emission of greenhouse gases while A2 scenario is characteristic of scenarios with
higher rates of greenhouse gas emissions in combination with higher sulfur and other
aerosol emissions. More recently, the A1 scenario family has been further divided into
three groups that describe alternative directions of technological change in the energy
system (Nakicenovic et al., 2000). The three A1 groups are distinguished by their
technological emphasis: fossil intensive (A1FI), non-fossil energy sources (A1T), or a
balance across all sources (A1B). The SRES scenarios exclude the effects of climate change
and climate policies on society and the economy (‘non-intervention’). Most of the recent
numerical experiments with A-O GCMs, however, have not included all the SRES
scenarios as yet. The projections of regional climate change based on these newer sets of
emission scenarios of greenhouse gases are likely to be more realistic than the IS92a
emission scenario used earlier in transient experiments with A-O GCMs.
Over land regions of the Indian subcontinent, the area-averaged annual mean surface
temperature rise by 2080s is likely to range between 3.5
o
C and 5.5
o
C (least in B1 scenario
and maximum in A2 scenario). The area-averaged surface temperature increase during the
winter over India by 2080s would be at least 4
o
C (B1 scenario) and could reach even 6
o
C
(A2 scenario). During summer monsoon, the warming may range between 2.9
o
C and 4.6
o
C
(Table 7.4). The projected surface warming is more pronounced during winter than during
summer monsoon season. The spatial distribution of surface warming as a consequence of
increase in anthropogenic radiative forcing (with respect to 1981-1990) suggests that North
India may experience an annual mean surface warming of 3
o
C or more by 2050s,
depending upon the future trajectory of anthropogenic forcing. The spatial pattern of
166 IMPLICATIONS FOR INDIA’S WATER RESOURCES
Copyright © 2005 Taylor & Francis Group plc, London, UK
M. LAL 167
Copyright © 2005 Taylor & Francis Group plc, London, UK
temperature change has a large seasonal dependency. The model simulates peak warming
of about 3
o
C over North and Central India in winter. Over much of the Southern Peninsula,
the warming is likely to be under 2
o
C during the winter season. The surface temperature
rise would be more pronounced over the Northern and Eastern regions of India (~2
o
C)
during the monsoon season.
A marginal increase of about 7% to 10% in area-averaged annual mean precipitation
is projected over the Indian subcontinent by 2080s (Table 7.4). A decline of between
5% to 25% in area-averaged winter precipitation is likely. During the monsoon season, an
increase in area-averaged precipitation of about 10% to 15% over the land regions is
projected. Contrary to earlier projections (Lal et al., 1994; 1995), the new simulation
experiments suggest appreciable change in spatial pattern of winter as well as summer
monsoon precipitation over land regions of the Indian subcontinent. This could be
attributed to inclusion of more realistic estimates of regional aerosol concentrations as
well as the indirect radiative forcing due to aerosols. A decrease of between 10% and 20%
in winter precipitation over most parts of Central India is simulated for 2050s. During the
monsoon season, the results suggest an increase of 30% or more in precipitation over
Northwest India by 2050s. The Western semi-arid margins of India could receive higher
than normal rainfall in a warmer atmosphere.
In order to examine the likely changes in intra-seasonal and inter-annual variability in
summer monsoon over Central India (land points only confined to latitudes 18
o
N and 30
o
N
and longitudes 67
o
E to 90
o
E) in response to changes in anthropogenic forcing, we have
analyzed the simulated daily data for rainfall from 1
st
May until 30
th
October (183 days)
during each of the 30-year period corresponding to 1970s and 2050s. Figure 7.8 depicts
the temporal variation of observed (based on daily rainfall data averaged for 10 Central
Indian stations during the period 1966-1990) as well as simulated (1961-1990) daily values
of total rainfall averaged over Central India from 1
st
May till 30
th
October for each years
along with daily mean for the selected period (thick line). The rainfall maxima coincides
with the peak monsoon activity over the region around mid-July. The seasonal total of
simulated daily rainfall is marginally higher (by 4.9%) as compared to observed rainfall
while the intensity of simulated daily rainfall is only two-thirds of the observed over the
central plains of India. This could be attributed to far more number of rainy days in model
simulation as against observations. The year-to-year variability in monsoon rainfall
simulated by the model (as inferred from the standard deviation of area-averaged monsoon
rainfall for 30-year period) is significantly low (only 42% of the observed) relative to
observed rainfall variability. The temporal variations of simulated daily total rainfall
averaged over Central India during the years 2036-2065 in each of the four SRES ‘Marker’
scenarios are depicted in Figure 7.9. A comparison of Figure 7.8 with Figure 7.9 reveals
many aspects of plausible changes in Indian summer monsoon activity over the central
plains of India. The standard deviation of future projections of area-averaged monsoon
rainfall centered around 2050s is not significantly different in each of the four scenarios
relative to that simulated for the present-day atmosphere. This implies that the
year-to-year variability in Central India rainfall during the monsoon season may not
significantly change in the future. More intense rainfall spells are, however, simulated over
the land regions of the Indian subcontinent in the future (relative to that simulated for the
present-day atmosphere) thus increasing the probability of extreme rainfall events in a
warmer atmosphere.
It is interesting to note here that there are no appreciable shifts in rainfall maxima
during July-August (located at about 20
o
N) in the temporal variation of simulated monthly
mean precipitation over the region in any of the four ‘Marker’ scenarios. The Northward
168 IMPLICATIONS FOR INDIA’S WATER RESOURCES
Copyright © 2005 Taylor & Francis Group plc, London, UK
Table 7.4 Climate Change Projections* for Indian subcontinent under the new SRES Marker Emission Scenarios
* Based on CCSR/NIES Model Experiments; Area-averaged for land regions only.
Temperature Change (
o
C) Rainfall Change (%)
Scenarios: A1 A2 B1 B2 A1 A2 B1 B2
2020s Annual 1.18 1.00 1.32 1.41 2.29 2.16 4.15 5.97
Winter 1.19 1.08 1.37 1.54 0.39 -1.95 4.36 3.64
Monsoon 1.04 0.87 1.12 1.17 1.81 2.37 3.83 5.10
2050s Annual 2.87 2.63 2.23 2.73 9.34 5.36 6.86 7.18
Winter 3.18 2.83 2.54 3.00 3.22 -9.22 3.82 3.29
Monsoon 2.37 2.23 1.81 2.25 10.52 7.18 7.20 8.03
2080s Annual 5.09 5.55 3.53 4.16 9.90 9.07 7.48 7.62
Winter 5.88 6.31 4.14 4.78 -19.97 -24.83 -4.50 -10.36
Monsoon 4.23 4.62 2.91 3.47 14.96 15.18 11.12 10.10
M. LAL 169
Copyright © 2005 Taylor & Francis Group plc, London, UK
advancement of monsoon rains over India with the progression of the season therefore
seems quite robust. A detailed analysis of the daily rainfall data suggests that, under A1
and A2 scenarios, while the model still simulates the first spell of intense rainfall appearing
over the Southern most part of India (5
o
N to 10
o
N) during the first week of June on an
average, the spread of simulated onset date at 10
o
N (based on the criteria that rainfall at all
grid points along 10
o
N in the region is 3 mm day
-1
or more for at least three consecutive
days) extends from 24
th
May to 11
th
June during the 30-year period centered around 2050s
against between 29
th
May and 8
th
June during the 30-year period of the present day
atmosphere. This implies the possibility of enhanced variability in the date of onset of
summer monsoon over Central India in a warmer atmosphere.
Fig. 7.8 Temporal variation of observed as well as (1961-1990) daily values of total rainfall
averaged over Central India from 1
st
May till 30
th
October. The thick line depicts daily mean for the
selected period.
170 I
MPLICATIONS FOR INDIA’S WATER RESOURCES
Copyright © 2005 Taylor & Francis Group plc, London, UK
Utility of precipitation primarily depends upon its spatial as well as its temporal
distribution. Uniform precipitation over a larger area is more useful than its occurrence
concentrating over a smaller region and also, precipitation occurring over a larger time
period would be more effectively utilized rather than, when it occurs within a short time
span. Therefore, the projected changes in the precipitation pattern over the Indian
subcontinent as presented above come as bad news for the water resource sector. On the
first count, the decrease in the winter precipitation would reduce the total seasonal
precipitation being received during December, January and February implying a greater
water stress. On the second count, intense rain occurring over fewer days, which other
than implying increased frequency of floods will also mean that much of the rain would be
lost as direct runoff resulting in reduced ground water recharging potential.
Fig. 7.9 The temporal variations of simulated daily total rainfall averaged over Central India during
2036-2065 in each of the four SRES ‘Marker’ scenarios.
7.4 FLOODS AND DROUGHTS
7.4.1 PERIODICITY AND OCCURENCE
Rain gauge records of the Indian monsoon are available for over a century. In 1910, Sir
Gilbert Walker, the then Director General of the India Meteorological Department, used
gauge records since 1840 to describe the variability of Indian monsoons. The analyses of
the rainfall records of the monsoon trends have continued till this day. These analyses have
M. LAL 171
Copyright © 2005 Taylor & Francis Group plc, London, UK
yielded a 30-year cyclicity of the Indian monsoons. It was observed that drought as well as
flood years occurred in runs rather than scattered randomly through the years. Walker in
his study found two periods of greatest rainfall deficiency, 1843-1860 and 1895-1907. The
latter period extended till about 1920. This period was then followed by a remarkably low
frequency of droughts for the next 30 years or so. Droughts became once more common in
the 1960s. Of the 14 major drought years in the 85-year record, 8 occurred in the first
30-year period (1891-1920) whereas there was only one in the second 30-year period
(1921-1950). In the 25-year period from 1951-1981, five major drought years were
recorded. In 1972 and 1979 deficient rainfall (about 25% below normal) was recorded in
one-half to two-thirds of India’s plains. In 1994, monsoon rainfall was deficient (by
between 20% and 43%) in 10 of the 31 meteorological subdivisions of India. Gujarat,
West Rajasthan, Tamil Nadu and Kerala had deficient monsoon rainfall during the year
1999. Apart from the inherent 30-year cyclicity of the Indian monsoons, droughts have
been found to be more frequent during the years following El Niño-Southern Oscillation
(ENSO) events. At least half the severe failures of the Indian summer monsoon since 1871
have occurred during the El Niño years (Webster et al., 1998). In the event of enhanced
anomalous warming of the Eastern Equatorial Pacific Ocean such as that observed during
the 1997-1998 El Niño, the higher frequency of drought conditions is possible.
Floods and cyclones are the natural disasters where excess of water (rains) creates the
havoc in India. In case of floods, the swollen rivers with overflowing banks do the damage
in floodplains. Of late, flooding or water logging is becoming a major problem in urban and
metropolitan areas. Cyclonic storms pose a hazard mainly in coastal regions (more on the
East Coast as compared to the West Coast) but no place in the country is free from floods
(even Rajasthan suffers from floods and flooding) although floodplains of rivers and
cyclone-affected coastal regions are most prone to floods. While cyclone is a natural
disaster in the full sense of the term, flood problem (including flooding) has been seriously
aggravated by human activities such as overgrazing, deforestation, soil erosion and
siltation. On the average, the area actually affected by floods every year in India is of the
order of 10 mha of which about half is cropland. In fact, the area prone to floods in India
has been estimated to be of the order of 40 mha. Persistent occurrence of rainfall over an
area already soaked with rain or intense rainfall often results in flood. Excess water in a
river, due to heavy and/or persistent rains in the catchment area or the upper regions of the
river system also create flood downstream. Absence or lack of adequate drainage in any
area will aggravate the flooding. Flash floods occur due to high rate of water flow as also
due to poor permeability of the soil. Areas with hardpan just below the surface of the soil
are more prone to floods as water fails to seep down to the deeper layers.
As is evident, floods and drought occurring in India are closely associated with the
nature and extent of the summer monsoon. The inter-annual fluctuations in the summer
monsoon rainfall over India are sufficiently large to cause devastating floods or serious
droughts. Though floods are often caused by tropical depressions and cyclones, these
cyclones are not a part of the monsoons per se. Severe tropical cyclones generally develop
during the pre-monsoon or post-monsoon season (generally defined cyclone seasons are
October-November and March-June). The Eastern Coast of India along Bengal, Orissa
and Andhra Pradesh are prone to such tropical cyclones. These cyclones cause devastating
coastal floods, which often take the proportion of national disasters. A case in point would
be the super cyclone that hit the Orissa Coast on 29
th
October 1999 with wind speed of
about 260 kmph and heavy rains causing severe floods. This cyclone ranked highest in the
damage caused in terms of both life and property. As per the information received from the
State Relief Commissioner’s Office in Bhubaneshwar (CDBI Special Issue No. 15, 1999),
172 IMPLICATIONS FOR INDIA’S WATER RESOURCES
Copyright © 2005 Taylor & Francis Group plc, London, UK
9,885 people lost their lives; 2,142 people were injured; 370,297 cattle heads perished and
1,617,000 hectares of paddy field and 33,000 hectares of other crops were damaged.
Several villages had been completely wiped out and over a million made homeless with
storm-surge of height 9 m above astronomical tide level at Paradip, which penetrated
35 km inland. Many of the tropical cyclones move inland and may even reach as far inland
as Nepal though at a much reduced intensity. Sometimes these cyclones stagnate over a
region as the Orissa super cyclone did (it was more or less stationary with slight
Southward drift over the region after making landfall) and it is these cyclones that cause
maximum damage to life and destruction to the existing infrastructure.
7.4.2 IMPACT OF GLOBAL WARMING ON FLOODS AND DROUGHTS
Several recent studies (Kitoh et al., 1997; Lal et al., 2000) suggest an increase in the
inter-annual variability of daily precipitation in the Asian summer monsoon with increasing
greenhouse gas concentrations in the atmosphere. An examination of the frequency
distribution of daily monsoon rainfall over India in the model-simulated data has suggested
(Lal et al., 2000) that the intensity of extreme rainfall events are likely to be higher in
future as a consequence of increased convective activity during the summer monsoon
period suggesting thereby the possibility of more frequent flash floods in parts of India,
Nepal and Bangladesh.
Some of the most pronounced year-to-year variability in climate features and the
extreme weather events (such as cyclones) in many parts of Asia have been linked to
ENSO events. The analysis of data generated in several A-O GCMs indicate that, as global
temperatures increase due to increasing greenhouse gases, the Pacific climate will tend to
more resemble an El Niño-like state (Meehl & Washington, 1996; Knutson & Manabe,
1998; Mitchell et al., 1995; Timmermann et al., 1999; Boer et al., 1999). Collins (1999)
finds an increased frequency of ENSO events and a shift in their seasonal cycle in a warmer
atmosphere, so that the maximum occurs between August and October rather than around
January as currently observed. Meehl & Washington (1996) suggest that future seasonal
precipitation extremes associated with a given ENSO event are likely to be more intense in
Tropical Indian Ocean region; anomalously wet areas could become wetter and
anomalously dry areas become drier during future ENSO events. During ENSO, a cyclone
in tropical oceans has more than 40% chance of being a severe one (Lander, 1994).
The role of sea surface temperature in the genesis and intensification of tropical
cyclones has been well demonstrated, for example, by Gray (1979), Emanuel (1988) and
Saunders & Harris (1997). One of the necessary (but not sufficient) conditions for tropical
cyclone formation in the North Indian Ocean is that the sea surface should have a minimum
temperature of about 28
o
C. Analysis of sea surface temperature in the Bay of Bengal
during the period 1951-1997 suggests that the sea surface temperatures have been
increasing here since 1951. Observational records suggest that, while there has been a
rising trend in all-India mean surface air temperature, the numbers of monsoon depressions
and tropical cyclones forming over the Bay of Bengal and Arabian Sea exhibits declining
trends since 1970 (Fig. 7.10).
There have been a number of studies that have considered likely changes in tropical
cyclones (Knutson et al., 1998; Henderson-Sellers et al., 1998; Royer et al., 1998;
Krishnamurti et al., 1998). Some of these studies suggest an increase in tropical storm
intensities with CO
2
-induced warming though there is no conclusive evidence to suggest
that cyclone frequencies or their preferred locations may change in the future. An increase
in sea surface temperature will be accompanied by a corresponding increase in cyclone
M. LAL 173
Copyright © 2005 Taylor & Francis Group plc, London, UK
Fig. 7.10 Trends in all-India mean surface temperature anomaly and number of monsoon
depressions and cyclones in Indian Seas.
intensity (wind speed). The relationship between cyclone intensity (maximum sustained
wind speed) and sea surface temperature is well discussed in literature (Emanuel, 1987;
1999). A possible increase in cyclone intensity of 10%-20% for a rise in sea surface
temperature of 2
o
C to 4
o
C relative to the threshold temperature of 28
o
C is very likely.
Thus, while there is no evidence that tropical cyclone frequency may change, the available
data strongly suggests that an increase in its intensity is most probable.
Storm-surges are generated by the winds and the atmospheric pressure changes
associated with cyclones. At low latitude land-locked locations such as the Bay of Bengal,
the tropical cyclones are the major cause of storm-surges. Any increase in sea surface
temperature is likely to cause greater convective activity, leading to an increase in wind
174 IMPLICATIONS FOR INDIA’S WATER RESOURCES
Copyright © 2005 Taylor & Francis Group plc, London, UK
speed. The stress exerted by wind on water underneath is proportional to the square of the
wind velocity. Amplification in storm-surge heights should result from the occurrence of
stronger winds and low pressures associated with tropical storms. Thus, an increase in sea
surface temperature due to climate change should lead to higher storm-surges and an
enhanced risk of coastal disasters along the East Coast of India.
7.4.3 IMPACT OF FLOODS AND DROUGHTS ON HUMAN SOCIETY AND
DEVELOPMENT
When drawing a comparison between the flood and drought events, it is seen that rural
communities suffer less from floods than from droughts because good crops can be grown
after the water recedes (depends on timing of flow and crop calendar). Flood deposits silt,
thereby adding organic matter and nutrients to the soil. They also recharge the aquifers
thereby improving the ground water availability. However, impacts of these events on
human and animal populations vary according to the nature and severity of the calamity.
Most problems relate to the availability of food, safe drinking water and shelter. The extent
of the disasters was evident in the four episodes - (a) the 1977 typhoon in Andhra Pradesh
claimed nearly 10,000 lives, (b) 1978-1979 floods in Uttar Pradesh, Bihar and West
Bengal damaged 18 mha of cropped land, destroyed nearly 4 million hutments and took a
toll of 2,800 human lives and about 200,000 cattles, (c) 1979-1980 drought in large areas
of Northern and Eastern India that affected more than 38 mha of cropped areas and
endangered the lives of 130 million cattles and more than 200 million people, and (d) 1999
super cyclone in Orissa which claimed nearly 10,000 human lives and damaged about
1,617,000 hectares of paddy field and 33,000 hectares of other crops.
Looking into the flood damage scenario of the country as shown in Table 7.5, it is
observed that the flood damage is mainly related to the damage of land and cropped area
and shows an upward trend during the three decades starting from 1953. The most
damaged areas belong mainly to the States falling within the Ganges and the Brahmaputra
basin. Ranks have been assigned to the different States according to the magnitude of
average annual damage to crops, population and land (Table 7.6). The States located in the
mountainous regions in Jammu and Kashmir, Himachal Pradesh, Nagaland, Manipur
and other hilly States are least affected by floods. The damage to land, cropped areas,
population, property and livestock depends on the geomorphology of the area as well as
population distribution. Damage to population is more in the areas where the population
density of the floodplains is higher such as in the Gangetic plains.
In order to assess drought conditions in the country, the area-averaged Southwest
monsoon rainfall for the country as a whole and the percentage of the country receiving
deficient rainfall during the monsoon season are considered. According to the intensity,
drought in India may be declared as all India drought, severe all India drought and
phenomenal all India drought. There have been 17 incidents of all India droughts in this
century, 8 severe all India droughts and 3 phenomenal droughts. The drought of 1987 was
declared as a phenomenal of all India’s droughts. The worst affected were the three
meteorological subdivisions of Saurashtra, Kutch and Diu (departure from normal rainfall
was -74%), West Rajasthan (departure from normal rainfall was -74%), Haryana and Delhi
(departure from normal rainfall was -67%). As many as 18 subdivisions had rainfall
departures between -20% and -60% during this year. Based on the data in the report of the
National Commission on Agriculture and additional data from the Central Water
Commission of the Government of India, Bagchi (1991) identified 100 districts in the
13 States in India as drought prone which are detailed in Table 7.7.
M. LAL 175
Copyright © 2005 Taylor & Francis Group plc, London, UK
176 IMPLICATIONS FOR INDIA’S WATER RESOURCES
Copyright © 2005 Taylor & Francis Group plc, London, UK
Table 7.6 Ranking of the States as per Flood Damages*
The impacts of drought are mainly two types:
(i) Impacts on the Environment - Moisture stress, shortage of drinking water,
damage to natural vegetation and various ecosystems, increase in air pollution
(increased dust) and water pollution (scarcity of surface and sub-surface water),
and
(ii) Impacts on Society - (a)
Economic impacts such as decreased agricultural
output, loss of livestock, fall in industrial production, and unemployment
resulting in poor purchasing power and the shortage of essential goods; and
(b)
Social impacts such as malnutrition, poor hygiene, ill health, migration and
social strife.
Apart from these direct effects, droughts have a far reaching effect on other sectors as
well. Figure 7.11 shows the ramifications of the various impacts of droughts in India.
Environment and society together constitute an interactive system with climatic extremes
such as droughts creating significant socio-economic impacts on society both in the
short-term and long-term. Obviously, the society in general, and economy in particular, try
to cope with the impacts of climatic extremes by a combination of individual and collective
action both on governmental and non-governmental levels. When these actions or
adjustments turn out to be inadequate or the impacts are swift and/or large,
socio-economic stress and/or social conflicts occur leading to loss of opportunity,
property and even lives. It is here that the proper planning and preparedness on the part of
the society assumes a very significant importance.
7.5 WATER RESOURCES OF INDIA
7.5.1 POTENTIAL OF SURFACE WATER RESOURCES
India has a large and intricate network of river systems of which the most prominent are
Rank As Per Damage To River Basins States
Land Cropped Area Population
Ganges,
Brahmaputra,
Other River Basins
and Coastal Areas
Uttar Pradesh
Bihar
West Bengal
Rajasthan
Madhya Pradesh
Assam
Andhra Pradesh
Gujarat
Orissa
Tamil Nadu
Kerala
Haryana
Punjab
1
2
4
7
9
3
6
8
5
14
10
12
11
1
2
4
3
8
9
7
5
6
13
15
11
10
1
2
4
10
13
8
3
7
6
5
9
11
12
*Source: Goel, 1993.
M. L
AL 177
Copyright © 2005 Taylor & Francis Group plc, London, UK
Table 7.7 Drought Prone Districts in India*
178 IMPLICATIONS FOR INDIA’S WATER RESOURCES
Copyright © 2005 Taylor & Francis Group plc, London, UK
Table 7.7 Continued
*Source: Kulshrestha, 1997.
M. LAL 179
Copyright © 2005 Taylor & Francis Group plc, London, UK