Heavy Metals in the Environment: Using Wetlands for Their Removal - Chapter 4 doc
Bạn đang xem bản rút gọn của tài liệu. Xem và tải ngay bản đầy đủ của tài liệu tại đây (903 KB, 20 trang )
49
CHAPTER
4
Biogeochemical Cycle of Lead
and the Energy Hierarchy
Howard T. Odum
CONTENTS
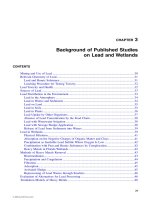
Material Cycles in the Hierarchy of the Earth 51
Including Mechanisms in Systems Diagrams 54
Biogeochemical Budgets 54
Emergy of Materials in a Biogeochemical Cycle 58
Emergy per Mass of Lead 59
Transformity, the Emergy per Unit Energy 60
The Wetland as a Heavy Metal Filter 60
Ecosystems Diagram Showing Mechanisms 61
Spatial Pattern of Dispersal 62
Frequency Distributions 65
Human Interactions with Lead 67
Evaluation Perspectives 68
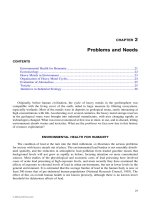
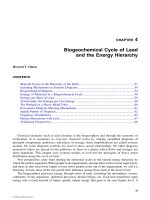
Chemical elements such as lead circulate in the biogeosphere and through the economy of
civilization. It is customary to overview chemical cycles by making simplified diagrams of
principal components, pathways, and places of storage. Such simplifications are called systems
models. On some diagrams symbols are used to show causal relationships. On other diagrams
numerical values are placed on the pathways to show at a glance which flows and storages are
more important. This chapter uses systems models to overview the principles of heavy metal
distribution using the cycle of lead.
New perspectives come from relating the elemental cycles to the natural energy hierarchy by
which the earth is organized. When people in an organization converge their work to fewer supervisors,
and these in turn send fewer inputs to even fewer people at the top of the organization, we call it a
hierarchy. In turn, those at the top spread their influence among those back at the lower levels.
The biogeosphere processes energy through series of units, including the atmosphere, oceans,
continents, living organisms, industrial processes, human beings, etc. Each unit transforms input
energy into a small amount of higher quality output energy that goes to the next higher level. A
L1401-frame-C4 Page 49 Monday, April 10, 2000 9:29 AM
© 2000 by CRC Press LLC
50 HEAVY METALS IN THE ENVIRONMENT: USING WETLANDS FOR THEIR REMOVAL
series of energy transformations is an energy hierarchy because abundant energy at the base of the
organization is transformed and converged into smaller but higher quality energy and units at the
top of the chain. The top units send small, controlling energy flows back to the lower levels.
In our diagramming of systems the energy hierarchy is arranged from abundant low quality
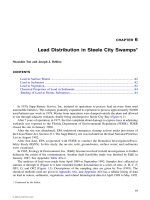
energy on the left to high quality energy on the right. For example, Figure 4.1 shows a series of
three units with available energy flow being transformed into an output of higher quality but less
energy. Notice also the feedback from right to left of small energy flows (1 and 0.1) dispersing
influence to the lower levels. System symbols are given in Appendix A1.
In the process most of the energy is degraded, losing its ability to do work. As required by the
law of conservation of energy, the energy that inflows and is not stored inside has to flow out. An
energy diagram has to include pathways for energy to the outside. Energy that can no longer do
work is indicated as used energy by showing it flowing down and out through a degraded energy
symbol (heat sink symbol). This used energy disperses as heat, eventually leaving the earth. Figure
4.1 has an energy source, energy pathways, and a heat sink.
Whereas available energy flows in, causes transformations, and is dispersed, materials circulate
in cycles. When the systems of the earth organize, they recycle material elements in loops. In Figure
4.2 elemental materials are shown circulating in an ecological system aggregated into two units.
Dilute nutrient elements on the left are concentrated and passed to the right. The materials recycle
back to the left (called feedback), becoming dispersed in the process. Energy is used to converge
materials from dispersed, dilute distribution to centers where the material is concentrated (on the
right). The cycle is completed when the concentrations of materials are dispersed outward to the
larger area again. The converging and concentrating of elemental materials followed by dispersal
are a part of the natural hierarchy of environmental organization.
McNeil (1989) showed a three-dimensional picture of converging and diverging of materials
in circulation. He gave the example of the tree (Figure 4.2b), which draws chemical elements
into roots that converge to the hierarchical center, the trunk, then diverge again into the leaves.
Chemicals drip from the leaves and fall when the leaves fall. After leaf decomposition the
chemical materials are released into the soil to make the cycle again. He proposed the geometrical
toroid form (Figure 4.2c) as a general systems concept for circulation. Some heavy metals follow
this pattern.
The universe has many levels of hierarchy, with materials converging to small centers, and
these in turn converging to larger centers. Familiar examples are the villages, towns, and cities of
the human-populated landscape. Figure 4.3 shows circulation with three levels of hierarchy. The
Figure 4.1
Diagram of a three-unit system arranged from left to right according to its energy hierarchy. In the
100
10
1
91
100
Energy flow per time
0.9
0.1
1
8.1
Source
Toward Top of the Energy Hierarchy
Increasing Quality of Energy Flow
Used Energy
Heat Sink Symbol
L1401-frame-C4 Page 50 Monday, April 10, 2000 9:29 AM
© 2000 by CRC Press LLC
series of energy transformations available, energy flow decreases but energy quality increases.
BIOGEOCHEMICAL CYCLE OF LEAD AND THE ENERGY HIERARCHY 51
material circulation is above (Figure 4.3a), a systems diagram of these materials circulating is in
the middle (Figure 4.3b), and energy sources and sinks are included in Figure 4.3c.
MATERIAL CYCLES IN THE HIERARCHY OF THE EARTH
After millions of years the self-organizing processes of the earth developed a hierarchy of
energy processing including the atmosphere, the ocean, the lands, and the mountains. Figure 4.4a
Figure 4.2
Two-unit system showing the circulation of materials. (a) Elemental cycle in a diagram of energy
ß
environment (McNeil, 1989); (c) three-dimensional circulation represented as a toroid (McNeil, 1989).
Concentrated
Center
(c)
Dilute
Surroundings
Dilute
Surroundings
Energy
Sources
(a)
Center
Concentrated
Tree
Roots
Circulating
Materials
(b)
L1401-frame-C4 Page 51 Monday, April 10, 2000 9:29 AM
© 2000 by CRC Press LLC
flow; (b) convergence and divergence of nutrient elements circulating between a tree and its
52 HEAVY METALS IN THE ENVIRONMENT: USING WETLANDS FOR THEIR REMOVAL
shows a simplified model of the main units of the earth, with the ocean and atmosphere on the left
and land formation and mountain building centers on the right. The circulation of matter is shown
with thick pathways. Processes on the left are relatively fast, requiring only days or years to cycle,
whereas those on the right take millions of years.
Many kinds of material circulate between the units of the biogeosphere (Figure 4.4a). Some
material cycles such as water are concentrated at the left end of the chain of units (Figure 4.4b). Water
vapor from the ocean becomes atmospheric storms and rain. The rains on land and mountains support
Figure 4.3
Convergence and divergence of materials circulating in a three-level hierarchy. (a) Spatial pattern;
(b) systems diagram with circulation of elements; (c) systems diagram with energy source and
sink added.
Dilute
Surroundings
Small
Centers
Center
Dilute
Surroundings
Small
Centers
Center
Recycled Elements
Energy
Source
Degraded Energy
(c)
(b)
(a)
L1401-frame-C4 Page 52 Monday, April 10, 2000 9:29 AM
© 2000 by CRC Press LLC
BIOGEOCHEMICAL CYCLE OF LEAD AND THE ENERGY HIERARCHY 53
Figure 4.4
Main features of the global geobiosphere arranged from left to r
ight in the order of the hierarchical organization of energy
.
(a) Chain of main components with thick pathways representing the circulation of mater
ials; (b) water circulation concentrated
at the lower energy part of the earth chain; (c) heavy metal circulation concentrated at the higher energy par
t of the chain.
Solar
Energy
Tide
Ocean &
Atmosphere
Ecosystems
Soils
Sediment
Deposition
Continental
Sedimentary
Rock
Mountains
Crystalline
Rock
Earth
Heat
= Material Cycles
= Energy only
Civilization
(a) Global Energy Chain
(b) Water Circulation
(c) Heavy Metal Cycles
L1401-frame-C4 Page 53 Monday, April 10, 2000 9:29 AM
© 2000 by CRC Press LLC
54 HEAVY METALS IN THE ENVIRONMENT: USING WETLANDS FOR THEIR REMOVAL
the ecological systems, with water being transpired back to the air as water vapor. Runoff water carries
sediments back to the sea where they are deposited, becoming sedimentary rock and land again.
Other materials, such as the heavy metals, circulate primarily among units at the higher levels
of the hierarchy (Figure 4.4c). For example, before the recent additions of air pollution there was
little lead in the ocean, but more lead in rocks of the land. The process of forming crystalline rocks
concentrates heavy metals into ore bodies. With the development of civilization, the heavy metal
ores, such as lead, were mined as an important part of technology. Lead was important in the Roman
civilization and even more important in modern technology because of extensive use of batteries.
In Figure 4.4a the urban centers of the human civilization are on the right, a place of concentrating
materials such as lead for high technology purposes. Even in a biological food chain, there is a
tendency for some heavy metals to go to the top of the chain, to the right in systems diagrams.
Yet other materials, such as quartz sand, circulate in the center of the hierarchy, being uplifted
as sand dunes or cemented as sandstone in land formation. After weathering processes, sands wash
back to the sea to become coastal sediments again.
Many of the material cycles are controlled by water as it carries sediments and deposits them
in wetlands and river deltas (sediment deposition unit in the center of Figure 4.4a). Wetland
ecosystems are a prominent part of the sediment depositing system located between the mountains
and the sea. Freshwater wetlands are along the rivers and saltwater wetlands in the estuaries. As
we read in Chapter 1, wetlands filter heavy metals from air and waters, returning them to the
geological cycle in formation of sediments and coal.
INCLUDING MECHANISMS IN SYSTEMS DIAGRAMS
We can improve the diagram of the main units of the biogeosphere (Figure 4.5a) by showing
some of the main operating mechanisms. Figure 4.5b shows the main pathways of interaction
between units, the circulation of lead, and its connections to the main flows of energy. Two more
symbols are used. The hexagon-shaped symbol is for units that have storages that feed action back
to the left to augment inflow. Feedbacks that reinforce their own intakes are called autocatalytic
processes. An interaction symbol is shown where two different inputs join in a production process.
The diagramming shows all the processes and cycles coupled together. To be coupled is to be
joined to the action of energy sources. The diagram shows solar energy interacting with seawater
to make water vapor, clouds, storms, ocean currents, and waves. These generate rain that combines
with land to form ecosystems, soils, and glaciers. The runoff waters carry sediments down rivers
to the deltas and wetlands where the sediment and lead are captured, ultimately to be recombined
as land. Lead that escapes to the open ocean deposits with offshore sediments.
There are heavy metals such as lead in all the phases of the earth and flowing between the main
components of the earth’s surface. There are heavy metal elements circulating in all the shaded
pathways in Figure 4.3a along with the water and sediments. Widely distributed in very dilute
concentrations in oceans and air, the element converges to become more concentrated in centers
of geobiospheric action of land formation and mountain building. The unit labeled economy (our
modern civilization) uses rich deposits of fuels as energy for development of the assets of civilization
that also require mined materials.
BIOGEOCHEMICAL BUDGETS
Previous authors have summarized data on the distribution of elements by putting estimates of
average flow rates and storage quantities on simplified diagrams of the main features of the
geobiosphere. Just as we call the average values of money stored and flowing each month in our
L1401-frame-C4 Page 54 Monday, April 10, 2000 9:29 AM
© 2000 by CRC Press LLC
BIOGEOCHEMICAL CYCLE OF LEAD AND THE ENERGY HIERARCHY 55
Figure 4.5
Main features of the global biogeosphere showing principal mechanisms of interaction affecting circulation of lead. (a) Units of global energy
hierarchy from Figure 4.4; (b) main pathways affecting lead (Appendix A4).
Solar
Energy
Tide
Ocean &
Atmosphere
Ecosystems
Soils
Sediment
Deposition
Continental
Sedimentary
Rock
Mountains
Crystalline
Rock
Civilization
(a) Global Hierarchy
Sea
Water
Solar
Energy
Tide
Atmos.
Storms
Evap.
Ecosyst.
Weather
Land
Rain
Substrate
Runoff
Ore
Bodies
Sedim.
Deltas
Wetlands
River Discharge
Economy
Fuels
Materials
Solid
Wastes:
Air
Liquid
(b) Main Pathways Affecting Lead
Deep
Earth
Deep
Earth
Deposition
= Symbol for Units of the Earth that Have Storages and Autocatalytic
Energy Transformation Processes
= Symbol for Source of Energy and Energy and Materials from Outside the
System that Has Been Defined
= Interaction of Two Different but Necessary Inputs to an Operation
L1401-frame-C4 Page 55 Monday, April 10, 2000 9:29 AM
© 2000 by CRC Press LLC
56 HEAVY METALS IN THE ENVIRONMENT: USING WETLANDS FOR THEIR REMOVAL
Figure 4.6a-b
Main ß ows of lead in the geobiosphere (Appendix Table A4.2). (a) Lead circulation bef
ore civilization; (b) modern circulation of lead.
Sea
Water
Atmos.
Ecosystems
& Soils
Land
Rain
Runoff
Ore
Sediments
Deltas
Wetlands
River Dispersal
Economy
Fuels
Solid
Wastes:
Air
Liquid
Deep
Earth
Deposition
210
2E-5
2.5
x 10
9
grams per year
720
400
440
320
94
4000
34
60
Open
Sea
Water
Atmos.
Land
Rain
Runoff
Ore
Sediments, Deltas, Wetlands
River Dispersal
Deep
Earth
Deposition
2.5?
x 10
9
grams per year
94
Volcanos
Volcanic
0.4
(b)
(a)
180
32
Ecosystems
& Soils
34
180
5.5
<<1
4
2
L1401-frame-C4 Page 56 Monday, April 10, 2000 9:29 AM
© 2000 by CRC Press LLC
BIOGEOCHEMICAL CYCLE OF LEAD AND THE ENERGY HIERARCHY 57
family accounts a budget, we can refer to the summary diagram and numerical values of a chemical
material as a biogeochemical budget.
Garrels et al. (1975) assembled data for the quantity of lead in different phases of the earth and
estimated the flows of lead along the pathways from one part to another. Nriagu (1978b) evaluated
the main pathways of flow of lead in its global cycle. Pritchard (1992) summarized these flows
with a complex energy systems diagram.
In Figure 4.6 we overview the global lead cycle by including only the most important pathways
(from Figure 4.5), thus showing how flows are processed through the main units of each level of
the biogeosphere’s hierarchy. After assembling data from literature (Appendix Table A4.1), the
flows of lead in billion grams per year (109 g/year) were written on the pathways.
Salomons and Förstner (1984) assembled graphs by Whitfield and associates (Whitfield and
Turner, 1982) that explain the concentrations of heavy metals in the sea in terms of element flux
as part of the global sedimentary cycle evaluated as in approximate steady state. Depending on the
elements, positive charged atoms are bound to negatively oxidized charged sediment particles that
wash to the sea, settling to the sediments, which are eventually uplifted in the earth cycle. The
more tightly they are bound (greater electronegativity function), the less they exchange with waters
(partition coefficient). The more tightly they are bound, the less time they remain in river and
seawaters (smaller residence time). The shorter the residence time the lower the concentrations in
the seawaters.
The concentrations of lead in the sea were kept very small by several biogeochemical mecha-
nisms. Goldberg and Arrhenius (1958) found lead ions in aquatic chloro-complexes becoming
bound in deep sea manganite 20 to 200 ppm in sediment and 2000 ppm in manganese nodules.
Chow and Patterson (1962) found 21 ppm lead in deep sea ooze, 38 to 84 ppm in clays. They
Figure 4.6c
Lead storages in the biogeosphere (Table A4.1).
10
5
10
20
10
15
10
10
Sea
Water
Atmos.
Soils
Eco-
systems
Sedi-
ment
Land
Lead
Ores
(c) Stored Lead
Lead, grams
= Recent concentrations
Original
Civili-
zation
L1401-frame-C4 Page 57 Monday, April 10, 2000 9:29 AM
© 2000 by CRC Press LLC
58 HEAVY METALS IN THE ENVIRONMENT: USING WETLANDS FOR THEIR REMOVAL
estimated mechanical deposition rate 2
×
10
–6
g/cm
2
/1000 years and chemical rate 4.7 in these
units. Pelagic lead was 2/3 precipitated and 1/3 as particles. Tatsumoto and Patterson (1963) found
0.002 to 0.20 ppb lead in Atlantic and Mediterranean seawaters, and in the Mediterranean and
Pacific up to 0.38 ppb in surface waters, diminishing to 0.01 ppb below 1000 m.
Figure 4.6a has estimates of the flows of lead cycle before civilization. The circulation of lead
was relatively small. This diagram has no civilization-economy unit on the far right. By 1971
Bertine and Goldberg recognized that the fluxes of heavy metals due to civilization were approach-
ing those of the natural cycle of land uplift and weathering. The lead emission soon exceeded the
natural lead cycle (Volesky, 1990).
Figure 4.6b has estimates of lead flows in our current condition. Adding civilization to the
biogeosphere added higher levels to the energy hierarchy, and the result was a further concentrating
of heavy metals. From cars and industry on the right, the high values of lead recycle as air, liquid,
and solid wastes dispersed to waters and land to the left. The actions of humans in using and
dispersing lead increased the lead circulation ten times (Figure 4.6b).
Lantzy and Mackenzie (1979) compare the emissions from the human civilization to the regular
biogeochemical cycle of the elements. Heavy metals in soils were in proportion to the levels in
shales from which soil was derived. They defined an interference factor as the ratio of anthropogenic
to natural fluxes of an element. For lead the factor was 34,583. Lead in the rainout was 21% higher
than in the stream load. As stimulated by human use and releases, lead was atmophilic. Lead cycle
was given as 5
×
10
8
g/year in its continental part and 8.7 in its volcanic part, 0.012 in volcanic
gas, and 0.016 in fumaroles and hot springs. The industrial part was 16,000
×
10
8
and 4300
×
10
8
g/year from fossil fuel use.
Förstner and Whittmann (1979) provided an environmental index of relative pollution potential
equal to the metal concentration divided by the average metal content. The ratio for lead was 35.
Another index, the Technophility, was defined as the ratio of annual output of lead to the mean
concentration in the earth’s crust (sometimes called a Clarke in honor of a pioneer in evaluating
geochemical cycles).
EMERGY OF MATERIALS IN A BIOGEOCHEMICAL CYCLE
There is a natural tendency for concentrated things to disperse. This tendency is the second
energy law. It takes work to concentrate things and keep them concentrated against the natural
dispersal tendency. As we explained in Chapter 1, various kinds of work can be put on a common
basis as emergy. Emergy is defined as the memory of available energy of one kind previously used
up directly and indirectly to make a product. Its unit is the emjoule. In this book we use solar
emergy (solar emjoules, abbreviated sej).
Since work is required to concentrate materials, higher concentrations of material require more
emergy per mass. In other words, emergy is required to concentrate materials and keep them
concentrated. The ratio of emergy to mass of materials is a useful measure of work that has been
applied to materials.
Thus, emergy can be related to the hierarchical position of elements circulating as part of systems.
Emergy is added to the material cycle as it is converged to a hierarchical center where it is more
concentrated. For example, in the simplified model of a tree in Figure 4.2, elements become more
concentrated in producing the organic matter of the trunk. The organic product carries the emergy
of the inputs that went into that development. When the product is decomposed, the elements that
are released carry the emergy of the product. Emergy per mass decreases when a material disperses
as it recycles outward, becoming less concentrated (passing to the left in Figures 4.2 and 4.3).
The lowest emergy per mass is zero. A chemical substance which is at the lowest background
concentration of the biogeosphere has no available energy and thus has no emergy. It cannot disperse
or depreciate any further by diffusion, being already at the lowest concentration.
L1401-frame-C4 Page 58 Monday, April 10, 2000 9:29 AM
© 2000 by CRC Press LLC
BIOGEOCHEMICAL CYCLE OF LEAD AND THE ENERGY HIERARCHY 59
EMERGY PER MASS OF LEAD
In the hierarchy of units of the biogeosphere (Figures 4.4 to 4.6), higher concentrations of lead
are on the right (Table 4.1) where more emergy has been processed to sustain them. In the
biogeosphere the processes of the earth add emergy as they converge and concentrate heavy metals
in making the ore bodies that develop in and around high temperature mountain building (Figure
4.5b). Lead ore (in the form of crystals of lead minerals dispersed in rocks) is associated with
centers of mountain building to which the earth cycles converge.
The human society adds emergy from fuels, machinery, and people when it mines minerals and
refines elements further into technological form such as electrical storage batteries or gasoline additives
(now discontinued in the U.S.). The more work goes into concentrating the lead, the higher the emergy
per mass. Spatially, refined lead is concentrated in cities and transportation corridors.
Where lead is processed as a trace element within the cycle of the earth matter, we can assign
a small part of the annual emergy budget that drives global land cycle according to the lead
proportion (1
×
10
–5
g lead per gram of land). The global emergy budget of 9.44
×
10
24
sej/year
divided by the global land cycle 9.36
×
10
15
g/year equals 1.0
×
10
9
sej/g. The share of emergy
budget for lead within the land cycle is
(1
×
10
–5
g/g)(9.36
×
10
15
g/year)(1
×
10
9
sej/g)
= 9.36
×
10
19
sej/year
At the hierarchical center of the cycle, the material may be at its highest emergy content per
gram because much work was exerted in developing the concentration, first by the earth and then
by the human economic system. Pritchard, in Appendix A11, Figure A11.7 and Table A11.6, evaluates
the emergy of lead processing, obtaining an emergy per mass of refined lead as 7.34 E10 sej/g.
For lead, values for different degrees of concentration were plotted in Figure 4.7 as a function
of emergy per mass of lead expressed as emjoules per gram (data from Appendix Table A4.3). The
resulting graph shows higher emergy/mass for higher concentrations of lead consistent with the
ideas about materials and energy hierarchy. Graphs of this type may be useful for estimating
transformities from observed concentrations.
Table 4.1 Values of Lead Circulation
Note Item
Lead Flow
(g/yr)
Emergy/
Mass (sej/g)
Emergy/
Year (sej/yr)
Value
(E9 EM$/yr)
1 Land cycle 9.36 E10 1 E9 9.36 E19 0.062
2 Economic
use
4.0 E12 4.5 E9 1.8 E22 12
3 Dilute
wastes
5.34 E11 2 E8 1.06 E20 0.071
Abbreviations:
E9 =
×
10
9
; Em$ = emdollars.
Note:
Emergy divided by global emergy/money ratio for 1995: 1.5 E12 sej/$ (Brown and
Ulgiati, 1999).
1 Land cycle: (2.4 cm/1000 years)(1.5 E14 m
2
)(1 E4 cm
2
/m
2
)(2.6 g/cm
3
) = 9.36 E15
g/year; lead fraction 10
Ð 5
; (9.36 E15 g/year)(1 E-5) = 9.36 E10 g/year
.
Emergy/mass that of the land cycle: (9.44 E24 sej/year)/(9.36 E15 g/year) = 1 E9 sej/g.
2 Mine production (Nriagu, 1978).
Emergy/mass from Appendix Table A4.3.
3 Lead ß ows as dilute wastes from Figure 4.6: air, 4.4 E11 g/year; liquid, 6.0 E10
g/year; solid, 3.4 E10 g/year; total, 53.4 E10 g/year. Emergy/gram for dilute concen-
trations assumed from Figure 4.7.
L1401-frame-C4 Page 59 Monday, April 10, 2000 9:29 AM
© 2000 by CRC Press LLC
fl
60 HEAVY METALS IN THE ENVIRONMENT: USING WETLANDS FOR THEIR REMOVAL
Another way to evaluate a lower concentration is to evaluate how much additional emergy
would be required to concentrate the lead further to the refined state. Then this amount of emergy
can be subtracted from the emergy per gram of the refined state to get a value for the lesser state.
TRANSFORMITY, THE EMERGY PER UNIT ENERGY
If the available energy in a flow is known, transformity, defined as the emergy per unit energy,
can be calculated. Transformity increases along the energy hierarchy. For example, Figure 4.1
shows decreasing energy flows for the same emergy flows, which means the transformity
increases. If the energy source is solar energy, then the solar transformity of the inflow to the
first unit is 100 sej/100 J = 1 sej/J; the flow to the second unit is 100 sej/10 J = 10 sej/J; the
flow to the third unit is 100 sej/1 J = 100 sej/J; and the output of the third unit is 100 sej/0.1 J
= 1000 sej/J. We can use the transformity to mark position in the energy hierarchy, high values
to the right.
Genoni and Montague (1995) calculated transformities for heavy metals and compared these
with transformities of items in the food chains. Higher transformity substances were found higher
in the food chains with high transformity species. This was evidence that products that took more
emergy to make are used higher in the energy hierarchy where their effects are greater.
THE WETLAND AS A HEAVY METAL FILTER
As more wetlands are studied it is becoming apparent that wetlands self-organize in great
variety, adapting to various kinds of inflows of water, organic matter, sediments, and various
chemicals, including the heavy metals. Many materials including heavy metals are captured and
recycled largely within the wetland ecosystem.
In the diagram in Figure 4.8 a wetland is aggregated to show the main source of emergy and
the recycle of lead. Emergy per mass in dilute recycling lead was estimated by evaluating annual
emergy flow maintaining the lead-containing wetland ecosystem in Florida reported in Part II. The
Figure 4.7
Graph of emergy per unit mass of lead for different concentrations of lead in the earth system.
Values are explained in the text with calculations in Appendix Table A4.3.
Lead Concentration, grams per cubic meter
10
-5
10
+5
10
+8
EMERGY
per mass
x 10
9
solar
emjoules
per gram
Refined Lead
Lead Ore
Within Land
Ocean
Leaded Wetland
5
0
8
1
L1401-frame-C4 Page 60 Monday, April 10, 2000 9:29 AM
© 2000 by CRC Press LLC
BIOGEOCHEMICAL CYCLE OF LEAD AND THE ENERGY HIERARCHY 61
inflowing waters carry emergy of the flooding physical energy developed by geopotential work
upstream and that in the chemical potential energy of the water used in the transpiration that makes
the vegetation productive. To obtain the emergy per mass of the circulating lead, the annual emergy
driving the recycling loop was divided by the annual lead circulating in the ecosystem, being
concentrated by plants and sediments and released again by consumers = 1.73 sej/g lead (see
Appendix Table A4.1, Note 3).
ECOSYSTEMS DIAGRAM SHOWING MECHANISMS
More of the details found in many wetlands are shown with their relationships in Figure 4.9.
The interaction symbols (pointed blocks) show the action of one input on another and vice versa.
There is physical absorption of particles by plant biomass and uptake of dissolved substances by
the plant roots, facilitated by the uptake and transpiration of water by the plants. Heavy metals are
bound to the humic substances of the peaty organic sediments formed from plant decomposition
(lignin binding, Lb).
Consumers, including other microorganisms, small animals (microzoa), and larger wildlife
(hexagon symbol defined in Figure 4.5), release and recycle some heavy metals as they carry out
their metabolism. Very little heavy metal flows out with overflowing waters. The organic sediments
hold heavy metals by several mechanisms. Some metals are precipitated as insoluble sulfides, where
metabolism without oxygen (anaerobic) forms sulfide gas (H
2
S) from sulfates. Where sulfates in
fresh waters are abnormally high, there is too much sulfide gas and trees are stressed (Richardson
Figure 4.8
Aggregated diagram of a wetland ecosystem and evaluation of the emergy per mass of its recircu-
lating lead (see Note 3 in Appendix Table A4.3).
Wetland
Vegetation &
Sediments
Animals &
Consumers in
Sediments
Sun
EMERGY
Source
6.3 E10 sej
Waters &
Sediments
Recycled Elements
Emergy per Lead Mass = ________________ = 1.73 E9 solar emjoules/gram
6.3 E10 sej/m
2
/year
36.5 g/m
2
/year
Flows per square meter per year
36.5 g Lea
d
L1401-frame-C4 Page 61 Monday, April 10, 2000 9:29 AM
© 2000 by CRC Press LLC
62 HEAVY METALS IN THE ENVIRONMENT: USING WETLANDS FOR THEIR REMOVAL
et al., 1983). However, where sulfates are normally high as in salt waters, the salt marsh and
mangrove plants that prevail are adapted to function well.
Mathematical relationships are indicated by the configurations of symbols and pathways in
Figure 4.9. Equations for computer computation that are implied by the symbols and connections
in the diagram can be used to simulate the behavior of the system. For example, Chapter 8 contains
a simulation of a model of lead uptake by a lead-filled Florida cypress swamp.
Wójcik (1993) calculated emergy requirements for uptake of lead and zinc by a Polish wetland
by summing the input pathways shown in Figure 4.10. Whereas Figure 4.9 has detailed interactions
of energy and materials, the diagram in Figure 4.10 shows only the pathways of emergy input that
were evaluated. Wójcik found economic costs and emergy of purchased inputs less for the wetland
compared to technological treatment. See Chapter 12.
SPATIAL PATTERN OF DISPERSAL
We showed in Figures 4.2 and 4.3 the way a circulating material recycles out from its most
concentrated and valuable state in a hierarchical center. Before civilization, lead was most
concentrated in ore bodies and dispersed outward when these were recycled by earth processes,
as in volcanic emissions and erosion. Spatially, the centers of concentration in ore bodies and
Figure 4.9
Diagram of a wetland system showing the way heavy metals are Þ ltered and stored. See explanation
in text. Lb = binding by lignin.
Sun
Wind
Plants
Biomass
Dissolved
Elements
Particles
Water
Anaerobic
Microbes
H
2
S
Waters
with
Heavy
Metals
Microbes
Microzoa
Transpiration
Organic
Sediment
Animals
Wildlife
Wetland
= Flow of Heavy Metal
Recycle
Lb
Metals
Outflows
L1401-frame-C4 Page 62 Monday, April 10, 2000 9:29 AM
© 2000 by CRC Press LLC
fi
BIOGEOCHEMICAL CYCLE OF LEAD AND THE ENERGY HIERARCHY 63
the lead concentrations in derived soils scattered across a landscape are not unlike a pattern of
scattered villages. See, for example, the map of lead in England (from J.S. Webb cited by
Nriagu, 1978).
With the further concentrations in civilization, first by Romans, and even more by modern
economy, the highest concentrations and values are in the centers of the energy hierarchy of
civilization, the industries and cities. Nriagu (1978) documented in great detail the high concen-
trations of lead as they flow out from cities in air, water, and solid waste disposal. For example,
Figure 4.11 shows the concentrations in air to be highest around the areas of lead smelting and
most urbanized use. Note the high atmospheric concentrations in Poland, where the wetlands
provided catchment of water and air wastes, as described in Part III.
These centers of concentrations are located on the surface of the land, and going away lead
concentrations decrease. The lead in the air is greatest near the ground with lesser concentrations
higher in the atmosphere (Figure 4.12). Within the lower atmospheric system considerable emergy
is processed to develop air, water vapor, and heavy metals in the upper atmosphere. When some
lead is pumped into the upper air, its emergy per mass is increased. Perhaps trace elements that
reach the tops of high mountains may have interactions with vegetation and land commensurate
with the higher emergy concentrations there.
Lead in the atmosphere in particles and aerosols has a turnover time of 2 to 10 days before
falling on the land or the sea (Nriagu, 1978). Near the urban centers the content is maintained at
about 500 to 5000 ng/m
3
. (A nanogram = 10
–9
g.) Away from cities and developed countries the
air content is about 0.1 to 10 ng/m
3
.
The fallout of anthropogenic lead from the atmosphere over the ocean created high concen-
trations (0.5 to 3.5
µ
g/kg), mainly in the upper 1000 m (Chow, 1978). Apparently much of this
lead is captured by the processes of coastal sedimentation and wetlands before it can disperse
into deeper waters. Since the oceanic systems may not be adapted to benefit from high lead
concentrations, short circuiting atmospheric dispersal appears to be a better global design for
use of its emergy value.
Figure 4.10
Diagram of the sources contributing emergy to Polish wetland treatment of lead and zinc
Sun
Water
Nutrients
Lead
Zinc
Water
Processing
Wetland
Plants
Peaty
Sediment
Organics
Zinc & Lead
Goods
Services
Fuels
Costs
Invest-
ments
$
$
Wetland Treatment
L1401-frame-C4 Page 63 Monday, April 10, 2000 9:29 AM
© 2000 by CRC Press LLC
wastewaters as evaluated by Wójcik (1993).
64 HEAVY METALS IN THE ENVIRONMENT: USING WETLANDS FOR THEIR REMOVAL
On land, lead recirculation flows out from cities along transportation corridors, highways, and
railroads in lead gasoline additives, fuel combustion, in lead batteries, automobile dumps, and solid
waste deposits (Nriagu, 1978). Increasingly now, the concentrated lead of batteries is recycled to
battery recovery plants that reuse the lead. However, when they are too dilute for economic recovery,
the dilute wastes require wetland recovery (see Chapter 11).
Many papers have reported the decreasing concentrations of lead out from emission centers.
With a dense pattern of sampling and analysis, for example, Simpson (1985) used a statistical
method (Kriging) to locate isopleths of lead concentration in soils at distances of 0 to 12,500 ft
from a lead smelter. The dispersal of heavy metals from a hierarchical energy processing center
provides a neat example of how matching of outward dispersal feedbacks of high impact can result
from the inward converging that concentrates value and transformity (Figure 4.3a). Impact on
environment decreases with lead concentration, and dispersal decreases concentration. The impact
of the dispersing emissions is commensurate with the emergy concentrated by the earth and/or
humans toward the center. The impact forms patchy circles of concentration measured by transfor-
mity of the dispersal and the empower density of the landscape work. Hierarchical element distri-
bution is readily understood in situations with anthropogenic point source pollution, but hierarchical
elemental distributions are usual in nature and in civilized landscapes where mechanisms are many.
Figure 4.11
Concentration of lead in European rainfall in the mid-1980s. (From Alcamo, J., 1991.
Options
,
September, International Institute of Applied Systems Analysis, Laxenburg, Austria. With permission.)
L1401-frame-C4 Page 64 Monday, April 10, 2000 9:29 AM
© 2000 by CRC Press LLC
BIOGEOCHEMICAL CYCLE OF LEAD AND THE ENERGY HIERARCHY 65
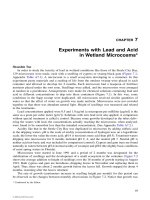
FREQUENCY DISTRIBUTIONS
Frequency distributions are bar graphs that show many areas with small concentrations and
few areas with high concentrations. These graphs have a typical hollow shape representing the
common and the rare. See, for example, in Figure 4.13, the distribution of lead in granite rocks
(Ahrens, 1954). Many theoretical papers consider the uneven distribution of geochemical
elements, often represented with log-normal plots. See, for example, Skinner (1986), Miller
and Goldberg (1955), Middleton (1970), and Roberts et al. (1998). Graphs of decreasing
frequency with increasing concentration result from the spatial pattern that goes with the energy
hierarchy (Figure 4.3). The details and mechanisms may vary, but the most general explanation
seems to be that materials are distributed according to the universal energy hierarchy, possibly
in all systems.
Figure 4.13a is the distribution of lead in crustal rocks, which Ahrens (1954) showed was a
close fit to a lognormal distribution. On any scale it takes available energy appropriate for that
scale to concentrate materials. For example, Genoni (1998) relates the Gibbs free energy used up
in concentrating chemical substances to higher specific Gibbs free energy; or when generalized
to available energy of all kinds, the principle is expressed in emergy terms. Emergy has to be
used to concentrate materials, as already explained with Figure 4.7. Depending on its nature, each
kind of material has a range of emergy per gram that determines its place of cycling in the universal
energy hierarchy. From a dispersed state over large areas it is coupled to the self-organizational
concentrating and diluting circulation (Figure 4.3). The emergy available to a landscape (solar
energy and energy from geologic processes below) is proportional to the area, but at each
hierarchical step transformation, the emergy is concentrated at a hierarchical center and the
materials with it. Thus, the skewed pattern of chemical distributions in the environment may be
Figure 4.12
Distribution of atmospheric heavy metals with altitude: fraction of those at 50 m. N = condensation
nuclei. (Zhigalovskaya et al. given by Dobrovolsky, 1994.)
4000
3000
1000
500
Cu
Pb
N
0 0.2 0.4
0.6 0.8 1.0
Concentration Ratio
2000
Altitude, m
L1401-frame-C4 Page 65 Monday, April 10, 2000 9:29 AM
© 2000 by CRC Press LLC
66 HEAVY METALS IN THE ENVIRONMENT: USING WETLANDS FOR THEIR REMOVAL
explained by the coupling of materials to the emergy concentrating, transformity increasing pattern
of universal energy hierarchy. The steep left side of the distribution connects the general back-
ground concentration (the peak of the distribution dependent on the crustal abundance) to the
minimum concentration, something greater than zero, the realm of small-scale processes.
In human economic self-organizing, as with geobiologic self-organizing, available energy
concentrates and transports materials to centers. Huge fuel and electrical energies are used by
industry to mine and process the heavy metals from landscape to city use. Page and Creasy (1975)
published steep hollow curves for resources required to concentrate ores of different concentration
(Figure 4.13b). Expressing those results in another way, for the same fuel, the higher the levels
Figure 4.13
Metal distributions and energy hierarchy. (a) Lognormal distribution of lead in granite rocks. (From
mission from Elsevier Science.) (b) Rock required to concentrate metals (Page and Creasy, 1975).
(a)
(b)
0
24
68
10
0
200
400
600
Metal content of rocks, in weight percent
800
1000
Lead in
Canadian Granite
15
10
5
0 10 20
30
40
50
60
70
80
-1.2
0.0
0.8 1.6
2.4
log ppm Pb
15
5
0
5 ppm
interval
Number per interval
Number per interval
ppm Pb
10
Tons of rock required to produce
one ton of metal
0
L1401-frame-C4 Page 66 Monday, April 10, 2000 9:29 AM
© 2000 by CRC Press LLC
Ahrens, L.H., 1954. Geochimica et Cosmochimica Acta, 5:49–73; [Part 2] 6:121–131. With per-
BIOGEOCHEMICAL CYCLE OF LEAD AND THE ENERGY HIERARCHY 67
of concentration the less quantity is transformed. In other words, distribution of metal concentra-
tion within civilization is like that in nature for a similar reason, the coupling of materials to the
energy hierarchy.
The spatial organization of cities also has the pattern in Figure 4.3, with empower density
(solar emjoules per area per time), transformity, and money circulation increasing toward the
center (Odum, 1996). Rolfe et al. (1972) and Rolfe and Haney (1975) mapped the way heavy
metals circulated with society and environment in Urbana, IL. There were annual pulses, with
most lead immobilized in soils and stream sediments without biological magnification. Palm and
Ostlund (1996) measured lead flows in Stockholm, Sweden. Heavy metal concentrations and
their high transformities have parallel distributions increasing toward the city center. The emergy
measures show where circulating materials tend to concentrate during the self-organization of
the economy and environment. According to the theory, materials will tend to interact and impact
(for benefit or disruption) with items in the landscape with transformities within one or two
orders of magnitude.
HUMAN INTERACTIONS WITH LEAD
Several authors have summarized the distribution and flows of lead in normal human beings
with diagrams of the daily budget of lead (Patterson, 1973; Rabinowitch et al., 1976; Fergusson,
to the right, the most controlling and valuable component.
According to energy hierarchy concepts, self-organization reinforces the interaction of items
which can amplify the productive output of their mutual participation. Typically, a small flow of
higher transformity can have most effect by interacting with a matching flow with more energy but
somewhat lower transformity flow. Heavy metals with high transformities thus have amplifier,
controlling effects by interacting with parts of the biogeosphere with lesser positions in the energy
hierarchy. Such interactions are system reinforcing where the interaction produces a useful output.
Figure 4.14
Energy systems diagram of the ß ows and storages of lead in a human being using values from
Fergusson (1990).
Food &
Water
Air
Intestine
Lung
Blood
Brain
0.73
Soft
Tissues
Bone
2.5
100
165
11
4.4
16.5
16
7
Feces
Urine>149
16
6
4
= Lead Flow
Human Body
Milligrams/day
= Storage Pool
L1401-frame-C4 Page 67 Monday, April 10, 2000 9:29 AM
© 2000 by CRC Press LLC
fl
1990). Values from the later budget have been applied to an energy systems diagram in Figure
4.14, which has the parts of the human arranged according to the energy hierarchy with the brain
68 HEAVY METALS IN THE ENVIRONMENT: USING WETLANDS FOR THEIR REMOVAL
However, heavy metals can combine and divert many aspects of the physiological system of life
(enzymes, chlorophyll operations). Toxicity develops when high transformity substances are not
appropriately organized with beneficial interactions.
Human beings, their brains, and their information processing have higher emergy per gram and
transformity than heavy metals. In a functioning organization, the humans, their brains, and infor-
mation interact with, but control, the lead processes and cycles. The system is functionally disturbed
when the reverse happens and the heavy metals affect the humans by interfering with the living
physiology. Förstner and Wittmann (1979) reviewed damage of lead poisoning to brains and
kidneys, often causing early deaths.
Thus, a good system channels high transformity flows to reinforce the larger system functions,
organizing to insulate their capabilities of disruption. The long-evolving biogeosphere does this by
providing humic substances in all its ecosystems, especially in wetlands where peat deposits helped
regulate the earth’s heavy metal cycles. Humans are learning to isolate pathways by controlling
the use of lead in paints, in gasoline, and batteries that can impact humans or the environment.
EVALUATION PERSPECTIVES
Nriagu (1994), in a later summary of lead in the environment, finds soils as lead sinks, aquatic
environment as most vulnerable, less lead in the atmosphere than earlier, but metal pollution still
increasing. With the U.S. using 22%, the world from 1901 to 1990 received 2 million tonnes of
lead and 13 million tonnes of zinc from industrial emissions. Lead emission from energy processing
was estimated as 13, mining 2.6, smelting and refining 23, waste incineration 2.4, leaded gas 250,
and total industrial 330. Total natural emission was 12 million kg/year.
Skinner (1986) ranked heavy metals by the concentration over the general background level of
the earth’s crust necessary to be commercial. The more abundant the element, the less cost in
concentrating and the higher the percent required for mining. Whereas commercial iron and
aluminum deposits need to be 25 and 30% (5 times background), zinc needs to be 2.5% (300 times
background) and lead 4.0% (4000 times background). The higher the crustal abundance, the larger
are the sizes of the largest deposits discovered. For many elements there is a thousand times greater
energy requirement for retrieving metals from crustal rocks compared to mining sulfide ores. The
sulfide ore bodies are hierarchical centers of geologic work (example: volcanoes) with high trans-
formity. Their concentration was made possible by large earth empower processing. The concluding
implication was that ore body metals are economical, but those dispersed in the crustal rocks are
usually not.
Emergy per mass suggests the appropriate policy regarding recycle. Wastes with concentrations
above about 10,000 g/m
3
(Figure 4.7) have enough value to justify economic reuse. Wastes with
uneconomical concentrations may still have enough emergy per mass to make a contribution to the
natural recycle of land and water.
As explained in Chapter 1 (Figure 1.8), emergy flows have emdollar equivalents for evaluating
processes in terms of gross economic product. For perspective on the importance of lead, global
flows are given their emdollar values in Table 4.1. The value of lead ores used by the economy is
12 billion emdollars per year, 200 times more contribution than in the lead dispersed in earth of
the main land cycle. Lead dispersed in wastes is about 71 million emdollars, similar in magnitude
to the lead in the natural cycle.
L1401-frame-C4 Page 68 Monday, April 10, 2000 9:29 AM
© 2000 by CRC Press LLC