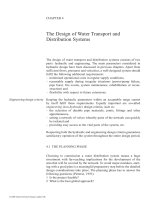
INTRODUCTION TO URBAN WATER DISTRIBUTION - CHAPTER 7 (end) ppt
Bạn đang xem bản rút gọn của tài liệu. Xem và tải ngay bản đầy đủ của tài liệu tại đây (7.86 MB, 227 trang )
APPENDIX 1
Workshop Problems
A1.1 WATER DEMAND
PROBLEM A1.1.1
Determine the production capacity of a treatment installation for a city
with a population of 1,250,000. Assume a specific consumption per capita
of 150 l/d, non-domestic water use of 30,000,000 m
3
/y and UFW of 12%.
Answer:
Q
avg
ϭ 112 million m
3
/y or 3.6 m
3
/s
PROBLEM A1.1.2
A water supply company delivers an annual quantity of 15,000,000 m
3
to
a distribution area of 100,000 consumers. At the same time, the collected
revenue is 6,000,000 US$, at an average water tariff of 0.5 US$/m
3
.
Determine:
a the delivery on an average consumption day,
b the percentage of unaccounted-for water,
c the specific consumption per capita per day, assuming 60% of the total
delivery is for domestic use.
Note:
b Express the unaccounted-for water as a percentage of the delivered
water.
Answers:
a Q
avg
ϭ 41,096 m
3
/d or 1712 m
3
/h
b UFW ϭ 20%
c q ϭ 247 l/c/d
PROBLEM 1.3
A family of four pays for annual water consumption of 185 m
3
.
Determine:
a the specific consumption per capita per day,
b the instantaneous peak factor at a flow of 300 l/h.
Answers:
a q ϭ 127 l/c/d
b pf
ins
ϭ 14
© 2006 Taylor & Francis Group, London, UK
278 Introduction to Urban Water Distribution
PROBLEM A1.1.4
An apartment building of 76 occupants pays for an annual water
consumption of 4770 m
3
. Determine:
a the specific consumption per capita per day,
b the instantaneous peak factor during the maximum consumption flow
of 5.5 m
3
/h.
Answers:
a q ϭ 172 l/c/d
b pf
ins
ϭ 10
PROBLEM A1.1.5
A residential area of 1200 inhabitants is supplied with an annual water
quantity of 63,800 m
3
, which includes leakage estimated at 10% of the
total supply. During the same period, the maximum flow registered by
the district flow meter is 25.4 m
3
/h. Determine:
a the specific consumption per capita per day,
b the maximum instantaneous peak factor.
Note:
a Specific consumption should not include leakage.
b Peak factors include leakage unless the flow is measured at the service
connection.
Answers:
a q ϭ 131 l/c/d
b pf
ins
ϭ 3.5
PROBLEM A1.1.6
A water supply company delivers an annual volume of 13,350,000 m
3
.
The maximum daily demand of 42,420 m
3
was observed on 26 July. The
minimum, observed on 30 January, was 27,360 m
3
. The following
delivery was registered on 11 March:
Hour123456789101112
m
3
433 562 644 835 1450 1644 1856 1922 1936 1887 1721 1712
Hour 13 14 15 16 17 18 19 20 21 22 23 24
m
3
1634 1656 1789 1925 2087 2055 1944 1453 1218 813 676 602
Determine:
a delivery on an average consumption day and the range of seasonal
peak factors,
b the diurnal peak factor diagram,
c the expected annual range of peak flows supplied to the area.
Answers:
a Q
avg
ϭ 36,575 m
3
/d; pf
sea
ϭ 0.75–1.16
b Q
avg
ϭ 1435.6 m
3
/h
© 2006 Taylor & Francis Group, London, UK
Workshop Problems 279
Hour 123456789101112
pf
h
0.302 0.391 0.449 0.582 1.010 1.145 1.293 1.339 1.349 1.314 1.199 1.193
Hour 13 14 15 16 17 18 19 20 21 22 23 24
pf
h
1.138 1.154 1.246 1.341 1.454 1.431 1.354 1.012 0.848 0.566 0.471 0.419
Note that 11 March is not an average consumption day. The average flow
derived from the annual quantity is Q
avg
ϭ 1524 m
3
/h.
c Q
max
ϭ 2563 m
3
/h; Q
min
ϭ 343 m
3
/h
PROBLEM A1.1.7
Estimated leakage in the area from Problem 1.6 is 20% of the daily supply.
The leakage level is assumed to be constant over 24 houes Calculate the
hourly peak factors for the actual consumption on 11 March.
Note:
Leakage of 20% means a constant flow (loss) of 287.1 m
3
/h.
Answer:
Q
avg
ϭ 1148.5 m
3
/h
Hour 123456789101112
pf
h
0.127 0.239 0.311 0.477 1.013 1.181 1.366 1.424 1.436 1.393 1.249 1.241
Hour 13 14 15 16 17 18 19 20 21 22 23 24
pf
h
1.173 1.192 1.308 1.426 1.567 1.539 1.443 1.015 0.811 0.458 0.339 0.274
PROBLEM A1.1.8
The consumption calculated in Problem A1.1.7 consists of three cate-
gories: domestic, industrial and commercial. The industrial category
contributes to the overall consumption with a constant flow of 300 m
3
/h,
between 8 a.m. and 8 p.m. The commercial category requires a flow of
100 m
3
/h, between 8 a.m. and 4 p.m.
a Determine the hourly peak factors for the domestic consumption
category.
b Assuming the industrial and commercial consumption to be constant
throughout the whole year, calculate the average consumption per
capita if there are 150,000 people in the area.
Answers:
a Q
avg
ϭ 965.2 m
3
/h
Hour 123456789101112
pf
h
0.151 0.285 0.370 0.568 1.205 1.406 1.626 1.279 1.294 1.243 1.071 1.062
Hour 13 14 15 16 17 18 19 20 21 22 23 24
pf
h
0.981 1.004 1.142 1.386 1.554 1.521 1.406 1.208 0.965 0.545 0.403 0.326
b q ϭ 166 l/c/d
© 2006 Taylor & Francis Group, London, UK
280 Introduction to Urban Water Distribution
PROBLEM A1.1.9
The registered annual domestic consumption is presently 38.2 million m
3
.
Determine:
a the consumption after the first 10 years, assuming an annual popula-
tion growth of 3.8%,
b the consumption after the following 10 years (11–20) assuming an
annual population growth of 2.2%.
Compare the results of the Linear and Exponential models discussed in
Paragraph 2.4.
Answers:
a In 10 years from now: Q
lin
ϭ 52.7 million m
3
; Q
exp
ϭ 55.5 million m
3
b In 20 years from now: Q
lin
ϭ 64.3 million m
3
; Q
exp
ϭ 69.0 million m
3
PROBLEM A1.1.10
The following annual consumptions were registered in the period
1990–1995 (in million m
3
):
Year 1990 1991 1992 1993 1994 1995
Q (10
6
m
3
) 125.4 131.8 138.2 145.4 152.6 159.9
Make a forecast for the year 2005.
Answer:
Q
2005
ϭ 260.7 million m
3
(exponential growth of 5%)
A1.2 SINGLE PIPE CALCULATION
PROBLEM A1.2.1
A pipe of length L ϭ 500 m, diameter D ϭ 300 mm and absolute rough-
ness k ϭ 0.02 mm transports a flow Q ϭ 456 m
3
/h. Determine the
hydraulic gradient by using the Darcy–Weisbach formula. The water
temperature may be assumed to be 10ЊC. Check the result by using the
hydraulic tables in Appendix 4.
Answer:
By using the Darcy–Weisbach formula, S ϭ 0.0079.
From the tables for k ϭ 0.01 mm, S ϭ 0.007 if Q ϭ 434.1 m
3
/h. If
S ϭ 0.010, Q ϭ 526.9 m
3
/h. By linear interpolation: S ϭ 0.0077, which
is close to the calculated result.
PROBLEM A1.2.2
A pipe of length L ϭ 275 m, diameter D ϭ 150 mm and absolute
roughness k ϭ 0.1 mm transports a flow Q ϭ 80 m
3
/h. Determine the
hydraulic gradient by using the Darcy–Weisbach formula. The water
© 2006 Taylor & Francis Group, London, UK
Workshop Problems 281
temperature may be assumed to be 15ЊC. Check the result by using the
hydraulic tables in Appendix 4.
Answer:
S ϭ 0.0108;
From the tables for k ϭ 0.1 mm, S ϭ 0.010 if Q ϭ 76.7 m
3
/h.
PROBLEM A1.2.3
A pipe of length L ϭ 1000 m and diameter D ϭ 800 mm transports a
flow Q ϭ 1.2 m
3
/s. Determine the hydraulic gradient:
a by using the Darcy–Weisbach formula for k ϭ 0.2 mm,
b the Hazen–Williams formula for C
hw
ϭ 130,
c the Manning formula for N ϭ 0.010 m
Ϫ1/3
s.
The water temperature may be assumed to be 10ЊC.
Answers:
a S ϭ 0.0055
b S ϭ 0.0054
c S ϭ 0.0049
PROBLEM A1.2.4
Determine the maximum capacity of a pipe where D ϭ 400 mm and
k ϭ 0.5 mm at the maximum-allowed hydraulic gradient S
max
ϭ 0.0025.
The water temperature equals 10ЊC. Check the result by using the
hydraulic tables in Appendix 4.
Answer:
Q
max
ϭ 429.8 m
3
/h
From the tables for k ϭ 0.5 mm, Q ϭ 384.9 m
3
/h if S ϭ 0.002 and
473.2 m
3
/h for S ϭ 0.003. By linear interpolation: Q
max
ϭ 429.1 m
3
/h.
PROBLEM A1.2.5
Determine the maximum capacity of a pipe where D ϭ 200 mm at the
maximum-allowed hydraulic gradient S
max
ϭ 0.005:
a if k ϭ 0.01 mm,
b if k ϭ 1 mm.
The water temperature equals 10ЊC.
Answers:
a Q
max
ϭ 123.1 m
3
/h
b Q
max
ϭ 89.8 m
3
/h
PROBLEM A1.2.6
Determine the maximum capacity of a pipe where D ϭ 1200 mm and
k ϭ 0.05 mm at the maximum-allowed hydraulic gradient:
a S
max
ϭ 0.001,
b S
max
ϭ 0.005.
© 2006 Taylor & Francis Group, London, UK
The water temperature equals 10ЊC.
Answers:
a Q
max
ϭ 5669 m
3
/h
b Q
max
ϭ 13,178 m
3
/h
PROBLEM A1.2.7
Determine the maximum capacity of a pipe where D ϭ 100 mm and
k ϭ 0.4 mm at the maximum-allowed hydraulic gradient S
max
ϭ 0.01.
Use the Moody diagram. The water temperature equals 10Њ C.
Answer:
Q
max
ϭ 22.6 m
3
/h
PROBLEM A1.2.8
Determine the pipe diameter that can transport flow Q ϭ 720 m
3
/h at the
maximum-allowed hydraulic gradient S
max
ϭ 0.002. The pipe roughness
k ϭ 0.05 mm. Assume the water temperature to be 12ЊC. Check the
result by using the hydraulic tables in Appendix 4.
Answer:
D ϭ 477 mm; the first higher manufactured diameter D ϭ 500 mm
delivers 820.0 m
3
/h.
From the tables for k ϭ 0.05 mm and S ϭ 0.002, Q ϭ 818.2 m
3
/h for
D ϭ 500 mm.
PROBLEM A1.2.9
A pipe, L ϭ 450 m, D ϭ 300 mm and k ϭ 0.3 mm, conveys flow
Q ϭ 100 l/s. An increase in flow to 300 l/s is planned. Determine:
a the diameter of the pipe laid in parallel to the existing pipe,
b the pipe diameter if, instead of laying a second pipe, the existing pipe
is replaced by a larger one,
c the pipe diameter if the existing pipe is replaced by two equal pipes.
For all new pipes, k ϭ 0.01 mm. Assume the water temperature to be 10ЊC.
Note:
The present hydraulic gradient has to be maintained in all three options.
Answers:
For S ϭ 0.007
a Q
2
ϭ 200 l/s; D
2
ϭ 363 mm (adopted D ϭ 400 mm)
b Q ϭ 300 l/s; D ϭ 423 mm (adopted D ϭ 500 mm)
c Q
1
ϭ Q
2
ϭ 150 l/s; D
1
ϭ D
2
ϭ 326 mm (adopted D ϭ 350 mm)
PROBLEM A1.2.10
Find the equivalent diameters of two pipes connected in parallel, where
L ϭ 850 m and k ϭ 0.05 mm, in the following cases:
a D
1
ϭ D
2
ϭ 200 mm; Q
1
ϭ Q
2
ϭ 20 l/s,
282 Introduction to Urban Water Distribution
© 2006 Taylor & Francis Group, London, UK
Workshop Problems 283
b D
1
ϭ D
2
ϭ 400 mm; Q
1
ϭ Q
2
ϭ 100 l/s,
c D
1
ϭ D
2
ϭ 800 mm; Q
1
ϭ Q
2
ϭ 800 l/s.
The water temperature equals 10ЊC.
Answer:
For Q ϭ Q
1
ϩQ
2
a S ϭ 0.0020; D ϭ 259 mm (adopted D ϭ 300 mm)
b S ϭ 0.0013; D ϭ 520 mm (adopted D ϭ 600 mm)
c S ϭ 0.0021; D ϭ 1042 mm (adopted D ϭ 1100 mm)
PROBLEM A1.2.11
Find the equivalent diameters of two pipes connected in series, where
L
1
ϭ 460 m, L
2
ϭ 240 m, in the following cases:
a D
1
ϭ 400 mm, D
2
ϭ 200 mm; Q ϭ 80 l/s,
b D
1
ϭ 200 mm, D
2
ϭ 400 mm; Q ϭ 80 l/s,
c D
1
ϭ 600 mm, D
2
ϭ 300 mm; Q ϭ 400 l/s.
Assume for all pipes that k ϭ 0.01 mm and the water temperature
is 10ЊC.
Answer:
For L ϭ 700 m
a S ϭ 0.0087; D ϭ 246 mm (adopted D ϭ 250 mm)
b S ϭ 0.0159; D ϭ 217 mm (adopted D ϭ 250 mm)
c S ϭ 0.0239; D ϭ 368 mm (adopted D ϭ 400 mm)
A1.3 BRANCHED SYSTEMS
PROBLEM A1.3.1
For the branched system shown in Figure A1.1, calculate the pipe flows
and nodal pressures for a surface level (msl) in the reservoir that can
maintain a minimum network pressure of 20 mwc. Assume for all pipes
that k ϭ 1 mm and the water temperature is 10ЊC.
Node 1 2 3 45678910
Z (msl) — 18.2 26.5 16.2 13.6 16.3 14.8 13.1 11.3 12.8
Q (l/s) Ϫ79.0 4.5 12.4 11.4 9.9 5.2 11.1 3.3 10.4 10.8
Answer:
The surface elevation of 52.5 msl at node 1 results in the pressures as
shown in Figure A1.2. The minimum pressure appears to be in node 3
(20.3 mwc).
© 2006 Taylor & Francis Group, London, UK
284 Introduction to Urban Water Distribution
PROBLEM A1.3.2
The minimum pressure criterion for the branched system shown in
Figure A1.3 is 25 mwc. Determine the surface level of the reservoir
in node 1 that can supply a flow of 50 l/s. What will be the water level in
the second tank in this scenario? Calculate the pressures and flows in the
system. Assume for all pipes that k ϭ 0.5 mm and the water temperature
is 10Њ C.
?
1
Nodes: ID
Pipes: L (m)/D (mm)
425/300
350/200
400/150
475/150
62
0
/2
5
0
430/150
450/200
3
30/1
5
0
10
9
6
5
4
3
2
8
7
265/100
Figure A1.1. Network
layout – Problem A1.3.1.
52.5
Nodes: p (mwc)
Pipes: Q (l/s)
79.0
33.7
11.4
9.9
40
.8
14.4
21.
2
1
0.8
31.6
34.5
31.2
31.5
28.7
20.3
31.8
30.1
29.3
3.
3
Figure A1.2. Pipe flows
and nodal pressures –
Problem A1.3.1.
© 2006 Taylor & Francis Group, London, UK
Workshop Problems 285
Node 1 2345 678910
Z (msl) — 18.2 26.5 16.2 — 16.3 14.8 13.1 11.3 12.8
Q (l/s) Ϫ50.0 7.6 16.4 9.2 Ϫ34.9 15.2 11.1 9.3 8.3 7.8
Answer:
See Figure A1.4.
PROBLEM A1.3.3
For the same system as in Problem A1.3.2 and the same surface levels in
the reservoirs as shown in Figure A1.4, determine the pressures and
Nodes: ID
Pipes: L (m)/D (mm)
?
1
425/250
350/200
400/150
475/250
620/250
430/200
450/200
330/150
10
9
6
4
3
2
8
7
265/150
?
5
Figure A1.3. Network layout –
Problem A1.3.2.
52.8
53.6
Nodes: p (mwc)
Pipes: Q (l/s)
50.2
9.1
9.2
34.7
51.7
20.4
16.1
7.8
33.7
35.8
31.6
34.3
25.1
33.2
32.9
32.0
9.3
Figure A1.4. Pipe flows
and nodal pressures –
Problem A1.3.2.
© 2006 Taylor & Francis Group, London, UK
286 Introduction to Urban Water Distribution
flows if the demand in node 8 has increased for 10 l/s and in node 10
for 20 l/s.
Answer:
See Figure A1.5.
Due to the increase in demand, the minimum pressure point has
moved from node 3 to node 10.
PROBLEM A1.3.4
Determine the pipe diameters for the layout shown in Figure A1.6, if
the maximum-allowed hydraulic gradient S
max
ϭ 0.005. Determine the
52.8
53.6
Nodes: p (mwc)
Pipes: Q (l/s)
68.1
21.2
9.2
46.8
81.7
30.4
36.1
27.8
16.6
25.9
24.8
33.4
24.1
31.4
22.3
23.6
19.3
Figure A1.5. Pipe flows
and nodal pressures –
Problem A1.3.3.
?
1
Nodes: ID
Pipes: L (m)
700
380
800
420
470
450
300
330
7
8
6
5
4
3
2
10
9
265
Figure A1.6. Network
layout – Problem A1.3.4.
© 2006 Taylor & Francis Group, London, UK
Workshop Problems 287
surface level of the reservoir at the supply point, which can maintain a
minimum pressure of 20 mwc. Assume for all pipes that k ϭ 0.05 mm
and the water temperature is 10ЊC.
Node 12345 678910
Z (msl) 17.6 18.2 16.0 21.4 — 18.0 16.5 19.0 20.4 22.7
Q (l/s) 5.0 7.6 9.9 3.5 Ϫ58.1 3.8 4.4 10.5 9.2 4.2
Answer:
See Figure A1.7.
Nodes: p (mwc)
Pipes: D (mm)/Q (l/s)
100/5.0
250/44.7
100/3.5
300/58.1
200/18.7
100/3.8
100/4.4
25.2
24.0
23.9
23.7
30.1
26.8
24.1
20.1
23.3
100/4.2
250/32.1
47.0
Figure A1.7. Pipe diameters/
flows and nodal pressures –
Problem A1.3.4.
Nodes: p (mwc)
Pipes: D (mm)/Q (l/s)
100/5.0
250/64.7
100/3.5
300/78.1
200/38.7
100/13.8
100/14.4
9.4
9.6
18.0
23.0
29.4
25.0
22.3
16.4
19.6
100/4.2
250/52.1
47.0
Figure A1.8. Pipe diameters/
flows and nodal pressures –
Problem A1.3.5.
© 2006 Taylor & Francis Group, London, UK
288 Introduction to Urban Water Distribution
PROBLEM A1.3.5
For the same system as in Problem A1.3.4 and the same surface level in
the reservoir as shown in Figure A1.7, determine the pressures and flows
if the demand in nodes 6 and 7 has increased for 10 l/s. Change the
pipe diameters where necessary in order to meet the design criteria
(S
max
and p
min
).
Answer:
By increasing the demand in nodes 6 and 7 to 13.8 and 14.4 l/s respec-
tively, the pressures in the network will be as shown in Figure A1.8.
Nodes 6 to 10 have pressure below 20 mwc. To satisfy the design
pressure and hydraulic gradient, pipes 3-2, 2-9, 9-10, 9-8, 8-6 and 8-7
have to be enlarged (see Figure A1.9).
A1.4 LOOPED SYSTEMS
PROBLEM A1.4.1
For the same system as in Problem A1.3.3 and the same surface levels in
the reservoirs as shown in Figure A1.5, determine the pressures and
flows if nodes 3 and 9 are connected with a pipe, where L ϭ 780 m,
D ϭ 200 mm and k ϭ 0.05 mm.
Note:
Remove the branches and add their demand to the nodes of the loop 2-3-
9-6. A ‘dummy’ loop, 1-2-3-5, should be formed to determine the flows
from the tanks. Fixed ⌬H
1Ϫ5
ϭ 53.6Ϫ52.8 ϭ 0.8 mwc is kept while
balancing the heads throughout the calculation (see Figure A1.10).
Nodes: p (mwc)
Pipes: D (mm)/Q (l/s)
100/5.0
300/64.7
100/3.5
300/78.1
250/38.7
200/13.8
200/14.4
25.3
23.9
23.2
23.0
29.4
26.3
23.6
20.4
22.8
150/4.2
250/52.1
47.0
Figure A1.9. Pipe diameters/
flows and nodal pressures –
Problem A1.3.5.
© 2006 Taylor & Francis Group, London, UK
Workshop Problems 289
Answer:
See Figure A1.11.
PROBLEM A1.4.2
For the same system as in Problem A1.3.5 and keeping the layout as
shown in Figure A1.8, determine the pressures and flows if nodes 2 and 8
and 3 and 6 are connected with pipes with respective lengths of 680 and
470 m. For both pipes D ϭ 150 mm and k ϭ 0.05 mm.
Answer:
See Figure A1.12.
As the figure shows, pressures in the network will improve by
creating loops.
Nodes: Q (l/s)
53.6
1
7.6
DH
1-5
=0.8m
25.6
45.6
36.1
9
6
3
2
52.8
5
Figure A1.10. Network layout
and nodal demands –
Problem A1.4.1.
Nodes: p (mwc)
Pipes: Q (l/s)
62.7
4.0
5.5
9.2
30.6
27.8
51.1
52.2
30.4
35.4
30.5
26.2
32.8
23.6
32.0
28.0
29.3
19.3
52.8
53.6
Figure A1.11. Pipe flows
and nodal pressures –
Problem A1.4.1.
© 2006 Taylor & Francis Group, London, UK
290 Introduction to Urban Water Distribution
PROBLEM A1.4.3
For the layout shown in Figure A1.12, analyse the pressure in the system:
a after the failure of pipe 9-8,
b after the failure of pipe 2-3.
What is the deficit of pressure to be provided at the supply point, in both
cases?
Answers:
a There is no pressure deficit in the system caused by the failure of pipe
9-8 (Figure A1.13).
b In this case, Figure A1.14 shows a severe drop of pressure in the
system. The observed deficit is 37.3 mwc (for p
min
ϭ 20 mwc).
Nodes: p (mwc)
Pipes: Q (l/s)
5.0
52.8
33.1
3.5
7.2
14.4
11.9
78.1
19.7
1.9
25.9
24.9
23.0
23.9
29.4
26.6
21.4
27.1
23.8
4.2
47.0
Figure A1.12. Pipe flows
and nodal pressures –
Problem A1.4.2.
Nodes: p (mwc)
Pipes: Q (l/s)
5.0
43.6
13.4
3.5
17.6
14.4
21.6
78.1
7.8
22.9
21.8
23.0
24.1
29.4
26.8
22.0
24.0
24.5
4.2
47.0
Figure A1.13. Pipe flows
and nodal pressures –
Problem A1.4.3a.
© 2006 Taylor & Francis Group, London, UK
Workshop Problems 291
A1.5 HYDRAULICS OF STORAGE AND PUMPS
PROBLEM A1.5.1
For the gravity system shown in Figure A1.15, find the maximum
capacity of the transport pipe, when L ϭ 3000 m, D ϭ 800 mm and
k ϭ 0.5 mm, which can be delivered with a pressure of 35 mwc at the
entrance of the city. Assume the water temperature to be 10ЊC.
Answer:
Q
max
ϭ 3782 m
3
/h
PROBLEM A1.5.2
For the same system as in Problem A1.5.1, a pumping station is built
next to the reservoir, as shown in Figure A1.16. The pump characteristics
valid during the operation of all pumps is shown in Figure A1.17.
Nodes: p (mwc)
Pipes: Q (l/s)
5.0
8.0
3.5
4.6
14.4
64.7
78.1
50.9
-8.7
-13.1
23.0
-15.4
29.4
-12.7
-17.3
-10.9
-14.8
4.2
47.0
21.4
Figure A1.14. Pipe flows
and nodal pressures –
Problem A1.4.3b.
65.0
15.0
L,D,k
Figure A1.15. Distribution
shceme – Problem A1.5.1.
© 2006 Taylor & Francis Group, London, UK
292 Introduction to Urban Water Distribution
Determine:
a the maximum flow of the transport system that can be delivered to the
city with the same pressure as in Problem A1.5.1,
b the pressure at the entrance of the city if the pumping station delivers
the same flow as in Problem A1.5.1.
Answers:
a From the graph in Figure A1.18, the pump delivers a maximum capa-
city of Ϯ5630 m
3
/h. The pumping head of Ϯ18 mwc is used in this
case to cover the friction loss increase.
b From the graph in Figure A1.19, the pump delivers a head of
Ϯ29 mwc. As the entire friction loss is covered by gravity, the pump-
ing head will be utilised to deliver the pressure at the entrance of the
city. Thus, p
entr
ϭ 35ϩ29 ϭ 64 mwc.
The hydraulic grade lines for both modes of operation are shown in
Figure A1.20.
65.0
15.0
L,D,K
Figure A1.16. Distribution
shceme – Problem A1.5.2.
Q (m
3
/h)
0
5
10
15
20
25
30
35
40
H
p
(mwc)
0 1000 2000 3000 4000 5000 6000
All pumps 'ON'
Pump characteristics
Figure A1.17. Pumping station
Q/H curve – Problem A1.5.2.
© 2006 Taylor & Francis Group, London, UK
Workshop Problems 293
Q (m
3
/h)
-20
-10
0
10
20
Q
gravity
30
40
H
p
(mwc)
0 1000 2000 3000 4000 5000 6000
All pumps 'ON'
Pipe char
acteristics
Pump
Gravity
Additional pressure
from pumping
Figure A1.19. Pumping station
operation – Problem A1.5.2b.
65.0
94.0
79.0
50.0
83.0
15.0
Q
pump
=3780 m
3
/h
Q
pump
=5630 m
3
/h
Q
gravity
=3780 m
3
/h
Figure A1.20. Hydraulic grade
lines – Problem A1.5.2.
Q (m
3
/h)
-20
-10
0
10
20
Pump
Gravity
Pipe characteristics
Q
max
Q
gravity
Additional flow
from pumping
30
40
H
p
(mwc)
0 1000 2000 3000 4000 5000 6000
All pumps 'ON'
Figure A1.18. Pumping station
operation – Problem A1.5.2a.
© 2006 Taylor & Francis Group, London, UK
294 Introduction to Urban Water Distribution
PROBLEM A1.5.3
For the combined system shown in Figure A1.21, find the maximum
capacity and corresponding pressure at the entrance of the city. Avoid
negative pressures along the route. The pipes are:
A–B: L ϭ 2000 m, D ϭ 600 mm, k ϭ 1.0 mm,
B–C: L ϭ 1200 m, D ϭ 700 mm, k ϭ 0.1 mm.
The pumping station operates according to the curve in Figure A1.17.
The water temperature may be assumed to be10ЊC.
Note:
The theoretical maximum flow, without negative pressures, is reached
for ⌬H
AϪB
ϭ 50 Ϫ 25 ϭ 25 mwc.
Answer:
Q
max
ϭ 2596 m
3
/h. The pumping head for this flow is Ϯ34 mwc.
Consequently, the calculated ⌬H
B–C
ϭ 4.3 mwc leads to a p
C
of 19.7 mwc.
PROBLEM A1.5.4
For the system shown in Figure A1.22, determine the pressure at the
entrance of the city for a flow of 800 m
3
/h. The pipes are as follows:
A–B: L ϭ 1500 m, D ϭ 500 mm, k ϭ 0.5 mm,
B–C: L ϭ 1200 m, D ϭ 400 mm, k ϭ 0.1 mm.
50.0
A
B
C
35.0
25.0
Figure A1.21. Distribution
scheme – Problem A1.5.3.
50.0
A
B
C
90.0
75.0
Figure A1.22. Distribution
scheme – Problem A1.5.4.
© 2006 Taylor & Francis Group, London, UK
Workshop Problems 295
Both pumping stations in A and B operate according to the curve
shown in Figure A1.23. The water temperature may be assumed to
be 10Њ C.
Answer:
For Q ϭ 800 m
3
/h, the total pumping head H
p
ϭ 70.4 mwc. ⌬H
A–B
ϩ
⌬H
B–C
ϭ 4.0 ϩ 7.6 ϭ 11.6 mwc. Thus, p
C
ϭ 18.8 mwc.
PROBLEM A1.5.5
For the system shown in Figure A1.24, determine the maximum flow that
can be pumped from reservoir A to reservoir B. If the same capacity has
to be transported by gravity, find the pressure at the entrance of the city.
The pipes are as follows:
A–B: L ϭ 1350 m, D ϭ 450 mm, k ϭ 0.1 mm,
B–C: L ϭ 1800 m, D ϭ 500 mm, k ϭ 0.1 mm.
The pumping station operates according to the curve shown in
Figure A1.23. The water temperature may be assumed to be 10Њ C.
Answer:
The maximum pumping capacity Q ϭ 805 m
3
/h (see Figure A1.25). This
flow is delivered by gravity when pressure p
C
ϭ 21.2 mwc.
Q (m
3
/h)
0
10
20
30
40
50
60
70
H
p
(mwc)
0 200 400 600 800 1000 1200
All pumps 'ON'
Figure A1.23. Pumping station
Q/H curve – Problem A1.5.2.
45.0
A
B
C
75.0
50.0
Figure A1.24. Distribution
scheme – Problem A1.5.5.
© 2006 Taylor & Francis Group, London, UK
296 Introduction to Urban Water Distribution
PROBLEM A1.5.6
Pumping station B in Figure A1.26 supplies distribution area C from
reservoir A through a pipe, where L ϭ 1000 m, D ϭ 600 mm, k ϭ 1 mm.
The pump characteristics of one pump unit are shown in Figure A1.27.
The water temperature may be assumed to be 10ЊC.
Q (m
3
/h)
Q
max
0
10
20
30
40
50
60
70
H
p
(mwc)
0 200 400 600 800 1000 1200
All pumps 'ON'
Pipe characteristics A-B
Figure A1.25. Pump operation
at section A–B Problem A1.5.5.
32.0
A
B
C
44.0
Figure A1.26. Distribution
scheme – Problem A1.5.6.
Q (m
3
/h)
0
10
20
30
40
50
60
70
H
p
(mwc)
0 200 400 600 800 1000 1200
One pump
Figure A1.27. Pump
characteristics – Problem
A1.5.6.
© 2006 Taylor & Francis Group, London, UK
Workshop Problems 297
The demand of the distribution area registered on the maximum
consumption day was 28,008 m
3
. The demand variation pattern during
24 hours is given in the following table:
Hour 123456789101112
pf
h
0.28 0.30 0.33 0.51 1.07 1.32 1.31 1.38 1.40 1.39 1.36 1.22
Hour 13 14 15 16 17 18 19 20 21 22 23 24
pf
h
1.07 1.04 1.12 1.18 1.29 1.37 1.30 1.33 1.06 0.60 0.44 0.33
Determine:
a the balancing volume of the reservoir assuming a constant (average)
inflow over 24 hours,
b the required number of pumps arranged in parallel, which can pro-
vide the minimum-required pressure at the entrance of the city, i.e.
p
min
ϭ 30 mwc, during the maximum consumption hour,
c the same as in ‘b’ but for the minimum consumption hour instead,
d the excessive pumping energy during the maximum and minimum
consumption hours; the overall efficiency of the pumping station
pst
ϭ 0.65.
Answers:
a Q
avg
ϭ 1167 m
3
/h, V
bal
ϭ 4.21Q
avg
ϭ 4913 m
3
.
b The maximum demand occurs at 9 a.m., when Q
9
ϭ 1.40 ϫ
1167 ϭ 1634 m
3
/h. For this flow, ⌬H
9
ϭ 4.97 ≈ 5 mwc. The head
required by one pump, H
p,9
ϭ 12ϩ5ϩ30 ϭ 47 mwc, is reached for a
flow of Ϯ 580 m
3
/h. Thus, three pumps are necessary.
c The minimum consumption occurs at 1 a.m., when Q
1
ϭ 0.28 ϫ
1167 ϭ 327 m
3
/h. ⌬H
1
ϭ 0.2 mwc, H
p,1
ϭ 12ϩ0.2ϩ30 ϭ 42.2 mwc,
for Q
p,1
ϭϮ680 m
3
/h. Hence, one pump is sufficient.
d The actual pumping head during the maximum consumption hour
is Ϯ48.5 mwc (for the flow 1634/3 ϭ 544.7 m
3
/h). The excessive
head is 1.5 mwc and the wasted energy E
w
ϭ 3.43 kWh per
single unit. Hence, for three units E
w
ϭ 10.28 kWh. During the
minimum supply conditions, a flow of 327 m
3
/h will be pumped
against a head of Ϯ56 mwc. Thus, the excessive head is 13.8 mwc
and the wasted energy E
w
ϭ 18.92 kWh when there is one unit in
operation.
PROBLEM A1.5.7
Pumping station B in Figure A1.28 supplies the distribution area
C from reservoir A through a pipe L ϭ 1100 m, D ϭ 250 mm,
k ϭ 0.05 mm. The pump characteristics of one pump unit is shown in
Figure A1.29. The minimum-required pressure at the entrance of the city
is 25 mwc. The water temperature may be assumed to be 10Њ C.
© 2006 Taylor & Francis Group, London, UK
298 Introduction to Urban Water Distribution
Determine:
a the maximum flow that can be supplied when one pump is in
operation,
b the maximum flow that can be supplied if two parallel pumps are in
operation,
c the maximum flow that can be supplied in cases ‘a and b’, if another
pipe with D ϭ 250 mm is laid in parallel.
Answers:
a Q
max
ϭ 260 m
3
/h (see Figure A1.30).
b Q
max
ϭ 410 m
3
/h (see Figure A1.31).
c By laying the second pipe where D ϭ 250 mm, each pipe will trans-
port half of the initial flow, which reduces the friction losses. The
composite system characteristics is shown in Figure A1.32. From
the graph: Q
max,1
ϭ 280 m
3
/h for one pump in operation, and Q
max,2
ϭ
520 m
3
/h, for two pumps.
PROBLEM A1.5.8
Distribution area C in Figure A1.33 is supplied by gravity through a pipe
where L ϭ 750 m, D ϭ 500 mm, k ϭ 0.5 mm. The volume of reservoir
31.0
A
B
C
38.0
Figure A1.28. Distribution
scheme – Problem A1.5.7.
Q (m
3
/h)
0
10
20
30
40
50
60
70
H
p
(mwc)
0 50 100 150 200 250 300 350 400
One pump
Figure A1.29. Pump
characteristics – Problem
A1.5.7.
© 2006 Taylor & Francis Group, London, UK
Workshop Problems 299
B is recovered by pumping A from a well field. The water temperature
T ϭ 10Њ C.
The demand of the distribution area that was registered on the
maximum consumption day was 30,480 m
3
. The demand variation
Q (m
3
/h)
Q
max
0
10
20
30
40
50
60
70
80
H
p
(mwc)
0 100 200 300 400 500 600
Two pumps 'ON'
One pipe
Figure A1.31. Pump operation,
two pumps and one pipe –
Problem A1.5.7b.
Q (m
3
/h)
Q
max,1
0
10
20
30
40
50
60
70
H
p
(mwc)
0 100 200 300 400 500 60
0
Q
max,2
Two pipes
Two pumps
One pump
Figure A1.32. Pump operation,
two pumps and parallel pipes–
Problem A1.5.7c.
Q (m
3
/h)
Q
max
0
10
20
30
40
50
60
70
80
H
p
(mwc)
0 100 200 300 400 500 600
One pump 'ON'
One pipe
Figure A1.30. Pump operation,
one pump – Problem A1.5.7a.
© 2006 Taylor & Francis Group, London, UK
300 Introduction to Urban Water Distribution
pattern during 24 hours is given in the following table:
Hour 123456789101112
pf
h
0.71 0.75 0.77 0.79 0.96 1.14 1.15 1.18 1.20 1.19 1.17 1.07
Hour 13 14 15 16 17 18 19 20 21 22 23 24
pf
h
0.96 0.94 1.00 1.04 1.12 1.17 1.16 1.14 0.96 0.87 0.79 0.76
Determine:
a the balancing volume of the reservoir, assuming constant (average)
pumping over 24 hours,
b the 24-hour water level variation in the tank, assuming the tank has a
cross-section area of 1000 m
2
and provision for all other purposes of
60% of the total volume,
c the range of pressures that appear over 24 hours at the entrance of the
town.
Answers:
a Q
avg
ϭ 1270 m
3
/h, V
bal
ϭ 1.64Q
avg
ϭ 2085 m
3
b The total volume V
tot
ϭ 5215 m
3
. The available tank depth is 5.22 m.
Hour pf
out
pf
in
pf
in
Ϫpf
out
3 Depth (m)
1 0.71 1 0.29 0.29 4.29
2 0.75 1 0.25 0.54 4.61
3 0.77 1 0.23 0.77 4.90
4 0.79 1 0.21 0.99 5.17
5 0.96 1 0.04 1.02 5.22
6 1.14 1 Ϫ0.14 0.88 5.04
7 1.15 1 Ϫ0.15 0.73 4.85
8 1.18 1 Ϫ0.18 0.55 4.62
9 1.20 1 Ϫ0.20 0.36 4.37
10 1.19 1 Ϫ0.19 0.17 4.13
11 1.17 1 Ϫ0.17 0.00 3.92
?
A
From
well field
B
C
28.0
76.0
Figure A1.33. Distribution
scheme – Problem A1.5.8.
© 2006 Taylor & Francis Group, London, UK
Workshop Problems 301
12 1.07 1 Ϫ0.07 Ϫ0.07 3.83
13 0.96 1 0.04 Ϫ0.04 3.87
14 0.94 1 0.06 0.02 3.94
15 1.00 1 0.00 0.02 3.94
16 1.04 1 Ϫ0.04 Ϫ0.02 3.89
17 1.12 1 Ϫ0.12 Ϫ0.14 3.74
18 1.17 1 Ϫ0.17 Ϫ0.32 3.52
19 1.16 1 Ϫ0.16 Ϫ0.48 3.31
20 1.14 1 Ϫ0.14 Ϫ0.62 3.13
21 0.9 1 0.04 Ϫ0.58 3.18
22 0.87 1 0.13 Ϫ0.46 3.34
23 0.79 1 0.21 Ϫ0.24 3.61
24 0.76 1 0.24 0.00 3.92
At midnight, V
0
ϭ 0.6V
tot
ϩ 0.62Q
avg
ϭ 3917 m
3
that corresponds to the
depth of 3.92 m (see Figure A1.34).
c The maximum demand occurs at 9 a.m., where Q
9
ϭ 1524 m
3
/h.
For this flow, ⌬H
9
ϭ 7.14 mwc and the remaining pressure in C,
p
C,9
ϭ 76 ϩ 4.37 Ϫ 7.14 Ϫ 28 ≈ 45 mwc. For the minimum at 1 a.m.,
Q
1
ϭ 902 m
3
/h. ⌬H
1
ϭ 2.54 mwc and p
C,1
≈ 50 mwc.
PROBLEM A1.5.9
For the same problem as in A1.5.8 determine the balancing volume of
the reservoir assuming constant pumping of twice the average flow
during 12 hours:
a between 8 p.m. and 8 a.m.,
b from 9 a.m. to 3 p.m. and from 11 p.m. until 5 a.m.
Answers:
a V
bal
ϭ 13.21Q
avg
ϭ 16780 m
3
b V
bal
ϭ 8.47Q
avg
ϭ 10760 m
3
.
T (hours)
3 0.6
0.8
1.0
1.2
3.5
4
4.5
5
5.5
H (m)
pf
4 8 12 16 20 24
Reservoir B
Depth
Demand
Figure A1.34. Water variation
vs. demand pattern – Problem
A1.5.8.
© 2006 Taylor & Francis Group, London, UK