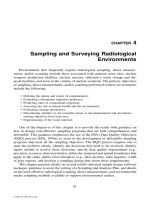
SAMPLING AND SURVEYING RADIOLOGICAL ENVIRONMENTS - CHAPTER 8 docx
Bạn đang xem bản rút gọn của tài liệu. Xem và tải ngay bản đầy đủ của tài liệu tại đây (117.68 KB, 7 trang )
303
CHAPTER
8
Data Quality Assessment
The term data quality assessment (DQA) refers to the five-step EPA process
(EPA, 1998) that provides a comparison of the implemented sampling approach and
resulting analytical data against the sampling, data quality, and error tolerance
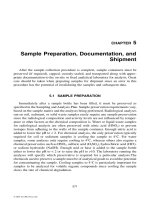
requirements specified by the DQOs (Section 4.1.1). Figure 8.1 identifies each of
the five steps that make up the DQA process. The results from the DQA are used
to determine whether or not the null hypothesis (site is assumed to be contaminated
until shown to be clean) can be rejected so that the site or facility can be considered
“clean” (having met the remedial action goals). Note that rejecting the null hypoth-
esis provides evidence (not proof) that the site meets the remedial action goals.
The DQA process is designed to evaluate statistically based sample designs
(simple random, stratified random, systematic, sequential, etc.). DQA Steps 1 and
2 should be implemented by an analytical chemist (radiochemist), while DQA
Steps 3 through 5 should be implemented by a statistician.
Figure 8.1 Five steps that comprise the DQA process.
© 2001 by CRC Press LLC
304 SAMPLING AND SURVEYING RADIOLOGICAL ENVIRONMENTS
8.1 DQA STEP 1: REVIEW DQOs AND SAMPLING DESIGN
Step 1 of the DQA process identifies any discrepancies that exist between the
sampling and analytical requirements specified in the DQO and sampling and analy-
sis plan and what was actually performed in the field. The DQA checklist presented
in Table 8.1 should be used to assist in performing this evaluation.
This step requires the implementation of the following activities:
• Obtain a copy of the DQA checklist (Table 8.1), project DQO summary report,
sampling and analysis plan, data verification/validation packages, maps showing
final sampling locations, and any design change notices.
• Review the project DQO summary report and sampling and analysis plan to become
familiar with the project data requirements that must be compared with the col-
lected analytical data set.
• Review the data verification/validation packages, maps showing final sampling
locations, and design change notices with the intent of identifying any discrepancies
that exist between the sampling and analytical requirements specified in the sam-
pling and analysis plan and what was actually performed.
• Complete the DQA checklist presented in Figure 8.1.
8.2 DQA STEP 2: CONDUCT PRELIMINARY DATA REVIEW
This step requires review of the analytical data set, as well as any related quality
assurance/quality control reports that are relevant to the project.
As part of this step, the following activities should be performed:
• Review the data verification/validation package and available quality control
reports, laboratory audit reports, and any other relevant quality assurance reports
that describe the data collection and reporting process as it was actually imple-
mented. Remove all invalid data from the data set. Clearly document the rationale
for removing any data from the data set.
• Calculate basic statistical quantities (i.e., summary statistics) from the data set.
Examples of statistical quantities include mean, median, percentile, range, standard
deviation, and coefficient of variation. Use a spreadsheet to present the results.
• Graph the analytical data to identify distribution patterns and trends and to identify
potential problems with the data set. Graphical representations that should be
considered include frequency plots, histograms, ranked data plots, normal proba-
bility plots, scatter plots, and time plots.
8.3 DQA STEP 3: SELECT THE STATISTICAL HYPOTHESIS TEST
This step requires the selection of the most appropriate statistical hypothesis
test for drawing conclusions from the data set. All statistical hypothesis tests make
assumptions about the data set. Parametric tests (e.g., one sample t-test) assume
that the data have some distributional form (e.g., normal, lognormal), whereas
© 2001 by CRC Press LLC
DATA QUALITY ASSESSMENT 305
Table 8.1 DQA Checklist
Completed
Task Yes No Name Date Explanation
DQO Workbook
1. Reviewed the project-specific
DQO workbook
1a. Reviewed decision
statements
1b. Reviewed decision rules
1c. Reviewed the null hypothesis
1d. Reviewed the gray region and
tolerable limits on decision
error
1e. Reviewed the sampling
design rationale
Sampling and Analysis Plan
2. Reviewed the project-specific
sampling and analysis plan
2a. Reviewed maps showing
proposed sampling locations
2b. Reviewed analytical method,
detection limit, and precision
and accuracy requirements
2c. Reviewed field and laboratory
quality control sampling
requirements (i.e., duplicates,
rinsate blanks, matrix spikes)
2d. Reviewed sample bottle and
preservation requirements
2e. Reviewed field and laboratory
quality assurance
requirements
Maps Showing Actual Sampling Locations
3. Reviewed project-specific
maps showing actual
sampling locations, and
compare against the
requirements specified in the
DQA report and sampling and
analysis plan
Other
4a. Laboratory analytical reports
4b. Field screening data
4c. Field logbooks
4d. Chain-of-custody forms
4e. Maps showing final sampling
locations
4f. Design Change Notices
© 2001 by CRC Press LLC
306 SAMPLING AND SURVEYING RADIOLOGICAL ENVIRONMENTS
nonparametric tests (e.g., Wilcoxon Signed Rank Test) make no distributional
assumptions. Table 8.2 presents some of the more common statistical hypothesis
tests that are recommended by EPA (1998). The statistical hypothesis tests about
a single population are designed for a comparison against a fixed threshold (e.g.,
a regulatory cleanup guideline), while the statistical hypothesis tests about two
populations are designed for comparison between two populations (e.g., investiga-
tion site and background).
When selecting a statistical hypothesis test, it is important to consider the sen-
sitivity of each test to departures from the assumptions. When small sample popu-
lations (i.e., fewer than ten samples) are being assessed, it is recommended that a
nonparametric statistical hypothesis test be selected to draw conclusions from the
data. This selection will avoid incorrectly assuming that the data are normally
distributed when there is simply not enough information to test this assumption. In
all cases, the rationale for the selected statistical hypothesis test should be clearly
documented.
This step requires the implementation of the following activities:
• Review the statistical quantities and graphical data plots generated in DQA Step 2.
• Select the appropriate statistical hypothesis test and document all of the assump-
tions made about the data set to justify the selection.
• Note any sensitive assumptions where relatively small deviations could jeopardize
the validity of the test results.
Table 8.2 List of Statistical Hypothesis Tests for Consideration
Type of Test Test Name
a
Tests of Hypotheses about a Single Population
Test for a mean One-sample t-test (parametric test)
Wilcoxon Signed Rank (one-sample) test for the mean
(nonparametric test)
Tests for a proportion or
percentile
One-sample proportion test
Tests for a median One-Sample proportion test
Wilcoxon Signed Rank (one-sample) test for the median
Tests of Hypotheses between Two Populations
Test for two means Two-sample t-test
Satterthwaite’s two-sample t-test
Test for two proportions/ two
percentiles
Two-sample test for proportions
Nonparametric comparison of
two populations
Wilcoxon Rank Sum Test
Quantile test
a
Refer to EPA (1998) and Gilbert (1987) for formulas and specific details on these statistical
hypothesis tests.
© 2001 by CRC Press LLC
DATA QUALITY ASSESSMENT 307
8.4 DQA STEP 4: VERIFY THE ASSUMPTIONS OF THE STATISTICAL
HYPOTHESIS TEST
This step is performed to assess the validity of the statistical hypothesis test
chosen in DQA Step 3. DQA Step 4 is used to determine whether the data support
the underlying assumptions necessary for the selected test, or whether the data set
must be transformed before further statistical analysis, or whether another statistical
hypothesis test must be chosen. The graphical representations of the data developed
in DQA Step 2 (Section 8.2) should be used to provide important qualitative infor-
mation about the reasonableness of the assumptions. Table 8.3 presents a list of the
statistical analyses that should be considered.
Table 8.3 Statistical Analyses for Verifying Assumptions
Type of Test Name of Test
a
Tests for distributional assumptions Shapiro Wilk W Test
Filliben’s statistic
Coefficient of variation test
Skewness and Kurtosis tests
Geary’s test
Range test
Chi-Square test
Lilliefors Kolmogorov-Smirnoff test
Tests for trends Regression-based methods:
• Estimation of a trend using slope of regression line
• Testing for trends using regression methods
General trend estimation methods:
• Sen’s slope estimator
• Seasonal Kendall slope estimator
Hypothesis tests for detection trends:
• One observation per time period for one sampling
location
• Multiple observations per time period for one
sampling location
• Multiple sampling locations with multiple
observations
• One observation for one station with multiple
seasons
Outliers Extreme value test
Discordance test
Extreme value test (Dixon’s test)
Rosner’s test
Walsh’s test
Multivariate outliers
Test for dispersions Confidence intervals for a single variance
The F-test for the equality of two variances
Bartlett’s test for the equality of two or more
variances
Levene’s test for the equality of two or more
variances
a
Refer to EPA (1998) and Gilbert (1987) for specific details on these statistical analyses.
© 2001 by CRC Press LLC
308 SAMPLING AND SURVEYING RADIOLOGICAL ENVIRONMENTS
If the results from this statistical analysis support the key assumptions of the
statistical hypothesis test, the DQA process continues on to DQA Step 5
(Section 8.5), where conclusions are drawn from the data. However, if one or more
of the assumptions are questioned, then one must return to DQA Step 3 (Section 8.3)
and reevaluate the selection of the most appropriate statistical hypothesis test.
This step requires the implementation of the following activities:
• Review the assumptions about the data set used to justify the statistical hypothesis
test selection.
• Use the graphical representations of the data set developed in DQA Step 2
(Section 8.2) to provide an initial determination of the reasonableness of the
assumptions.
• Perform a statistical analysis of the data set to confirm or reject the assumptions
of the statistical hypothesis test selected in DQA Step 3 (Section 8.3).
• If the results from this assessment support the key assumptions of the statistical
hypothesis test, proceed to DQA Step 5 (Section 8.5); otherwise, return to DQA
Step 3 (Section 8.3) and reevaluate the most appropriate statistical hypothesis test.
8.5 DQA STEP 5: DRAWING CONCLUSIONS FROM DATA
In this step, the selected statistical hypothesis test is performed and conclusions
are drawn from the results. The results from the statistical hypothesis test shall either
(a) reject the null hypothesis (site is assumed to be contaminated until shown to be
clean), or (b) fail to reject the null hypothesis. In case (a), the data have provided
the evidence needed to reject the null hypothesis, so the decision can be made that
the site is now “clean” (having met remedial action goals) with sufficient confidence
and without further analysis. This is acceptable because the statistical hypothesis
test inherently controls the false-positive decision error rate within the data user’s
tolerable limits.
In case (b), the data do not provide sufficient evidence to reject the null hypoth-
esis. Therefore, the data shall be analyzed further to determine whether the data
user’s tolerable limits on false-negative decision errors have been satisfied (see
Figure 8.2).
The overall performance of the sampling shall be evaluated by performing a
statistical power calculation on the statistical hypothesis test over the range of
possible parameter values. The power of a statistical test is defined as the probability
of rejecting the null hypothesis when the null hypothesis is false. A power analysis
helps evaluate the adequacy of the sampling design when the true parameter value
lies near the action level.
This step requires the implementation of the following activities:
• Perform the selected statistical hypothesis test.
• Use the flowchart presented in Figure 8.2 to identify the activities to be performed
based on the results from the statistical hypothesis test.
• Summarize the results from DQA Steps 1 through 5 in the DQA summary report.
© 2001 by CRC Press LLC
DATA QUALITY ASSESSMENT 309
REFERENCES
EPA (Environmental Protection Agency), Guidance Document on the Statistical Analysis of
Groundwater Monitoring Data at RCRA Facilities, EPA/530/R-93/003, U.S. Environ-
mental Protection Agency, Washington, D.C., 1992.
EPA (Environmental Protection Agency), Guidance for the Data Quality Objectives Process,
EPA QA/G-4, U.S. Environmental Protection Agency, Washington, D.C., 1994.
EPA (Environmental Protection Agency), Guidance for Data Quality Assessment—Practical
Methods for Data Analysis, EPA QA/G-9, U.S. Environmental Protection Agency, Wash-
ington, D.C., 1998.
Gilbert, R.O., Statistical Methods for Environmental Pollution Monitoring, Van Nostrand
Reinhold, New York, 1987.
Figure 8.2 Flowchart for DQA Step 5.
© 2001 by CRC Press LLC