Báo cáo sinh học: "Pro-apoptotic activity of a-bisabolol in preclinical models of primary human acute leukemia cells" pptx
Bạn đang xem bản rút gọn của tài liệu. Xem và tải ngay bản đầy đủ của tài liệu tại đây (1.15 MB, 13 trang )
RESEARCH Open Access
Pro-apoptotic activity of a-bisabolol in preclinical
models of primary human acute leukemia cells
Elisabetta Cavalieri
1
, Antonella Rigo
2
, Massimiliano Bonifacio
2
, Alessandra Carcereri de Prati
1
,
Emanuele Guardalben
2
, Christian Bergamini
3
, Romana Fato
3
, Giovanni Pizzolo
2
, Hisanori Suzuki
1
and
Fabrizio Vinante
2*
Abstract
Background: We previously demonstrated that the plant-derived agent a-bisabolol enters cells via lipid rafts, binds
to the pro-apoptotic Bcl-2 family protein BID, and may induce apoptosis. Here we studied the activity of a-
bisabolol in acute leukemia cells.
Methods: We tested ex vivo blasts from 42 acute leukemias (14 Philadelphia-negative and 14 Philadelphia-positive
B acute lymphoid leukemias, Ph
-
/Ph
+
B-ALL; 14 acute myeloid leukemias, AML) for their sensitivity to a-bisabolol in
24-hour dose-response assays. Concentrations and time were chosen based on CD34
+
, CD33
+
my and normal
peripheral blood cell sensitivity to increasing a-bisabolol concentrations for up to 120 hours.
Results: A clustering analysis of the sensitivity over 24 hours identified three clusters. Cluster 1 (14 ± 5 μM a-
bisabolol IC
50
) included mainly Ph
-
B-ALL cells. AML cells were split into cluster 2 and 3 (45 ± 7 and 65 ± 5 μM
IC
50
). Ph
+
B-ALL cells were scattered, but mainly grouped into cluster 2. All leukemias, including 3 imatinib-resistant
cases, were eventually responsive, but a subset of B-ALL cells was fairly sensitive to low a-bisabolol concentrations.
a-bisabolol acted as a pro-apoptotic agent via a direct damage to mitochondrial integrity, which was responsible
for the decrease in NADH-supported state 3 respiration and the disruption of the mitochondrial membrane
potential.
Conclusion: Our study provides the first evidence that a-bisabolol is a pro-apoptotic agent for primary human
acute leukemia cells.
Background
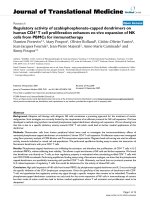
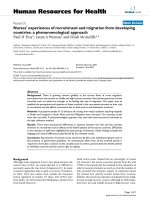
a-bisabolol is a small oily sesquiterpene alcohol (Figure
1A) that has been demons trated to have activity against
some malignant adherent human and rat cell lines [1]
and against spontaneous mammary tumors in HER-2
transgenic mice [2]. We have previously found that it
enters cells via lipid-rafts, interacts directly with BID, a
pro-apoptotic BH3-only Bcl-2 family protein, and
induces apoptosis [3].
Here we test the pro-apoptotic potential of a-bisabolol
against primary acute leukemia cells, including Philadel-
phia-negative and -positive B acute lymphoid leukemias
(Ph
-
/Ph
+
B-ALL) and acute myeloid leukemias (AML),
and against normal blood white cells and hematopoietic
bone marrow stem cells. Leukemic blasts represent a
unique model to study the activity of a-bisabolol due to
their biology allowing easy manipulation and evaluation.
Moreover, acute leukemia treatment in adults is unsatis-
factory despite investigations over the past four decades
of a wide variety of anti-leukemic agents, refinement of
bone marrow transplantation and the development of
specific targeted therapy [4,5]. There is a particular need
for treatments with both high efficacy and low toxicity
[6] based on new molecules with mechanisms of action
different from conventional drugs. This is especially true
for elderly leukemia patients, who represent the majority
of cases and have fewer therapeutic options [7]. Like-
wise, despite the introduction of anti-BCR/ABL tyrosine
kinases for the treatment of Ph
+
leukemias, it seems
that identification of novel compounds is perhaps neces-
sary for success in eradicating Ph
+
cells [8,9].
* Correspondence:
2
Department of Medicine, Section of Hematology, University of Verona, Italy
Full list of author information is available at the end of the article
Cavalieri et al. Journal of Translational Medicine 2011, 9:45
/>© 2011 Cavalieri et al; licensee BioMed Central Ltd. This is an Open Access article distributed unde r the terms of the Creat ive Commons
Attribution License ( /by/2.0), w hich permits unrestricted use, distribution, and reproduction in
any medium, provided the original work is properly cited.
The present study shows that a-bisabolol enters acute
leukemic cells, where it disrupts the mitochondrial
membrane potential and triggers apoptosis. Interestingly,
a-bisabolol seems to be a much more effective agent in
some Ph
-
B-ALL cells than in other types of acute leuke-
mias at dosages that spare normal leukocytes and hema-
topoietic stem cells.
Methods
Patients and ethical requirements
Blasts from 28 patients with B-lineage ALL (14 Ph
-
,14
Ph
+
B-ALL) and 14 with AML diagnosed at our insti tu-
tion, as well as blood and bone marrow cells from five
healthy control donors, were collected after written
informed consent was obtained, according to Italian law.
All cellular s tudies were approved by the Verona Uni-
versity Hospital ethics committee. Patient characteristics
are detailed in Table 1. The diagnosis of B-ALL or AML
and their subtypes was based on clinical findings and on
established morphological, cytochemical, cytofluori-
metric, cytogenetic and molecular features of peripher al
blood and bone marrow cells. AML patients received
three induction courses according to standard AML
treatment (1
st
course: 3-day idarubicin + 7-day AraC by
continuous i.v. infusion; 2
nd
course: 3-day idarubicin +
3-day high-dose AraC; 3
rd
course: 3-day high-dose
AraC). B-ALL patients were treated with induction and
maintenance therapy according to the VR95ALL proto-
col [10], which has been subsequently developed into
the GIMEMA 0496 ALL protocol [11]. Young B-ALL
patients (<18 years) were treated according to a specific
pediatric protocol [12]. Ph
+
B-ALL patients underwent
differential treatment including BCR/ABL TKI. Allo-
geneic bone marrow transplantation was performed dur-
ing the first complete remission in four Ph
-
B-ALL cases
and four Ph
+
B-ALL cases.
Cells
1. Primary Leukemic cells
Viable leukemic cells were purified by conventional
methods from freshly heparinized peripheral blood with a
circulating blast count ≥30,000/mL, or from full-substi-
tuted bone marrow that was frozen in liqu id nitrogen at
diagnosis [13]. In all cases frozen cell samples contained
>95% blasts. Cell viability after thawing was always >90%,
as assessed by trypan blue staining.
2. Normal cells
Viable peripheral blood leukocytes [14] and bone marrow
cells from - 4 - control donors were treated and used as
specified above for leukemic cells.
3. Cell line
The imatinib-sensitive BCR/ABL
+
CML-T1 cell line
(T-lineage blast crisis of human chronic myeloid leuke-
mia, purchased from DSMZ, Braunschweig, DE) was
used to perform synergism studies.
Measurement of a-bisabolol concentrations in the
culture medium
a-bisabolol at a purity ≥95%(GC)waspurchasedfrom
Sigma-Aldrich, St. Louis, MO. The dose-dependent solu-
bilization of a-bisabolol in the culture medium over 24
hours was determined by a reverse-phase high perfor-
mance liquid chromatography (RP-HPLC) method, devel-
oped in the Department of Food Science of Bologna
University, Cesena office, Italy. All measurements were
performed in duplicate. The a-bisabolol concentrations
indicated throughout the article represent the calculated
soluble fraction in the assay.
Cytotoxicity assays
Cells derived from patients or normal donors were
exposed for 24 hours to 20, 40, 80, and 160 μM a-bisa-
bolol dissolved in ethanol (1:8 in order to minimize
A
0
50
100
150
200
250
0 50 100 150 200 25
0
μM -bisabolol added
μM -bisabolol measured
24 hours
y = 0.6543x – 0.0205
hours
μM -bisabolol measured
0
50
100
150
200
250
0 3 6 9 12 15 18 21 24
250 μM -bisabolol
B
C
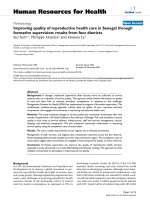
Figure 1 a-bisabolol structure and solubilization in the culture
medium. (A) a-bisabolol is a small oily sesquiterpene alcohol with a
molecular mass of 222.37 Da. (B) 250 μM a-bisabolol was added to
culture medium: concentration raised during the first 3 hours, then
lowered to around 65% of the initially added a-bisabolol after 24
hours. (C) By this time, the linear function relating added to
measured concentrations of a-bisabolol shows that the incremental
ratio was 0.65 for 14 evaluations representing a double series of 7
scaled concentrations tested by a RP-HPLC method. Each point is
the mean ± SD of 2 measurements.
Cavalieri et al. Journal of Translational Medicine 2011, 9:45
/>Page 2 of 13
Table 1 Patients’ characteristics.
patient sex age diagnosis Karyotype
mol biol
therapy* response
§
relapse OS
§§
Ph
-
B-ALL
#01 M 22 B common normal 1 + 2 CR Yes 29+
#02 M 40 Pre-B NA 1 + 2 CR No 24+
#03 M 16 B common normal 1 CR Yes 12
#04 M 45 Pre-B normal 1 + 2 CR No 38+
#05 F 53 B common hyperdiploid 1 CR No 71+
#06 F 48 Pro-B t(4;11) 1 CR Yes 8
#07 F 42 Pro-B t(4;11) 1 CR Yes 6
#08 M 41 Pre-B t(6;8) 1 CR Yes 19
#09 M 59 Pro-B t(4;11) 1 CR Yes 10
#10 F 19 B common hyperdiploid 1 CR No 55+
#11 M 17 B common t(17;22) 3 CR No 9+
#12 F 53 B common NA 1 CR Yes 13+
#13 F 43 B common normal 1 + 2 CR Yes 25
#14 F 17 B common normal 3 NR Yes 4
Ph
+
B-ALL
#01 M 44 Pre-B Ph masked
p210 (Y253H)
IM + D + 2 CR No 12+
#02 F 54 B common t(9;22)
p210
1 (pre-IM) no CR 36
#03 M 64 Pre-B t(9;22)
p210
IM CHR, CCyR Yes 9
#04 M 19 B common t(9;22)
NA (E255V)
1 + IM + N no CHR 16
#05 M 40 Pre-B t(9;22),-10
p210
1 + IM + D CHR, CCyR Yes 15
#06 F 38 Pre-B t(9;22)
p190 (T315I)
1 + IM + D no CHR 9
#07 M 17 B common t(9;22)
p210
1 (pre-IM) + 2 CR Yes 11
#08 M 70 Pre-B t(9;22)
NA
5 (pre-IM) no CR 1
#09 M 35 B common t(9;22), del(6)
p190
1 + IM + 2 CCyR, MMR No 46+
#10 M 63 B common t(9;22)
p190
IM + CS CCyR, MMR No 15+
#11 F 75 B common hyperdiploid, t(9;22), NA 5 (pre-IM) no CR 14
#12 M 89 Pre-B t(9;22)
p190
IM CCyR, MMR Yes 22+
#13 F 27 B common t(9;22)
p190
1 + IM no CHR 10
#14 M 28 B common t(9;22)
p190
1 + IM + 2 CR Yes 37
AML
#01 M 59 M2 +4,+8 4 PR Yes 7
#02 M 46 M0 NA 4 TD 1
#03 F 37 M4 del(X)(p21) 4 CR No 167+
#04 F 47 M2 normal 4 NR Yes 20
#05 F 70 M4 Eo inv(16) 4 NR no CR 6
#06 M 74 M4 normal 5 2
#07 M 62 M4 normal 4 NR no CR 5
#08 M 69 M4 Eo NA 5 5
#09 M 60 M2 -7 4 CR No 38+
#10 M 83 M2 NA 5 3
Cavalieri et al. Journal of Translational Medicine 2011, 9:45
/>Page 3 of 13
drug volumes), and when appropriate to 3 μM imatinib
mesylate (Novartis, Basel, CH), representative of the in
vivo active concentration. All cytotoxicity tests were per-
formed in triplicate.
1. Homogeneous cell populations
A lactate dehydrogenase (LDH) release assay was con-
ducted as follows. Thawed cells were resuspended in
RPMI-1640 (Lonza, Basel, CH) supplemented with 10%
heat-inactivated fetal bovine serum (FBS, Lonza), 50 U/mL
penicillin and 50 μg/mL streptomycin (complete medium,
CM), seeded at a density of 2 × 10
6
cell/mL and incubated
at 37°C in 5% CO
2
. After 24 hours, the cells were treated
with a-bisabolol (or ethanol as a vehicle control) as speci-
fied above. Cytotoxicity was determined using the Cyt o-
toxicity Detection Kit
PLUS
according to the manufacturer’s
recommendations (Roche, Mannheim, DE). LDH leakage
was measured as the ratio of treatment-induced LDH to
spontaneous LDH release. a-bisabolol and imatinib mesy-
late data were reported as the percent cytotoxicity for
treated compared to untreated cells and plotted as
dose-response curves over 24 hours. The half maximal
inhibitory concentration (IC
50
) was determined when
appropriate.
2. Heterogeneous cell populations
The absolute counts of normal leukocytes sub-popula-
tions were measured with TruCOUNT tubes (Becton
Dickinson, San Jose, CA) by polychromatic flow cytome-
try according to the manufacturer’sinstructionswith
minor modifications. Peripheral blood and bone marrow
cells were cultured with a-bisabolol for 24, 48, 72, 96
and 120 hours. At the end of the culture, 200 μLofsam-
ple, a mixture of antibodies (CD45 APC-H7, CD3 PE-
Cy7, CD19 PE, CD14 APC for peripheral blood and
CD45 APC-H7, CD34 PE, CD33 PE-Cy7 for bone mar-
row) and 7-amino-actinomycin D (all reagents from Bec-
ton Dickinson) for dead cells exclusion were added to the
TruCOUNT tubes. After a 15-minute incubation at room
temperature, 1 mL lysing reagent (Biosource, Nivelles,
BE) was added for 10 minutes. A total of 40,000 beads
were acquired on a FACSCanto cytometer (Becton Dick-
inson). A sequential Boolean gating strategy was used to
accurately enumerate different populations [15].
Cytotoxicity data hierarchical clustering analysis
To generate a classification based on a-bisabolol sensitiv-
ity, samples were grouped using the complete linkage
hierarchical clustering algorithm available in the MultiEx-
periment Viewer (MeV, version 4.3 - 4.
org/mev/). A heat map for sensitivity was derived using
the percentage data for mortality after adding a-bisabolol
with respect to spontaneous mortality at the same time.
Synergism studies
The interact ions between imatinib mesylate and a-bisa-
bolol were an alyzed according to the median-effect
method of Chou and Talalay [16] using the CalcuSyn
Software (Biosoft, Cambridge, UK). The mean combina-
tion index (CI) values, based on constant drug ratios,
were assessed with the following interpretation: CI>1,
antagonistic effect; CI = 1, additive effect; CI<1, syner-
gistic effect. Combination data were depicted as CI vs.
fraction affected (Fa) plots, defining the CI variability by
the sequential deletion analysis method. The cytotoxicity
was evaluated as described above.
Western blot analysis
Cells were homogenized at 4°C in 50 mM Tris-HCl
(pH 8) containing 0.1% Nonidet-P40 (NP-40), 200 mM
KCl, 2 mM MgCl
2
,50μMZnCl
2
, 2 mM DTT, and pro-
tease inhibitors [1 mM phenylmethylsulfonyl fluoride
(PMSF), 1 mg/mL l eupeptin, and 1 m g/mL antipain].
Aliquots of the homogenates (40 μg total protein/lane)
were loaded on SDS-polyacrylamide gels at the appro-
priate concentrations. Electrophoresis was perform ed at
100 V with a running buffer containing 0.25 M Tris-
HCl (pH 8.3), 1.92 M glycine, and 1% SDS. The resolved
proteins were electrobl otted onto a nitrocellulose mem-
brane using the iBlo t™ system (Invitrogen, Carlsbad,
CA). Membranes were then incubated with a mouse
mono clonal IgG antibody to poly(ADP-ribose) polymer-
ase (PARP) (Zymed, South San Francisco, CA), with a
rabbit polyclonal IgG antibody to BID (Cell Signaling
Technology, Danvers, MA) or with a rabbit polyclonal
IgG antibody to a-tubulin (Cell Signaling Technology).
The membranes were then washed and incubated with
Table 1 Patients’ characteristics. (Continued)
#11 M 88 M2 NA 5 1
#12 F 79 M0 normal 5 9
#13 M 52 M4 normal 4 CR No 24+
#14 F 61 M2 t(11;22) 4 CR Yes 11
*Therapy: 1 = ALLVR589 protocol [10] or subsequent GIMEMA protocol LAL0496 [11]; 2 = allogeneic bone marrow transplantation; 3 = AIEOP -BFM-ALL 2000
protocol [12]; 4 = AML standard treatment (see Matherials and Methods); 5 = supportive care (hydroxicarbamide, blood transfusions etc); CS = corticosteroid;
IM = imatinib; D = dasatinib; N = nilotinib
§
NA = not avalaible; CR = complete remission; PR = partial remission; NR = non-responder; TD = toxic death; CHR = complete hematologic remission; CCyR =
complete cytogenetic remission; MMR = major molecular remission (>3 log reduction bcr/abl ratio)
§§
+ = ongoing follow-up
Cavalieri et al. Journal of Translational Medicine 2011, 9:45
/>Page 4 of 13
an anti-mouse or anti-rabbit IgG peroxidase-conjugated
antibody (Cell Signaling Technology). The blots were
washed again and then incubated with enhanced chemi-
luminescent detection reagents (Immun-Star™ Wes-
ternC™ Kit, Bio-Rad, Hercules, CA) according to the
manufacturer’ s instructions. Proteins were detected
using the ChemiDoc XRS Imaging System (Bio-Rad).
Cytosolic and mitochondrial fraction preparation
Cell pellets were suspended in 100 μLofsolutioncon-
taining 10 mM NaCl, 1.5 mM MgCl
2
, 10 mM Tris-HCl,
pH 7.5, 1 mM sodium orthovanadate, and complete
EDTA-free protease inhibitor cocktail (Boehringer, Man-
nheim, DE). Cells were then chilled on ice for 10 minutes
and gently lysed by adding 0.3% (v/v) NP-40. In order to
restore an isotonic environment, a solution c ontaining
525 mM mannitol, 175 mM sucrose, 12.5 mM Tris-HCl,
pH 7.5, 2.5 mM EDTA, and protease inhibitor cocktail
was added. Lysates were first centrifuged at 600 × g at 4°
C in order to remove nuclei and then the supernatants
were centrifugated at 17,000 × g for 30 minutes at 4°C.
The obtained supernatants were collected and used as
the cytosolic fraction. The pellets, that contained mito-
chondria, were washed once with the same buffer and
then were resuspended in sample buffer. The cytosolic
and the mitochondrial fractions were separated on a 15%
SDS-PAGE and probed using a rabbit polyclonal IgG
antibody to BID (Cell Signaling Technology). Then, the
membrane with the cytosolic and mitochondrial fractions
were probed with a rabbit polyclonal IgG antibody to a-
tubulin (Cell Signaling Technology) and with a mouse
monoclonal IgG antibody to Hsp60 (Abcam, Cambridge,
UK), respectively.
Cell permeabilization
Leukemic cells and normal lymphocytes were centrifuged
(10 minutes, 200 × g) and washed with ice cold buffer A
(250 mM sucrose, 20 mM HEPES, 10 mM MgCl
2
-pH
7.1). The pellet was resuspended in 2 mL of buffer A con-
taining 80 μg of digitonin. After a 1-minute incubation on
ice, 8 mL of buffer A were added and cells were centri-
fuged (3 minutes, 400 × g). The pellet was resuspended in
100 μL buffer A containing 1 mM ADP, 2 mM KH
2
PO
3
(respiration buffer) and immediately used for the polaro-
graphic assay. Cell number and permeabilization was mea-
sured by the trypan blue exclusion method.
Oxygen consumption
Permeabilized leukemic cells and lymphocytes were
assayed for oxygen consumption at 30°C using a th ermo-
statically controlled oxygraph and Clark electrode. Cells
were incubated for 10 minutes in respiration buffer at 30°
C in the presence or absence of 3 μM a-bisabolol. Mito-
chondrial respiration (state 3 respiration) was started by
adding 5 mM glutamate plus malate (G/M) a nd 5 mM
succinate plus glycerol-3-phosphate (S/G3P), which are
complex I and complex III/glycerol-3-phosphate dehydro-
genase substrates, respectively. The maximal respiration
rate (uncoupled respiration) was empirically determined
by the addition of 200 nM carbonylcyani de-4- (trifluoro-
methoxy)-phenylhydrazone (FCCP). Oxygen consumption
was completely inhibited by adding 4 μM antimycin A at
the end of the experiments [17].
Mitochondrial membrane potential evaluation
Cells resuspended in CM at 1 × 10
6
/mL were treated
with 40 μM a-bisabolol for 3 or 5 hours at 37°C. They
were then washed with pre-warmed CM, 4 μMofthe
potential sensitive dye JC-1 (5,5’ ,6,6’ -tetra-chloro-
1,1’,3,3’-tetra-ethyl-benz-imidazolyl-carbocyanine iodide,
Molecular Probes, Eugene, OR) was added, and they
were then placed back into the incubator. After 30 min-
utes they were washed twice with pre-warmed PBS. An
aliquot of each sample was spotted on to a slide,
mounted with a coverslip and immediately recorded by
an Axio Observer inverted microscope (Zeiss, Gottingen,
DE). Visualization of JC-1 monomers (green fluores-
cence) and JC-1 aggregates (red fluorescence) was done
using filter sets for fluorescein and rhodamine dyes
(emission 488 and 550 nm respectively). Image captures
of random f ields using fixed imaging parameters were
performed, and previously u nviewed areas of cells were
captured to avoid photobleaching [18]. Image analysis
was done using Axiovision 3 software. The other aliquot
of each sample was resuspended in PBS a nd analyzed
using a FACSCalibur cytometer (Becton Dickinson)
equipped with a 488 nm argon laser. The emission of
JC-1 monomers was detected in Fl-1 using a 530/30 nm
bandpass filter, and JC-1 aggregates were detected in Fl-
2 using a 585/42 nm bandpass filter. FlowJo 8.8.2 soft-
ware (Tree Star, Ashland, OR) was used to analyze data
[19].
DNA ladder
For internucleosomal DNA laddering analysis, 5 × 10
6
cells were resuspended in 0.3 mL of culture medium
containing 10% FBS and incubated for 90 minutes at 65°
C and then o vernight at 37°C in the presence of 0.4 M
NaCl, 5 mM Tris-HCl (pH 8), 2 mM EDTA, 4% SDS
and 2 mg/mL proteinase K. The lysates were brought to
a final concentration of 1.58 M NaCl and centrifuged
twice for 10 minutes at 6,000 × g to separate the DNA
fragments from intact DNA. The supernatants were
recovered, and DNA wa s precipitated by the addition of
three volumes of absolute ethanol at -80°C for 1 hour.
The DNA pellets were recovered by microcentrifugation
(10 minutes, 12,000 × g) and resuspended in a minimal
volume of 40 μlof10mMTris-HCl(pH7.4),1mM
Cavalieri et al. Journal of Translational Medicine 2011, 9:45
/>Page 5 of 13
EDTA, and 1 mg/mL DNase-free ribonuclease A. Ali-
quots of 5 μg of DNA were then loaded onto a 1% agar-
ose gel containing 0.25 μg/mL ethidium bromide. After
electrophoresis, the DNA was visualized by UV light
using the ChemiDoc XRS Imaging System (Bio-Rad).
Statistics
Student’ s t-test for means, chi-squared tests, Mann-
Whitney U test and Kruskall-Wallis analysis of variance
by ranks were considered significant for p values < 0. 05.
The 24-hour IC
50
was approximated by using mean
cytotoxicity data in the different groups (according to
diagnosis or clustering-based analysis).
Results
a-bisabolol concentrations in the culture medium
Due to the lipophilic properties of a-bisabolol, a preli-
minary evaluation was performed of the dose-depende nt
solubilization in the culture medium over 24 hours by a
RP-HPLC method. The addition of a-bisabolol at time 0
was followed by a rapid increase of the measured con-
centrations during the first 3 hours. After 24 hours, con-
centrations may be considered roughly constant, though
with a slightly downward trend (Figure 1B). A double
series of 7 determinations corresponding to 0, 3, 15, 30,
60, 125, 250 μM a-bisabolol added to medium gave a
linear function with a 0.65 incremental ratio (Figure
1C), indicating tha t, after 24 hours, around 65% of the
a-bisabolol added was actually measured in the culture
medium.
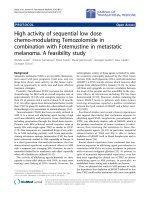
a-bisabolol cytotoxicity in normal peripheral blood cells
The viability o f normal blood cells was e valuated after
differenttimesanddosesofexposuretoa-bisabolol.
The cytotoxicity increased in a dose- and time-depen-
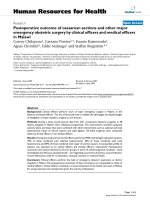
dent manner. Figure 2A depicts the sensitivity to
increasing doses of a -bisabolol for up to 120 hours in
each different blood cell subpopulation. T lymphocytes,
which were far less sensitive to a−bisabolol than B-lym-
phocytes, monocytes and neutrophils, had a 24-hour
IC
50
of 59 ± 7 μM and were only marginally sensitive to
40 μM a-bisabolol over 120 hours.
a-bisabolol cytotoxicity in normal counterparts of acute
leukemia cells
Figure 2B depicts the sensitivity to a-bisabolol in CD33
+
my and CD34
+
/33
+
or CD34
+
/19
+
cells from 5 normal
bone marrow samples. These subpo pulations were
assumed to represent the normal counterpart of acute
leukemia blasts and the hematopoietic compartment
that is responsible for bone marrow renewal and, even-
tually, drug toxicity. The 24-hour a-bisabolol IC
50
was
95 ± 7 and 62 ± 9 μMinCD33
+
my and CD34
+
cells,
respectively (p < 0.05). By contrast, no difference was
observed between CD34
+
/33
+
and CD34
+
/19
+
cells
(64 ± 6 and 63 ± 4 μMIC
50
, respectively).
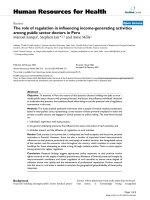
a-bisabolol cytotoxicity in primary acute leukemia cells
by diagnosis
Based on these data from normal cells, we performed ex
vivo dose-response (20, 40 80, and 160 μM a-bisabolol)
cytotoxicity assays at 24 hours in 42 different samples of
leukemic cells (14 Ph
-
B-ALL, 14 Ph
+
B-ALL, 14 AML)
obtained from patients before any treatment. Table 1
summarizes the main patient s’ characteristics. Table 2
shows the results of the cytoxicity assa ys as mean ± SD
after 24 hours of exp osure to different concentrations of
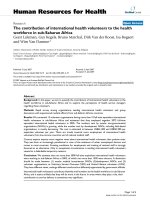
a-bisabolol, and Figure 3A depicts the corresponding
dose-response curves f or Ph
-
B-ALL, Ph
+
B-ALL, and
AML cells. The 24-hour dose-response assays showed
that a-bisabolol was cytotoxic to primary Ph
-
B-ALL cells
(33 ± 15 μMIC
50
). Though less sensitive, Ph
+
B-ALL,
A
hours
T lymphocytes
B lymphocytes
PMN
0
25
50
75
100
0 24 48 72 96 120
CD34+
160 μM
80 μM
40 μM
20 μM
0
25
50
75
100
0 24 48 72 96 120
CD33+ my
160 μ
M
80 μ
M
40 μ
M
20 μ
M
hours
0
25
50
75
100
0 24 48 72 96 120
160 μM
80 μM
40 μM
20 μM
0
25
50
75
100
0 24 48 72 96 120
160 μ
M
80 μ
M
40 μ
M
20 μ
M
0
25
50
75
100
0 24 48 72 96 120
cytotoxicity %
monocytes
160 μM
80 μM
40 μM
20 μM
0
25
50
75
100
0 24 48 72 96 120
160 μM
80 μM
40 μM
20 μM
B
Figure 2 Cytotoxicity of a-bisabolol in normal hematologic
cells. (A) Peripheral blood cells. (B) Bone marrow stem cells. Time-
and dose-response curves between 20 and 160 μM a -bisabolol in
the 120-hour cytotoxicity assays. Means ± SD of 5 normal donors
are depicted.
Cavalieri et al. Journal of Translational Medicine 2011, 9:45
/>Page 6 of 13
including Ph
+
-cells resistant to imatinib mesylate, and
AML cells were also killed (46 ± 11 and 54 ± 8 μMIC
50
,
respectively; p <0.05comparedtoPh
-
ALL). Thus, a-
bisabolol is a pro-apoptotic agent for acute leukemia cells
ex vivo,particularlyforPh
-
B-ALL.
a-bisabolol cytotoxicity on primary leukemic cells by
clustering analysis
We generated a cytotoxicity-based classification of our
leukemic samples using the complete linkage hierarchi-
cal clustering algorithm available in MultiExperiment
Viewer. As sh own in Figure 3B, clustering analysis iden-
tified three main groups (p < 0.05) by comparing differ-
ences among experimental samples with regard to
responsiveness to apoptotic signals induced by a-bisabo-
lol. The group with the highest sensitivity to a-bisabolol
(cluster 1: 14 ± 5 μMIC
50
) included 2 Ph
+
and 6 Ph
-
B-ALL cases. Thus, a proportion of the Ph
-
B-ALL cases
cluster 1 cluster 3 cluster 2
μM -bisabolol
100
75
25
50
0
40 20 80 160
cytotoxicity %
100
75
25
50
0
40 20 80 160
100
75
25
50
0
40 20 80 160
n=8
IC
50
=14±5
n=19
IC
50
=45±7
n=17
IC
50
=64±5
ALL01
ALL04
ALL05
Ph+08
ALL09
ALL06
Ph+10
ALL03
AML01
Ph+11
Ph+09
AML02
ALL08
AML03
AML11
Ph+14
Ph+02
ALL11
Ph+05
Ph+03
AML10
Ph+04
Ph+12
AML09
Ph+07
AML06
ALL02
ALL07
Ph+06
ALL10
ALL13
AML07
AML05
AML08
Ph+13
Ph+01
AML14
CD34+
AML04
ALL12
ALL14
AML13
AML12
CD33+my
B
0
50
100
cytotoxicity %
20
40
80
160
μM -bisabolol
Ph
-
B-ALL
cytotoxicity %
100
75
25
50
0
40 20 80 160
n=14
IC
50
=33±15
Ph
+
B-ALL
μM -bisabolol
100
75
25
50
0
40 20 80 160
n=14
IC
50
=46±11
AML
100
75
25
50
0
40 20 80 160
n=14
IC
50
=54±8
A
Figure 3 24-hourcytotoxicity of a-bisabolol in primary blasts from 42 acute leukemias.(A)a-bisabolol activity against blasts ex vivo, here
grouped by diagnosis. The corresponding IC
50
values and number of cases (n) are shown. The differences between the Ph
-
B-ALL sensitivity
curves and the other ones were statistically significant (p < 0.05). Each point is the mean ± SD of 14 cases. (B) a-bisabolol sensitivity clustering
analysis. The samples were grouped by complete linkage hierarchical clustering algorithm available in MultiExperiment Viewer 4.
org/mev/. The heat map was obtained by subtracting spontaneous mortality to scaled a-bisabolol 24-hour cytotoxicity expressed as percentage.
Three main groups of patients were identified based on their cytotoxicity response. The Ph
-
B-ALL (ALL) cases shared the highest sensitivity and
were grouped mainly in the first sensitivity cluster, whereas AML cases were split into two groups with intermediate and lower sensitivities. Ph
+
B-ALL (Ph+) cells were scattered among the three groups, although they were mainly clustered in the second group. At the bottom, the 24-
hour dose-response curves of the three sensitivity clusters are depicted, and the corresponding IC
50
values and number of cases (n) are shown.
The differences between the curves were statistically significant (p < 0.05).
Table 2 a-bisabolol cytotoxicity in acute leukemia cells
and in their normal counterparts (% mean values ± SD
according to a-bisabolol concentration).
μM a-bisabolol 20 40 80 160 IC
50
p
Ph
-
B-ALL 14 37 ± 36 55 ± 37 87 ± 12 100 33 ± 15 <0.05
ns
Ph
+
B-ALL 14 2 ± 19 42 ± 28 81 ± 17 98 ± 2 46 ± 11
AML 14 10 ± 9 32 ± 21 72 ± 11 96 ± 4 54 ± 8
cluster 1 8 72 ± 24 94 ± 6 99 ± 1 100 14 ± 5 <0.05
<0.05
cluster 2 19 17 ± 9 44 ± 14 77 ± 15 97 ± 3 45 ± 7
cluster 3 15* 3 ± 3 14 ± 8 73 ± 14 98 ± 2 65 ± 5
17
§
2 ± 3 14 ± 8 71 ± 16 97 ± 3 64 ± 5
CD34
+
5 1 ± 2 22 ± 19 72 ± 35 98 ± 1 62 ± 9 ns
<0.05
CD33
+
my 5 2 ± 2 4 ± 3 40 ± 39 99 ± 1 95 ± 7
*acute leukemia samples.
§
15 acute leukemias plus CD34
+
and CD33
+
my samples.
Cavalieri et al. Journal of Translational Medicine 2011, 9:45
/>Page 7 of 13
shared a high sensitivity to a-bisabolol, although some
other P h
-
B-ALL were scattered over different sens itivity
groups. The AML cases were split into two groups with
intermediate (cluster 2: 45 ± 7 μMIC
50
; 7 AML cases)
and lower (cluster 3: 65 ± 5 μMIC
50
; 7 AML cases) sen-
sitivity. Unlike Ph
-
B-ALL, AML cases as a whole were
less sensitive to a-bisabolol. The Ph
+
B-ALL cases were
scattered all over the three groups but were mainly clus-
tered with intermediate sensitivity AML. Interestingly,
introducing both CD34
+
and CD33
+
my cell sensitivity to
a-bisabolol (as the mean value of 5 cases) in clustering
analysis made it evident that ALL cells as a whole were
more sensitive to a-bisabolol than their normal counter-
part (grouped into cluster 3 among less sensitive cells).
This analysis demonstrated that some Ph
-
B-ALL cases
may be highly sensitive to the apoptotic mechanisms
activated by a-bisabolol and indicated that the Ph
+
B-
ALL cases and especially the AML cases (these latter
showing a bimodal sensitivity) may well be characterized
by variable degrees of resistance to these mechanisms.
Still, all leukemia cases were eventually responsive to 65
μM a-bisabolol for 24 hours (Table 2). In Figure 4, the
dose-response assays for each case are depicted.
a-bisabolol plus imatinib mesylate in cells bearing
mutated or non-mutated BCR/ABL
a-bisabolol was active against Ph
+
B-ALL cells (24-hour
IC
50
was 46 ± 11 μM; Figure 3). We wondered if a-bisabo-
lol and imatinib mesylate had synergistic effects. As shown
in Figure 5A cells from case Ph
+
B-ALL #04 (carrying the
E255V mutation, Table 1) were primarily resistant to ima-
tinib mesylate and showed similar ex vivo cytotoxicity
when treated with either a-bisabolol (20, 40 80, and 160
μM for 24 hours) alone or a-bisabolol associated with ima-
tinib mesylate (3 μM for 24 hours representative of in vivo
effective concentration). In contrast, cells sensitive to
PM D-bisabolol
cytotoxicity %
AML01 AML02 AML03 AML05AML04
AML06 AML07
100
75
25
50
0
4020 80 160
100
75
25
50
0
4020 80 160
100
75
25
50
0
4020 80 160
100
75
25
50
0
4020 80 160
100
75
25
50
0
4020 80 160
100
75
25
50
0
4020 80 160
100
75
25
50
0
4020 80 160
Ph+02Ph+01 Ph+06Ph+03 Ph+07Ph+04 Ph+05
100
75
25
50
0
4020 80 160
100
75
25
50
0
4020 80 160
100
75
25
50
0
4020 80 160
100
75
25
50
0
4020 80 160
100
75
25
50
0
4020 80 160
100
75
25
50
0
4020 80 160
100
75
25
50
0
4020 80 160
A
LL01
A
LL02
A
LL03
A
LL04
A
LL05
A
LL07
A
LL06
100
75
25
50
0
4020 80 160
100
75
25
50
0
4020 80 160
100
75
25
50
0
4020 80 160
100
75
25
50
0
4020 80 160
100
75
25
50
0
4020 80 160
100
75
25
50
0
4020 80 160
100
75
25
50
0
4020 80 160
ALL08 ALL09 ALL10
100
75
25
50
0
4020 80 160
100
75
25
50
0
4020 80 160
100
75
25
50
0
4020 80 160
100
75
25
50
0
4020 80 160
100
75
25
50
0
4020 80 160
100
75
25
50
0
4020 80 160
100
75
25
50
0
4020 80 160
ALL11 ALL12 ALL14ALL13
Ph+08 Ph+09 Ph+10
100
75
25
50
0
4020 80 160
100
75
25
50
0
4020 80 160
100
75
25
50
0
4020 80 160
100
75
25
50
0
4020 80 160
100
75
25
50
0
4020 80 160
100
75
25
50
0
4020 80 160
100
75
25
50
0
4020 80 160
Ph+12Ph+11 Ph+13 Ph+14
AML08 AML09 AML10
100
75
25
50
0
4020 80 160
100
75
25
50
0
4020 80 160
100
75
25
50
0
4020 80 160
100
75
25
50
0
4020 80 160
100
75
25
50
0
4020 80 160
100
75
25
50
0
4020 80 160
100
75
25
50
0
4020 80 160
AML11 AML12 AML13 AML14
Figure 4 24-hour cytotoxicity of a-bisabolol in each individual case.14Ph
-
B-ALL, 14 Ph
+
B-ALL, and 14 AML cell samples were treated wit h
20, 40, 80, and 160 μM a-bisabolol over 24 hours. Captions identify the cases in Table 1 and in Figure 3B (clustering analysis).
Cavalieri et al. Journal of Translational Medicine 2011, 9:45
/>Page 8 of 13
imatinib mesylate shared a significant increase in cytotoxi-
city to a-bisabolol. For instance, cells from patient Ph
+
B-
ALL #05 (Table 1) shifted from 40% cytotoxicity with
40 μM a-bisabolol alone to 75% with a-bisabolol plus ima-
tinib mesylate. This may suggest that the presence of BCR/
ABL tyrosine kinase activity in a cell reduces the effective-
ness of a-bisabolol as a pro-apoptotic agent or that imati-
nib mesylate reduces the IC
50
of a-bisabolol. The imatinib
mesylate-sensitive BCR/ABL
+
CML-T1 cell line, a T-cell
lineage blast crisis of CML, was used in order to conclu-
sively calculate the synergism, if any, between imatinib
mesylate and a-bisabolol. Figure 5B shows that the combi-
nation o f imatinib mesylat e and a-bisabolol resulted in a
higher degree of inhibition of cellul ar proliferation com-
pared with each inhibitor alone (p < 0.05), and the combi-
nation was clearly synergistic, denoted by CI values <1 for
any given Fa [16]. Also, the combination resulted in a
higher degree of induction of apoptosis ( data not shown).
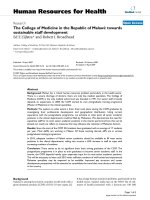
a-bisabolol and BID
We have previously demonstrated that a-bisabolol binds
to the BCL-2 family member BID [3]. To evaluate the
possibility that the treatment with a-bisabolol leads to
the cleavage of BID to truncated BID, we analyzed
whole extract of leukemic cells and normal PBMCs by
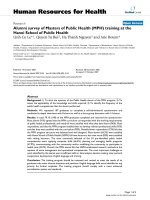
Western blot. As shown in Figure 6A, whereas trun-
cated BID is detectable in the human T-cell lympho-
blast-like cell line Jurkat used as a positive control, it is
not present in PBMCs and blasts, indicating that the
pro-apoptotic action of a-bisabolol is not dependent on
BID cleavage. However, caspase cleavage is not an abso-
lute requirement for activating BID pro-apoptotic func-
tion. Full-length BID is also capable of translocation to
the mitochondria, where it has been shown to potentiate
cell death following certain apoptotic signals [20]. But
we were unable to demonstrate f ull-length BID in the
mitochondria by separating cytosolic and mitochondrial
fraction following a-bisabolol treatment (Figure 6B).
Decrease of mitochondrial state 3 respiration
Inapreviouspaper,weconfirmedthemitochondrial
involvement in a-bisabolol-induced cell death by the
measurement of oxygen consumption by intact cells
[21]. In the current work we used pe rmeabilized leuke-
miccellsfrom6patients(3Ph
-
B-ALL, 1 Ph
+
B-ALL,
2AML) and healthy lymphocytes from 6 donors to
determine whether a-bisabolol treatment affects mito-
chondrial state 3 and unco upled respiration. Figure 6C
shows that NADH-supported state 3 respiration (G/M)
in a-bisabolol-treated leukemic cells was dramatically
decreased in comparison with untreated leukemic con-
trols (140.0 ± 70.5 vs. 280.7 ± 11.9 pmol O
2
/minute/10
6
cells; p < 0.05). In contrast, the oxygen consumption
sustained by S/G3P oxidation was not affected by a-
bisabolol treatment, and the mitochondrial respiration
was not stimulated by the addition of FCCP. These data
are in line with a loss of mitochondrial integrity in trea-
ted leukemic samples, which is responsible for the
matrix NADH decrease. This behavior is confirmed by
the observation that the respiration in the presence of
S/G3P was una ffected. Healthy lymphocyte respirati on
was not statistically modified by a-bisabolol treatment
in state 3 using G/M and S/G3P as substrates and
FCCP as a mitochondrial uncoupler. This is in agree-
ment with the resistance to a-bisabolol observed in
lymphocytes (Figure 2A).
Loss of mitochondrial potential
JC-1 staining [19,22 ] demonstrated that a-bisabolol dis-
sipates the mitochondrial transmembrane potential
(ΔΨ
m
). In fit cells, JC-1 is more concentrated in the
mitochondria (driven there by the ΔΨ
m
), where it forms
red-emitting aggregates, than in the cytosol, where it
A
B
2
1.5
0.5
1
0
CI
Fa
0.2 0.4 0.6 0.8 1
CML-T1
0
25
50
75
100
cell number
(% of control)
p<0.05
*
*
*
imatinib-sensitive
(patient #05)
100
75
25
50
0
imatinib-resistant
(patient #04)
cytotoxicity %
100
75
25
50
0
40 20 8
0
μM -bisabolol
Ph
+
B-ALL
40 20 80
Figure 5 24-hour cytotoxicity of a-bisabolol in Ph
+
cells as
compared to imatinib mesylate. (A) Scaled a-bisabolol alone
(solid line) or in combination with 3 μ M imatinib mesylate (dashed
line) in 2 representative cases out of 10 (Ph
+
B-ALL #04 and #05 in
Table 1, Figure 3B and Figure 4, where a-bisabolol concentrations
are represented up to 160 μM). The imatinib mesylate-dependent
cytotoxicity is indicated at point 0,0. Cells resistant to imatinib
mesylate were sensitive to a-bisabolol. In cells sensitive to imatinib
mesylate, a-bisabolol potentiated the effect of the other drug.
(B) Analysis of synergism between imatinib and a-bisabolol in the
imatinib-sensitive BCR/ABL
+
human cell line CML-T1. Left side. Effects
of 40 μM a-bisabolol and 0.1 μM imatinib, alone and combined, on
proliferation of the cell line. Means ± SD of 5 experiments. Right
side. Plot showing the corrisponding combination index (CI) vs. the
fraction affected (Fa). CI values are <1, indicating that the two drugs
are synergistic. Bars represent the variability of effects according to
the sequential deletion analysis [16].
Cavalieri et al. Journal of Translational Medicine 2011, 9:45
/>Page 9 of 13
exists as a green-fluorescent monomer. Accordingly, the
ratio red/green JC-1 fluorescence can be used as a sensi-
tive measure o f ΔΨ
m
[23]. Disruption of ΔΨm(ahall-
mark of cytochrome c transl ocation and the start of the
apoptotic process) is indicated by a loss of red fluores-
cence and an increase in green fluorescence. Figure 7A
shows the representative case Ph
-
B-ALL #01 out of the
6 tested. Microscopy revealed that in untreated leukemic
cells well-polarized mitochondria were marked by punc-
tate red fluorescent staining (Figure 7A, left side). After
a 3-hour incubation with 40 μM a-bisabolol, this pat-
tern was replaced by diffuse green fluorescence in leuke-
mic cells (Figure 7A, center and right side). Flow
cytometr y showed that untreated blasts with well-polar-
ized, red-emitting mitochondria localized in the upper
region of the plot (Figure 7A, left plot: high ΔΨ
m
).
Blasts exposed to 40 μM a-bisabolol underwent a
progressive loss of red fluorescence, indicated by a shift
right and downward over 3 (Figure 7A, central plot:
intermediate ΔΨ
m
) and 5 hours (Figure 7A, right plot:
low ΔΨ
m
). In contrast, normal lymphocytes used as a
negative control did not suffer any changes in their
microscopy or cytofluorimetric pattern when exposed to
a similar a-bisabolol concentration, indicating that there
was no mitochondrial damage (Figure 7B, images and
plots), and that the cells remained vital. Finally, the
same blasts depicted in Figure 7A underwent PARP
cleavage and DNA laddering following a-bisabolol expo-
sure (Figure 7C).
Discussion
Forecasting the fraction of the lipophilic compound
a-bisabolol that was dissolved in water at given times
was a basic preliminar y step to standardize the drug use
C
basal +-bisabolol
G/M
S/G3P
FCCP
0
100
200
300
400
500
600
700
800
G/M
S/G3P
FCCP
0
100
200
300
400
500
600
700
800
p<0.05
*
O
2
pmol/minute/10
6
cells
lymphocytes
*
leukemic cells
80 μM -bisabolol
mitochondria
ALL01 PBMC
1 3 5 basal 0.5
cytosol
BID
BID
-tubulin
Hsp60
1 3 5 basal 0.5
80 μM -bisabolol
B
ALL01 Jurkat PBMC
μM -bisabolol
BID
tBID
A
basal 40 80 20
basal 40 80 20
-tubulin
μM -bisabolol
Figure 6 BID and NADH-supported state 3 respiration in normal PBMCs and leukemic blasts treated with a-bisabolol. (A) 24-hour a-
bisabolol did not induced the cleavage of BID (full length 22 kDa, cleaved 15 kDa) at any concentration. Etoposide-treated Jurkat cells were
used as a positive control for tBID. (B) No BID translocation was detected in mitochondrial fraction at different times and solubilized doses of a-
bisabolol. a-tubulin and Hsp60 were used as markers for the cytosol and mitochondria fractions, respectively. A representative case is shown. (C)
Permeabilized leukemic cells and healthy lymphocytes were incubated for 10 minutes in respiration buffer at 30°C in the presence or in the
absence of 3 μM a-bisabolol. In treated leukemic cells, the G/M oxygen consumption was clearly lower than in untreated leukemic controls (p <
0.05). The S/G3P oxygen consumption was not modified by treatment, and the mitochondrial respiration was not stimulated by FCCP addition.
This is in line with a direct effect of a-bisabolol on mitochondrial integrity. Healthy lymphocyte respiration was not affected by treatment. G/M:
glutamate plus malate; S/G3P: succinate plus glycerol-3-phosphate; FCCP: carbonylcyanide-4-(trifluoromethoxy)-phenyl-hydrazone. Means ± SD of
6 leukemias and 6 normal donors are depicted.
Cavalieri et al. Journal of Translational Medicine 2011, 9:45
/>Page 10 of 13
in the conditions of our cytotoxicity tests. In these con-
ditions, we and an independent analytical laboratory
repeat edly measured that after 24 hours in culture med-
ium a-bisabolol lowered to around 65% of the theoreti-
cal concentrations added. In contrast, we could obtain
onlya2.5%solubilityfractioninpreviousstudies[1].
Thus, the present experiments led to define conditions
of maximal water solubility for a-bisabolol.
By cluster analysis, we separated out three subgroups
of leukemias with different sensitivities over 24 hours.
a-bisabolol was effective with an IC
50
of 14 ± 5 μMina
substantial proportion of Ph
-
B-ALL, and with an IC
50
of
45 ± 7 μM in a substantial proportion of both Ph
+
B-
ALL and AML cases. Remarkably, these concentrations
spared normal circulating leukocytes and CD34
+
and
CD33
+
my hematopoietic bone marrow precursors.
HUVECs, fibroblasts and hepatocytes were also spared
(personal observation). The third subgroup included
mainly, but not exclusively, AML samples with an IC
50
value of 65 ± 5 μM. Thus, Ph
-
B-ALL cases were defi-
nitely more sensitive than AML cases, whose IC
50
was
near to that observed in vitro also in normal leukocytes,
except lymphocytes, and in hematopoietic precursors.
Nevertheless, previous studiesinanimalmodelssug-
gested that similar a-bisabolol concentrations may be
safely administered through daily oral supplementation
even on a lon g-term basis [24,25]. The a-bisabo lol con-
centrations that we found active against leukemic cells
in vitro are also lower than, or similar to, the concentra-
tions that we measured in the blood and in the brains
of healthy mice sacrificed after treatment with 1.4 g/Kg
a-bisabolol. In these mice the blood parameters of liver
and kidney fucntional ity were preserved and, remark-
ably, the concentration in the brain exceeded 50 μM
without toxicity. Therefore, an active concentration of
a-bisabolol safely accumulated in a body environment
where lymphoid blasts have a tendency to localize and
surviveprotectedfromanumberofcurativedrugs[26].
Adoseof10mg/mousea-bisabolol induced a decrease
in the num ber of palpable mammary tumor masses
without adverse reaction in HER-2 transgenic mice [2].
Ph
+
B-ALL cells were also sensitive to a-bisabolol. In
three cases (Ph
+
B-ALL #01, #04, #06 in Table 1) with
primary mutation of BCR/ABL, we observed a full effi-
cacy of a-bisabolol. In imatinib mesylate-sensitive blasts,
the association of a-bisabolol and imatinib mesylate led
to a synergistic effect which we have conclusively calcu-
lated as a CI<1 at any given Fa [16] in the BCR/ABL
+
human cell line CML-T1. It is not clear, however,
whether the synergism depends on inte rnalization
mechanics or on intracellular modulation of the dama-
ging actions of each or both drugs. A compound like
a-bisabolol - and others [27] - could help to identify
profitable new strategies for both mutated and non-
mutated leukemias [9,28,29].
C
JC-1 monomers
B
JC-1 aggregates
high
m
untreated 5 hours
3
hours
JC-1 monomers
A
JC-1 aggregates
high
m
int
m
low
m
DNA ladder
PARP cleavage
116 KDa
85 KDa
C 1h 3h 5h
C 3h 2h 1h
Figure 7 a-bisabolol-induced mitochondrial damage in primary
leukemic blasts. Cells were stained with JC-1. In non-damaged
cells, JC-1 forms red-emitting aggregates in the mitochondrial
matrix. A loss of red fluorescence and an increase in cytoplasmic
green-emitting monomers signal the disruption of the
mitochondrial transmembrane potential (ΔΨm). (A) The
representative case Ph
-
B-ALL #01 is shown out of the 6 leukemias
tested. Microscopy (magnification, × 400). Whereas untreated
leukemic blasts showed well-polarized mitochondria marked by
punctated red fluorescent staining, blasts treated with 40 μM
a-bisabolol had staining that was quite completely replaced by
diffuse green fluorescence, indicating loss of ΔΨm. Flow cytometry.
Untreated blasts with well-polarized mitochondria localized in the
upper region of the plot (high ΔΨm). Blasts exposed to 40 μM
a-bisabolol shifted right and downward (intermediate and low
ΔΨm), due to the progressive dislocation of JC-1 from the
mitochondria to the cytoplasm, which signaled the disruption of
the mitochondrial ΔΨm. (B) Both untreated and a-bisabolol-treated
normal lymphocytes used as a negative control maintained well-
polarized mitochondria and did not undergo apoptosis. Apoptosis
of leukemic blasts was also documented by (C) PARP cleavage and
DNA laddering in the same representative case depicted in (A).
Cavalieri et al. Journal of Translational Medicine 2011, 9:45
/>Page 11 of 13
Our biochemical data suggest a direct effect on mito-
chondrial integrity as a possible mechanism of a-bisabo-
lol damage to leukemic cells. This behavior is supported
by the observed oxygen consumption decrease in the
presence of glutamate/malate and by the unaffected
respiration rates in the presence of succinate/glycerol-3-
phosphate. Microscopy and f low cytometry data show
that a-bisabolol disrupts ΔΨ
m
, which induces outer
membrane permeabilization and leads to the apoptotic
death of blasts. Our data not only implicate a-bisabolol
for the first time in mitochondrial impairment in human
leukemic cells but also suggest that this goes through a
peculiar model of cell death, i.e., the formation of a cel-
lular population with intermediate DΨ
m
which is a fea-
ture of apoptosis seen only in a few cell types and never
described to date in leukemic blasts [30].
In all leukemia samples treated with a -bisabolol, BID
was found to be expressed in a full-lenght form that was
suitable for binding to a-bisabolol . We failed to demon-
strate full-length BID tran slocation to the mitochondria
in leukemic cells as a pro-apoptotic mechanism [19].
Nevertheless, BID might act as a carrier that conveys a-
bisabolol to the mitochondrial membrane.
Thus, according to our previous and present work, a-
bisabolol enters cells via lipid rafts and direct ly involves
mitochondrial permeability transition pore opening [20],
which is responsible for the reduced glutamate/malate-
supported oxygen consumption and leads to disruption
of the mitochondrial membrane potential and pro-
grammed cell death. The reciprocal role of BID and a-
bisabolol [3] remains elusive in leukemic cells.
Conclusion
We provide here the first evidence that a-bisabolol is an
effective pro-apoptotic agent in primary ALL cells at
concentrations and durations that spare normal blood
and bone marrow cells. It reta ins cytotoxic potential in
both imatinib mesylate-resistant and -sensitive Ph
+
B-
ALL. It is also active against primary AML cells at
slightly higher concentrations. Our findings support a-
bisabolol as a possible candidate for the treatment of
acute leukemias an d establish a basis for studies in
animal models.
Acknowledgements
The authors thank mathematics professor Vincenza Tomasello for her
criticism and advice on numerical analysis and appreciate that she is surely a
firm believer in Plato’s “Let nobody ignorant of geometry enter here”. This
work was supported by grants from the Venetian Institute of Oncology (IOV),
Padua (Italy) and from Fondazione Cariverona, Verona (Italy).
Author details
1
Department of Sciences of Life and Reproduction, Section of Biochemistry,
University of Verona, Italy.
2
Department of Medicine, Section of Hematology,
University of Verona, Italy.
3
Department of Biochemistry “G. Moruzzi”,
University of Bologna, Italy.
Authors’ contributions
EC, AR, ACdP performed the research, analyzed data, and performed
statistical analysis; MB, EG, CB, RF contributed analytical tools, performed
selected experiments and analyzed data; GP contributed criticism; HS
suggested the research, contributed ideas and critical scientific knowledge,
analyzed and interpreted data; FV chose the clinical setting, designed and
performed the research, analyzed and interpreted data, and wrote the paper;
all authors checked the final version of the manuscript.
Competing interests
The authors declare that they have no competing interests.
Received: 18 November 2010 Accepted: 21 April 2011
Published: 21 April 2011
References
1. Cavalieri E, Mariotto S, Fabrizi C, De Prati AC, Gottardo R, Leone S, Berra LV,
Lauro GM, Ciampa AR, Suzuki H: α-bisabolol, a non-toxic natural
compound, strongly induces apoptosis in glioma cells. Biochem Biophys
Res Commun 2004, 315:589-594.
2. Costarelli L, Malavolta M, Giacconi R, Cipriano C, Gasparini N, Tesei S,
Pierpaoli S, Orlando F, Suzuki H, Perbellini L, Piacenza F, Emanuelli M,
Mocchegiani E: In vivo effect of alpha-bisabolol, a nontoxic
sesquiterpene alcohol, on the induction of spontaneous mammary
tumors in HER-2/neu transgenic mice. Oncol Res 2010, 18:409-418.
3. Darra E, Abdel-Azeim S, Manara A, Shoji K, Marechal JD, Mariotto S,
Cavalieri E, Perbellini L, Pizza C, Perahia D, Crimi M, Suzuki H: Insight into
the apoptosis-inducing action of α-bisabolol towards malignant tumor
cells: Involvement of lipid rafts and Bid. Arch Biochem Biophys 2008,
476:113-123.
4. Tallman MS, Gilliland DG, Rowe JM: Drug therapy for acute myeloid
leukemia. Blood 2005, 106:1154-1163.
5. Appelbaum FR, Rosenblum D, Arceci RJ, Carroll WL, Breitfeld PP, Forman SJ,
Larson RA, Lee SJ, Murphy SB, O’Brien S, Radich J, Scher NS, Smith FO,
Stone RM, Tallman MS: End points to establish the efficacy of new agents
in the treatment of acute leukemia. Blood 2007, 109:1810-1816.
6. Lancet JE, Giralt S: Therapy for older AML patients: the role of novel
agents and allogeneic stem cell transplant. J Natl Compr Canc Netw 2008,
6:1017-1025.
7. Kohrt HE, Coutre SE: Optimizing therapy for acute myeloid leukemia.
J Natl Compr Canc Netw 2008, 6:1003-1016.
8. Bradeen HA, Eide CA, O’Hare T, Johnson KJ, Willis SG, Lee FY, Druker BJ,
Deininger MW: Comparison of imatinib mesylate, dasatinib (BMS-
354825), and nilotinib (AMN107) in an N-ethyl-N-nitrosourea (ENU)-
based mutagenesis screen: high efficacy of drug combinations. Blood
2006, 108:2332-2338.
9. Cortes J, Rousselot P, Kim DW, Ritchie E, Hamerschlak N, Coutre S,
Hochhaus A, Guilhot F, Saglio G, Apperley J, Ottmann O, Shah N, Erben P,
Bradford S, Agarwal P, Gollerkeri A, Baccarani M: Dasatinib induces
complete hematologic and cytogenetic responses in patients with
imatinib-resistant or intolerant chronic myeloid leukemia in blast crisis.
Blood 2007, 109:3207-3213.
10. Todeschini G, Tecchio C, Meneghini V, Pizzolo G, Veneri D, Zanotti R,
Ricetti MM, Solero P, Aprili F, Perona G: Estimated 6-year event-free
survival of 55% in 60 consecutive adult acute lymphoblastic leukemia
patients treated with an intensive phase II protocol based on high
induction dose of daunorubicin. Leukemia 1998, 12:144-149.
11. Vitale A, Guarini A, Ariola C, Mancini M, Mecucci C, Cuneo A, Pane F,
Saglio G, Cimino G, Tafuri A, Meloni G, Fabbiano F, Recchia A, Kropp MG,
Krampera M, Cascavilla N, Ferrara F, Romano A, Mazza P, Fozza C, Paoloni F,
Vignetti M, Foà R: Adult T-cell acute lymphoblastic leukemia: biologic
profile at presentation and correlation with response to induction
treatment in patients enrolled in the GIMEMA LAL 0496 protocol. Blood
2006, 107:473-479.
12. Ratei R, Basso G, Dworzak M, Gaipa G, Veltroni M, Rhein P, Biondi A,
Schrappe M, Ludwig WD, Karawajew L, for the AIEOP-BFM-FCM-MRD-Study
Group: Monitoring treatment response of childhood precursor B-cell
acute lymphoblastic leukemia in the AIEOP-BFM-ALL 2000 protocol with
multiparameter flow cytometry: predictive impact of early blast
reduction on the remission status after induction. Leukemia
2009,
23:528-534.
Cavalieri et al. Journal of Translational Medicine 2011, 9:45
/>Page 12 of 13
13. Vinante F, Rigo A, Papini E, Cassatella MA, Pizzolo G: Heparin-binding
epidermal growth factor-like growth factor/diphtheria toxin receptor
expression by acute myeloid leukemia cells. Blood 1999, 93:1715-1723.
14. Vinante F, Marchi M, Rigo A, Scapini P, Pizzolo G, Cassatella MA:
Granulocyte-macrophage colony-stimulating factor induces expression
of heparin-binding epidermal growth factor-like growth factor/
diphtheria toxin receptor and sensitivity to diphtheria toxin in human
neutrophils. Blood 1999, 94:3169-3177.
15. Gratama JW, Keeney M, Sutherland DR: Enumeration of CD34+
hematopoietic stem and progenitor cells. In Current Protocols in
Cytometry. Edited by: Robinson JP, Darzynkiewicz Z, Dean PN, Dressler LG,
Rabinovitch PS, Stewart CC, Tanke HJ, Wheeless LL. New York: John Wiley
1999:, 6.4.1-22.
16. Chou T-C, Talalay P: Quantitative analysis of dose-effect relationships: the
combined effects of multiple drugs or enzyme inhibitors. Adv Enzyme
Regul 1984, 22:27-55.
17. Chretien D, Bénit P, Chol M, Lebon S, Rötig A, Munnich A, Rustin P: Assay
of mitochondrial respiratory chain complex I in human lymphocytes and
cultured skin fibroblasts. Biochem Biophys Res Commun 2003, 301:222-224.
18. Nougayrède JP, Donnenberg MS: Enteropathogenic Escherichia coli EspF
is targeted to mitochondria and is required to initiate the mitochondrial
death pathway. Cell Microbiol 2004, 611:1097-1111.
19. Troiano L, Ferraresi R, Lugli E, Nemes E, Roat E, Nasi M, Pinti M, Cossarizza A:
Multiparametric analysis of cells with different mitochondrial membrane
potential during apoptosis by polychromatic flow cytometry. Nat Protoc
2007, 2:2719-2727.
20. Zinkel S, Gross A, Yang E: BCL2 family in DNA damage and cell cycle
control. Cell Death and Differentiation 2006, 13:1351-1359.
21. Cavalieri E, Bergamini C, Mariotto S, Leoni S, Perbellilni L, Darra E, Suzuki H,
Fato R, Lenaz G: Involvement of mitochondrial permeability transition
pore opening in alpha-bisabolol induced apoptosis. FEBS J 2009,
276:3990-4000.
22. Galluzzi L, Zamzami N, de La Motte Rouge T, Lemaire C, Brenner C,
Kroemer G: Methods for the assessment of mitochondrial membrane
permeabilization in apoptosis. Apoptosis 2007, 12:803-813.
23. Métivier D, Dallaporta B, Zamzami N, Larochette N, Susin SA, Marzo I,
Kroemer G: Cytofluorometric detection of mitochondrial alterations in
early CD95/Fas/APO-1-triggered apoptosis of Jurkat T lymphoma cells.
Comparison of seven mitochondrion-specific fluorochromes. Immunol
Lett 1998, 61:157-163.
24. Bhatia SP, McGinty D, Letizia CS, Api AM: Fragrance Material Review on α-
bisabolol. Food Chem Toxicol 2008, 46(Suppl 11):S72-S76.
25. Kamatou GPP, Viljoen AM: A review of the application and
pharmacological properties of α-bisabolol and
α-bisabolol-rich oils. JAm
Oil Chem Soc 2009, 28:1-7.
26. Stanulla M, Schrappe M: Treatment of childhood acute lymphoblastic
leukemia. Semin Hematol 2009, 46:52-63.
27. Zhang H, Trachootham D, Lu W, Carew J, Giles FJ, Keating MJ,
Arkinghaus RB, Huang P: Effective killing of Gleevec-resistant CML cells
with T315I mutation by a natural compound PEITC through redox-
mediated mechanism. Leukemia 2008, 22:1191-1199.
28. Druker BJ: Circumventing resistance to kinase-inhibitor therapy. N Engl
J Med 2006, 354:2594-2596.
29. Talpaz M, Shah NP, Kantarjian H, Donato N, Nicoll J, Paquette R, Cortes J,
O’Brien S, Nicaise C, Bleickardt E, Blackwood-Chirchir MA, Iyer V, Chen TT,
Huang F, Decillis AP, Sawyers CL: Dasatinib in imatinib-resistant
Philadelphia chromosome positive leukemias. N Engl J Med 2006,
354:2531-2541.
30. Lugli E, Troiano L, Ferraresi R, Roat E, Prada N, Nasi M, Pinti M, Cooper EL,
Cossarizza A: Characterization of cells with different mitochondrial
membrane potential during apoptosis. Cytometry 2005, 68:28-35.
doi:10.1186/1479-5876-9-45
Cite this article as: Cavalieri et al.: Pro-apoptotic activity of a-bisabolol
in preclinical models of primary human acute leukemia cells. Journal of
Translational Medicine 2011 9:45.
Submit your next manuscript to BioMed Central
and take full advantage of:
• Convenient online submission
• Thorough peer review
• No space constraints or color figure charges
• Immediate publication on acceptance
• Inclusion in PubMed, CAS, Scopus and Google Scholar
• Research which is freely available for redistribution
Submit your manuscript at
www.biomedcentral.com/submit
Cavalieri et al. Journal of Translational Medicine 2011, 9:45
/>Page 13 of 13