Báo cáo sinh học: "Combination therapy with vemurafenib (PLX4032/RG7204) and metformin in melanoma cell lines with distinct driver mutations" pdf
Bạn đang xem bản rút gọn của tài liệu. Xem và tải ngay bản đầy đủ của tài liệu tại đây (1.04 MB, 13 trang )
RESEARC H Open Access
Combination therapy with vemurafenib
(PLX4032/RG7204) and metformin in melanoma
cell lines with distinct driver mutations
Franziska Niehr
1
, Erika von Euw
1
, Narsis Attar
1
, Deliang Guo
2
, Doug Matsunaga
1
, Hooman Sazegar
1
, Charles Ng
1
,
John A Glaspy
1,3
, Juan A Recio
4
, Roger S Lo
3,5
, Paul S Mischel
2,3
, Begonya Comin-Anduix
3,6
and Antoni Ribas
1,3,6*
Abstract
Background: A molecular linkage between the MAPK and the LKB1-AMPK energy sensor pathways suggests that
combined MAPK oncogene inhibition and metabolic modulation of AMPK would be more effective than either
manipulation alone in melanoma cell lines.
Materials and methods: The combination of the BRAF inhibitor vemurafenib (formerly PLX4032) and metformin
were tested against a panel of human melanoma cell lines with defined BRAF and NRAS mutations for effects on
viability, cell cycle and apoptosis. Signaling molecules in the MAPK, PI3K-AKT and LKB1-AMPK pathways were
studied by Western blot.
Results: Single agent metformin inhibited proliferation in 12 out of 19 cell lines irrespective of the BRAF mutation
status, but in one NRAS
Q61K
mutant cell line it powerfully stimulated cell growth. Synergistic anti-proliferative
effects of the combination of metformin with vemurafenib were observed in 6 out of 11 BRAF
V600E
mutants,
including highly synergistic effects in two BRAF
V600E
mutant melanoma cell lines. Antagonistic effects were noted
in some cell lines, in particular in BRAF
V600E
mutant cell lines resistant to single agent vemurafenib. Seven out of 8
BRAF wild type cell lines showed marginally synergistic anti-proliferative effects with the combination, and one cell
line had highly antagonistic effects with the combination. The differential effects were not dependent on the
sensitivity to each drug alone, effects on cell cycle or signaling pathways.
Conclusions: The combination of vemurafenib and metformin tended to have stronger anti-proliferative effects on
BRAF
V600E
mutant cell lines. However, determinants of vemurafenib and metformin synergism or antagonism need
to be understood with greater detail before any potential clinical utility of this combination.
Introduction
Mutually exclusive mutations in NRAS and BRAF pro-
vide oncogenic driver signals in melanoma of skin origin
through the constitutive activation of t he mitogen-acti-
vated protein kinase (MAPK) pathway [1-3]. The clinical
relevance of blocking these driver mutations is high-
lighted by the targeted inhibition of BRAF
V600E
with
class I RAF inhibitors like vemurafenib (formerly
PLX4032 or RG7204) or GSK2118436, which led to
unprecedented high response rates in patients with
metastatic melanoma [4,5]. Unfortunately, most
responses are transient in part due to the development
of secondary mutations in NRAS [6], increased expres-
sion of the cancer Osaka thyroid (COT, also known as
MAP3K8)kinase[7],ormorecommonlytheupregula-
tion of receptor tyrosine kinases (RTKs) like the plate-
let-derived growth factor receptor beta (PDGFRb) [6] or
the insulin-like growth factor-1 receptor (IGF1R) [8].
Recent research suggests that there is a molecular
linkage between the MAPK pathway and the LKB1-
AMPK energy sensor pathway [9,10]. The liver kinase
B1 (LKB1) is a serine/t hreonine kinase that functi ons as
a tumor suppressor gene and is inactivated in Peutz-
Jeghers syndrome. LKB1, together with low energy
* Correspondence:
1
Department of Medicine, Division of Hematology/Oncology, University of
California Los Angeles (UCLA), Los Angeles, CA, USA
Full list of author information is available at the end of the article
Niehr et al . Journal of Translational Medicine 2011, 9:76
/>© 2011 Niehr et al; licensee BioM ed Central Ltd. This is an Op en Access articl e distributed und er the terms of the Creative Co mmons
Attribution License (http://cre ativecommons.org/licenses/by/2.0), which permits unrestricted use, distribution, and reproduction in
any medium, provided the original work is properly cited.
conditions, activates the AMP-activated protein kinase
(AMPK), which results in inhibition of cell growth and
proliferation. LKB1 can be phosphorylated by ERK (at
Ser325) and p90
RSK
(at Ser428), which compromise its
ability to bind and activate AMPK. In BRAF
V600E
mutant melanoma cells there is an uncoupling of the
LKB1-AMPK complex [9,10]. These data suggest that
AMPK can no longer be phosphorylated and therefore
activated by LKB1, resulting in AMPK being unable
to inhibit cel l growth, proliferation and survival.
This uncoupling of the LKB1-AMPK complex allows
BRAF
V600E
oncogene-driven cancer cells to become
resistant to energy stress and avoid apoptosis [9].
AMPK functions as a master cellular energy sensor
that is activated by metabolic stress, which results in an
increase of the cellular AMP /ATP ratio either by inhi-
biting ATP synthesis (e.g. due to ischemia or hypoxia)
or accelerating ATP consump tion (e.g. due to muscle
contraction). Once activated by phosphorylation at
Thr172, A MPK leads to the inhibition of ATP-consum-
ing processes l ike gluconeogenesis and fatty acid synth-
esis, and stimulates ATP g enerating processes like fatty
acid oxidation [11]. AMPK inhibits fatty acid synthesis
via phosphorylation and therefore inactivation of the
ACC1 isoform of acetyl CoA carboxylase (ACC) [12] or
suppression of lipogenic gene expression, including
ACC1 and fatt y acid synthase, and increase of fatty acid
oxidation by phos phorylat ion and inactiv atio n of ACC2
[13]. A recent manuscript reported on th e direct antitu-
mor effects of modulating AMPK in two melanoma cell
lines, one with a BRAF mutation and another with an
NRAS mutation [14]. This study suggested that AMPK
may have a role as a negative regulator and suppressor
of malignant melanoma cell growth, further promoting
evidence of expanding the testing of the role of AMPK
activation for melanoma treatment.
Metformin is a derivative of guanidine, one of the
active ingredients (along with the isoprenyl guanidine
derivative, galegine) in the ancient herbal remedy French
Lilac (Galega officinalis). Metformin has been used to
treat type-2 diabetes for over 50 years. It reduces blood
glucose levels mainly through inhibition of hepatic glu-
coneogenesis. In order to enter the cell, metformin and
its analogue phenformin need the organic cation trans-
porter-1 (OCT1). There it can inhibit mitochondrial
ATP production and thus activate AMPK indirectly by
increasing the cellular AMP/ATP ratio [11]. The dele-
tion of LKB1 in mice abolished the effect of metformin
on AMPK activity and blood glucose levels , establishing
the role of LKB1 as the main kinase that mediates
AMPK activation upon exposure to metformin [15].
In this manuscript we tested the hypothesis that com-
bination of BRAF oncogene inhibition and metabolic
modulation of AMPK would be more effective than
either manipulation alone in arresting melanoma cell
proliferation. We tested a combination of vemurafenib
and metformin in a panel of melanoma cell lines with
defined BRAF and NRAS mutations. The range of con-
centrations for both agents was chosen based on prior
reports on the single agent activity of each one of them
[14,16,17]. In our studies, the combination of vemurafe-
nib and metformin synergistically inhibited proliferation
in a subset of human melanoma cell lines and induced
cell cycle arrest or apoptosis, but the differential effects
in cell lines was not fully explained by the modulation
of the MAPK and AMPK-LKB1 pathways.
Materials and methods
Reagents
Vemurafenib (also known as PLX4032, RG7204 or
RO5185426) was obtained from Dr. Gideon Bollag
under a materials transfer agreement (MTA) with Plex-
xikon (Berkeley, CA). The compound was dissolved in
dimethyl sulfoxide (DMSO, Sigma-Aldrich, St. Louis,
MO) to a concentration of 100 mM and additionally in
RPMI 1640 media (Mediatec hInc.,Manassas,VA)toa
working stock concentration of 100 μM. Metformin
(also known as 1,1-dimethylbiguanide hydrochlorid e)
was purchased from Sigma-Aldrich and dissolved in
RPMI media to a working stock concentration of
200 mM. Both stock solutions were stored at 4°C for up
to 1 week.
Cell culture
Human melanoma cell lines from the M series were
derived from patient’ s biopsies under UCLA IRB
approval #02-08-067 and have been previously described
[16]. SKMEL28, WM1366, SBCL2 and SKMEL173 were
obtained from American Type Culture Collection (Rock-
ville, MD). All cell lines were mycoplasma free when
periodically tested with the Mycoalert Mycoplasma
Detection Kit (Lonza, Rockland, ME).
Cell proliferation assays
Melanoma cell lines were treated in triplicate with
vemurafenib, metformin or parallel vehicle control at the
given concentrations for 72 hours. Cell viability was
measured using a tetrazolium compound [3-(4,5-
dimethylthiazol-2-yl)-5-(3-carboxymethoxyphenyl)-2-(4-
sulfophenyl)-2H-tetrazolium (MTS)]-based colorimetric
cell proliferation assay (Promega, Madison, WI) as pre-
viously described [16].
Cell cycle analysis
Cells were treated with different concentratio ns o f
vemurafenib, metformin, the combination or parallel
vehicle control for 24 hours, fixed wit h Cytofix/Cyto-
perm(BDBiosciences,SanJose,CA),washedwith
Niehr et al . Journal of Translational Medicine 2011, 9:76
/>Page 2 of 13
Perm/Wash (BD Biosciences), and then resuspended in
sterile PBS containing 0.5 μg/mL DAPI (Sigma-Aldrich).
Flow cytometry analyses for this and other experiments
was performed in an LSR-II (BD Biosciences) and data
was analyzed using FlowJo (Tree Star Inc, Asland, OR).
Apoptosis analysis
Cells were plated in 6-well plates and treated with
DMSO, vemurafenib, metformin, the combination or 1
μM staurosporine as a positive control. After 72 hours
apoptosis analysis was performed using the FITC
Annexin V Apoptosis Detection Kit (BD Biosciences)
following the manufacturer’s instructions and analyzed
by flow cytometry.
Phospho-flow staining
Staining of phosphorylated AKT (p-AKT Thr308) in
melanoma cells exposed to DMSO, vemurafenib, met-
formin or the combination for 24 hours was perfo rmed
in permeabilized cells using the phosphoflow technique
as previously described [18] and analyzed by flow
cytometry.
Western Blotting
Western blotting was performed as previously described
[19]. Primary antibodies included pCRAF (Ser289/296/
301), CRAF, pMEK1/ 2 (Ser217/221), MEK1/2, pERK1/2
(Thr202/Tyr204, Thr185/Tyr187), ERK1/2, pLKB1
(Ser428), LKB1, pAMPKa (Thr172), AMPKa,pACC
(Ser79), ACC, pS6K (Thr389), S6K, pS6 (Ser235/236),
S6, and b-actin (all from Cell Signaling Technology,
Danvers, MA). The immunoreactivity was revealed by
use of Pierce Super Signal West Pi co Chemilumi nescent
Substrate (Thermo Scientific, Rockford, IL).
Low glucose experiments
Cells were plated in standard high glucose RPMI media
(3000 mg/L). After 24 hours, media was aspirated and
low glucose media was added to the cells for at least 4
hour s before treatment. Low glucose media consisted of
RPMI media without glucose, supplemented with L-glu-
tamine (Mediatech), to which 1000 mg/L D-glucose
(Sigma-Aldrich), 10% FBS and 1% PSF were added. Cells
were treated with different concentrations of DMSO,
vemuraf enib, metformi n or the combination in low glu-
cose media. For incubations longer than 24 hours, drugs
were added freshly every day.
Statistical Analysis
To determine synergistic, additive, or antagonistic effects
of the drug combinations we used the comb ination
index method of Chou and Talalay [20] using the Calcu-
Syn software (version 2.0 Biosoft, Cambridge, UK). This
method takes into account both potency [median dose
(Dm) or IC
50
] and the shape of the dose-effect curve
(the m value) to calculate the combination index (CI). A
CI equal to 1 indicates an additive effect; a CI less than
1 indicates synergy. With the use of CalcuSyn software,
synergy is further refined as synergism (CI = 0.3-0.7),
strong synergism (CI = 0.1-0.3), and very strong syner-
gism (CI < 0.1).
Results
Cell growth inhibition with single agent vemurafenib or
metformin
A panel of 19 melanoma cell lines with previously char-
acterized [6,16] oncogenic alterations (Table 1) was first
used to test the antitumor effects of single agent expo-
sure to vemuraf enib or metfo rmin. This panel inc luded
previously established cell lines [16] and two cell lines
that had been derived as sub-lines with acquired resis-
tance to vemurafen ib thro ugh continuous in vitro expo-
sure to this agent [6]. These cell lines are representative
of different onc ogenic events in melanoma and include
10 cell lines with a BRAF (BRAF
V600E
)and7celllines
with an NRAS (NRAS
Q61L
or NRAS
Q61K
) mutation [16].
M249-AR4, one of the in vitro derived sub-lines resis-
tant to vemurafenib , harbors mutations both in
BRAF
V600E
and NRAS
Q61K
[6]. One cell line, M257, is
wild type for both oncogenes. In agreement with prior
studies [6,16], single agent vemurafenib induced the
expected growth inhibition restricted to BRAF
V600E
mutant cell lines, while NRAS
Q61
or double wild type
cell lines were resistant (Table 1 Figure 1a). In these stu-
dies, resistance to vemurafenib was defined by a 50%
inhibitory concentrations (IC50) over 1 μM. Single
agent metformin inhibited cell proliferation in 8 out of
11 BRAF
V600E
,and3outof7NRAS
Q61
mutant cell
lines, as well as in the cell line wild type for both onco-
genes, M257 (Table 1). Resistance to metformin was
defined by IC50s over 20 mM. Of particular importance,
single agent metformin led to a markedly increased and
dose-dependent proliferation of one NRAS
Q61K
mutant
cell line, SKMEL173.
Synergistic growth inhibition by the combination of
vemurafenib and metformin in a subset of melanoma cell
lines independent of the BRAF mutational status
After evaluating the response of the differentially
mutated melanoma cells to each drug alone, both drugs
were combined in constant ratios to each other. Among
the 11 BRAF
V600E
mutant cell lines, in 5 cell lines the
combination was antagonistic and in 6 cell lines it was
synergistic (Figure 1b). In two cell lines (M249, M262)
the combination was highly synergistic. Of note, the two
cell lines with acquired resistance to vemuraf enib had
antagonistic effects from combined vemurafenib and
metformin. Among the 8 BRAF wild type cell lines , the
Niehr et al . Journal of Translational Medicine 2011, 9:76
/>Page 3 of 13
combination was synergistic in 7, with the only one with
antagonistic effects being SKMEL173, which already had
increased proliferation with single agent metformin.
However, none of the BRAF wild type cell lines dis-
played a highly synergistic growth-inhibitory response to
combined vemurafenib and metformin exposure.
The combination of vemurafenib and metformin inhibited
cell cycle progression in a larger fraction of cell lines
compared to single agent therapy
To further charac terize the effects of the c ombination,
10 cell lines were chosen for further detailed analyses of
cell signaling and proliferation (Table 2). They repre-
sented the major cell line groups based on oncogenic
events and response to the combination of vemurafenib
and metformin. E ffects on cell cycle were studied using
flow cytometry to assess changes in the G1, S a nd G2
phases of the cell cycle with either agent compared to
DMSO (Figure 2a). In agreement with our prior studie s
[16], single agent vemurafenib inhibited the cell cycle
with a G1 arrest in a BRAF
V600E
-res tricted fashion, with
an effect less pronounced in the naturally resistant
M308 cell line (Figure 2b). There was no cell cycle
arrest in the acquired resistant M249-AR4 cell line, con-
sistent with the presence of a secondary mutation in
NRAS
Q61K
[6]. Single agent metformin also induced G1
arrest in three BRAF
V600E
mutant cell lines, with no
effects on the rest. The inhibition was independent of
the sensitivity to metformin observed in proliferation
assays (Figure 2c), suggesting that metformin may have
antitumor effects independent of the cell cycle. The
combination of vemurafenib and metformin inhibited
cell cycle progression apparently by combining the
growth arrest effects of each single agent in BRAF
V600E
mutant cell lines, with an additional inhibitory effect
against the wild type M257 cell line (Figure 2d). In two
NRAS
Q61
mutant cell lines the combination induced a
G2 arrest. Of note, the effects of single agent metformin
or the combination with vemurafenib on the cell cycle
were minimal in SKMEL173, the cell line that demon-
strated enhanced proliferation with these treatments.
Induction of apoptosis by vemurafenib,
metformin or the combination
Effects on apoptotic cell death were studied by
flow cytometry using co-staining with Annexin V and
Table 1 Overview of differentially mutated melanoma cell lines tested.
Cell Line BRAF/NRAS BRAF
Gene Copies
Other Oncogenic Events IC50 for single
agent vemurafenib
IC50 for single
agent metformin
M257 Wild type 3 CDKN2A R80 12.2 μM 16.4 mM
M202 NRAS
Q61L
2 EGFR amplification, CDKN2A
-/-
>20μM 25.3 mM
M207 NRAS
Q61L
2 MITF amplification, PTEN
-/+
>20μM 25.2 mM
M244 NRAS
Q61L
NT NT 19.9 μM 22.7 mM
M296 NRAS
Q61L
NT NT 19.4 μM 9.0 mM
SKMEL173 NRAS
Q61K
NT NT > 20 μM 36.5 mM
WM1366 NRAS
Q61L
NT NT > 20 μM 8.6 mM
SBCL2 NRAS
Q61L
NT NT > 20 μM 2.9 mM
M229 BRAF
V600E
homozygous 4 MITF amplification, AKT1 amplification
PTEN
-/+
0.3 μM 13.0 mM
M233 BRAF
V600E
heterozygous 3 AKT1 amplification, CCND1 amplification
EGFR amplification, CDKN2A
-/-
, PTEN
-/-
>20μM 20.2 mM
M238 BRAF
V600E
heterozygous 2 CDKN2A
-/-
, PTEN
-/+
0.1 μM 12.5 mM
M238-AR5 BRAF
V600E
heterozygous 2 CDKN2A
-/-
, PTEN
-/+
, PDGFR1b over-expression >20μM 13.1 mM
M249 BRAF
V600E
heterozygous 3 MITF amplification, AKT2 amplification, PTEN
-/-
0.1 μM 9.2 mM
M249-AR4 BRAF
V600E
heterozygous
NRAS
Q61K
3 MITF amplification, AKT2 amplification, PTEN
-/-
>20μM 17.9 mM
M255 BRAF
V600E
heterozygous 2 AKT2 amplification, CCND1 amplification
EGFR amplification, CDKN2A
-/-
8.8 μM 17.3 mM
M262 BRAF
V600E
homozygous 2 AKT1 E17K, AKT1 amplification
EGFR amplification, CDKN2A
-/-
0.2 μM 20.5 mM
M263 BRAF
V600E
heterozygous 2 CDKN2A
-/+
19.9 μM 19.6 mM
M308 BRAF
V600E
heterozygous 3 MITF amplification
AKT2 amplification, EGFR amplification
CDKN2A-/+
17.3 μM 6.0 mM
SKMEL28 BRAF
V600E
homozygous 2 EGFR P753S, MITF amplification
CCND1 amplification, CDKN2A -/+,
PTEN -/+
1.5 μM 29.7 mM
Legend: NT: not tested.
Niehr et al . Journal of Translational Medicine 2011, 9:76
/>Page 4 of 13
Propidium Iodide (Figure 3a). As expected [16], single
agent vemurafenib induced significant levels of apoptosis
in all the BRAF
V600E
mutant cell lines that are sensitive
to this agent, with a much less effect in the resistant
ones (Figure 3b). Single agent metformin induced apop-
totic effects only in the BRAF
V600E
cell lines with strong
(M249, M308) or moderate (M257) sensitivity to single
agent metformin. In four out of six cell lines with syner-
gistic characteristics, the effect of the combination was
greater than the sum of each individual drug effect. In
the rest there was either an effect due to the sum of
each drug alone or no apoptotic effect at all. Cell lines
b)
M2 63
0
20
40
60
80
100
120
0 0.05 0.5 2. 5 5 10 20
0 0.1 1 5 10 20 40
PLX [μM] + Metformin [mM]
Percent of contro
l
PLX4032
Metformin
Combin atio n
M
30
8
0
20
40
60
80
100
120
0 0.05 0 .5 2.5 5 1 0 20
0 0.1 1 5 10 20 40
PLX [μM] + Metformin [mM]
Percent of contro
l
PL X 403 2
Metformin
Combin a tio
n
M2 0 7
0
20
40
60
80
100
120
0 0 .0 5 0.5 2.5 5 10 20
0 0.1 1 5 10 20 40
PLX [μM] + Me tf or mi n [mM]
Percent of contro
l
PLX4032
Metformin
Combin at io n
SKMEL173
0
50
100
150
200
0 0.05 0.5 2.5 5 10 20
0 0 .1 1 5 10 2 0 40
PLX [μM] + Metfor mi n [mM]
Percent of contro
l
PLX4032
Metformin
Combin at io n
a
)
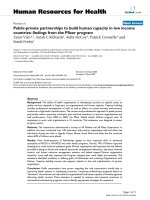
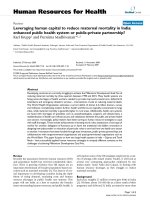
Figure 1 Effects of vemurafenib, metformin or the combination on cell p roliferation and viability. a) Example of gr owth curves of
BRAF
V600E
and NRAS
Q61
mutant melanoma cell lines. BRAF
V600E
cell lines included M263 (synergistic) and M308 (antagonistic). As representatives
for NRAS
Q61
mutants M207 (synergistic) and SKMEL173 (antagonistic) are shown. The black line represents the data obtained with vemurafenib
treatment, the blue line with metformin, and the red line with combination treatment. b) Combination index for the combination of 5 μM
vemurafenib and 10 mM metformin of all melanoma cell lines tested. The green cell lines harbor BRAF
V600E
, red shows NRAS
Q61
mutant cell
lines, and black the wild type cell line M257.
Niehr et al . Journal of Translational Medicine 2011, 9:76
/>Page 5 of 13
with antagonistic characteristics showed no effect or an
effect less than the sum of single agents. Interestingly, in
the cell line SKMEL28 (antagonistic) the combination
showed a greater apoptotic effect compared to either
single drug treatment.
Analysis of signal transduction changes with the
combination of vemurafenib and metformin
We next analyzed differential signaling pathways
blocked or induced by either drug treatment. An exam -
ple of t he complete Western blot analysis of two repre-
sentative cell lines is included in Add itional File 1 and a
time course analysis in Additional File 2. A summary of
thekeyfindingsfocusingonthe24hourtimepointin
BRAF
V600E
mutant cell lines is presented in Figure 4. At
this time point, the effects on pERK and pLKB1 were
mainly derived from single agent vemurafenib, where
sensitive BRAF
V600E
mutant cell lines had significant
decrease with either single agent or combination con-
taining vemurafenib. Single agent metformin had mini-
mal effects on p ERK or pLKB1, although in some cases
(for example M249 and M263, Figure 4 and Additional
File 1) there was a partial decrease in pERK. Of note,
the acquired resistant M249-AR4 cell line had increased
pLKB1 phosphorylation with vemurafenib, which
decreased with the combination. The effects on pAM PK
did not directly follow the effects on pLKB1 at the
24 hour time point, with the exception of SKMEL28
where the decrease in pLKB1 resulted in increase in
pAMPK, which is consistent with published data [9,10].
Conversely, the effects on pACC were mainly derived
from single agent metformin, where in most cell lines the
increases in pACC were noted concordantly with single
agent metformin and the combination with vemurafenib.
The effects on p-p70 S6K were mainly dependent on the
sensitivity of each cell line to single agent vemurafenib,
where resistant cell lines had no decreased phosphoryla-
tion. There was little contribution of metformin, which
was restricted to a further inhibition of p-p70 S6K in
M263 with both single agent and combination metfor-
min. Effects on pS6 were more variable with single agent
vemurafenib or met formin. However , there was a tre nd
towards decreased phosphorylation with the combination,
which was notable in all tested cell lines. Overall, no sin-
gle phosphorylated molecule change or combination
allowed discerning the effects of the combination to pro-
vide synergy or antagonism.
In BRAF wild type cell lines, single agent vemurafenib
or the combination tended to increase pERK as pre-
viously described [16], without clearly concordant
changes in pLKB1 (Figure 5). The m ost remarkable
effect of the combination on phosphorylated signaling
changesthatfollowedsensitivitywasthedivergent
effects on pAMPK between the antagonistic cell line
SKMEL173 and the rest of NRAS
Q61
mutant cell lines.
However, this change may be cell line-dependent, as
opposed to a marker of differential effects of the combi-
nation, since it was not apparent in the BRAF
V600E
mutant cell lines with antagonistic effects of vemurafe-
nib combined with metformin. As with the BRAF
V600E
mutant cell lines, effects on pACC followed the effects
of single agent metformin with little contribution of
vemurafenib. The change in the phosphorylation of p70
S6K and S6 did not contribute much to elucidating the
effects of this combination.
Quantitative analysis of AKT phosphorylation
Given a lack of a clear correlation between sensitivity to
the combination and signaling changes i n the MAPK
and LKB1-AMPK pathways, we used the quantitative
phospho-flow assay to better explore potentially differ-
ential effects on AKT phosphorylation that may be
Table 2 BRAF
V600E
and BRAF
WT
cell lines used for
detailed analysis.
Cell Line BRAF/
NRAS
Cell line characteristics
M249 BRAF
V600E
Single agent vemurafenib: Highly sensitive
Single agent metformin: Highly sensitive
Combination: Slight synergy
M249-AR4 BRAF
V600E
NRAS
Q61K
Single agent vemurafenib: Resistant
Single agent metformin: Intermediate sensitive
Combination: Antagonistic
M263 BRAF
V600E
Single agent vemurafenib: Resistant
Single agent metformin: Intermediate sensitive
Combination: Slight synergy
M308 BRAF
V600E
Single agent vemurafenib: Resistant
Single agent metformin: Highly sensitive
Combination: Antagonistic
SKMEL28 BRAF
V600E
Single agent vemurafenib: Intermediate
sensitive
Single agent metformin: Resistant
Combination: Antagonistic
M207 NRAS
Q61L
Single agent vemurafenib: Resistant
Single agent metformin: Resistant
Combination: Slight synergy
M296 NRAS
Q61L
Single agent vemurafenib: Resistant
Single agent metformin: Highly sensitive
Combination: Slight synergy
SKMEL173 NRAS
Q61K
Single agent vemurafenib: Resistant
Single agent metformin: Resistant
Combination: Highly antagonistic
WM1366 NRAS Single agent vemurafenib: Resistant
Single agent metformin: Highly sensitive
Combination: Slight synergy
M257 Wild type Single agent vemurafenib: Resistant
Single agent metformin: Intermediate sensitive
Combination: Slight synergy
Legend: Sensitivity to single agent vemurafenib: highly sensitive if IC50 < 1
μM; intermediate sensitive with IC50 1-10 μM; resistant if IC50 > 10 μM.
Sensitivity to single agent metformin: highly sensitive if IC50 < 10 mM;
intermediate sensitive with IC50 10-20 mM; resistant if IC50 > 20 mM.
Sensitivity to the combination of vemurafe nib and metformin: CI > 1
antagonistic; CI 1-0.3 slight synergy; CI < 0.3 strong synergy.
Niehr et al . Journal of Translational Medicine 2011, 9:76
/>Page 6 of 13
missed with Western blot analysis. Vemurafenib, met-
formin or the combination resulted in decreased phos-
phorylation of AKT in BRAF
V600E
and BRAF
WT
cell
lines (Additional File 3). Each drug and the combination
inhibited phosphorylation of AKT. The phosphorylation
of AKT was independent from the dr iver mutation
(BRAF
V600E
,NRAS
Q61
, or wild type), o r the sensitivity
to single agents or the combination. In fact, the combi-
nation of the drugs did not demonstrate differential
effects on pAKT compared to either drug alone.
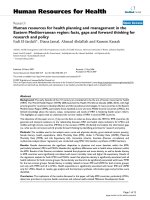
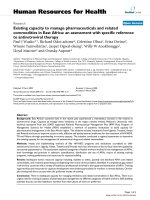
Figure 2 Effects of single agent and combination therapy on cell cycle progression. Melanoma cells were treated with 5 μM vemurafenib,
10 mM metformin, or the combination for 24 hours. Afterwards cell cycle analysis was performed using DAPI staining and analyzed by flow
cytometry. a) Cell cycle analysis of M263 treated with DMSO, vemurafenib, metformin, and the combination. b) Cell cycle changes after single
agent vemurafenib. c) Cell cycle changes after single agent metformin. d) Cell cycle changes after combination of vemurafenib and metformin.
Columns indicate a ratio of change over baseline (DMSO treatment). BRAF
V600E
mutants are presented in green, NRAS
Q61
in red, and the wild
type M257 in black.
Niehr et al . Journal of Translational Medicine 2011, 9:76
/>Page 7 of 13
b)
a
)
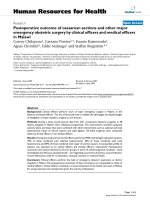
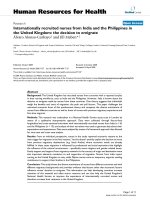
Figure 3 Effects of single agent and combination therapy on apoptosis. To test the cytotoxic effects of the different treatments, melanoma
cells were treated for 72 hours with 5 μM vemurafenib, 10 mM metformin, or the combination. Cells were stained with Annexin V and PI and
were analyzed by flow cytometry. a) Annexin/PI staining of M263 as a representative example. Upper left corner: DMSO, upper right corner:
vemurafenib, lower left corner: metformin, lower right corner: Combination of vemurafenib and metformin. b) Early and late apoptotic cells after
72-hour treatment with the indicated agents. Percentages are shown in relation to the control, DMSO treated cells.
Niehr et al . Journal of Translational Medicine 2011, 9:76
/>Page 8 of 13
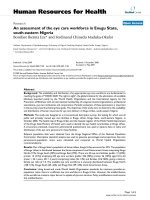
Figure 4 Western blot analysi s of different BRAF
V600E
mutant cell lines. Cells were exposed for 24 hours to 5 μM vemurafenib, 10 mM
metformin, or the combination. Phosphorylation was analyzed with antibodies against specific phosphor-proteins compared to their total
proteins. Synergistic characteristics of the cell lines are indicated as + (slight synergy), ++ (significant synergy), - (slight antagonism), and - -
(significant antagonism).
Niehr et al . Journal of Translational Medicine 2011, 9:76
/>Page 9 of 13
Similar results in low glucose and high glucose media
conditions
Standard cell culture media is suppl emented with glu-
cose at concentrations that are much higher than phy-
siological concentrations in tumors. It is possible that
the high glucose concentrations in cell culture experi-
ments would offset the effects of AMPK activation by
metformin. Therefore, we performed experiments using
low glucose media compared to standard high glucose-
containing media. Side-by-side studies in th e M263 cell
Figure 5 Western blot analysis of different BRAF
WT
cell lines. Cells were exposed for 24 hours to 5 μM vemurafenib, 10 mM metformin, or
the combination. Phosphorylation was analyzed with antibodies against specific phosphor-proteins compared to their total proteins. Synergistic
characteristics of the cell lines are indicated as + (slight synergy), ++ (significant synergy), - (slight antagonism), and - - (significant antagonism).
Niehr et al . Journal of Translational Medicine 2011, 9:76
/>Page 10 of 13
line with high or low glucose media demonstrated that
there was no change in cell proliferation in MTS assays,
cell cycle e ffects or apoptosis by flow cytometry (data
not shown). Western Blot analysis (Additional File 4a)
and pAKT (data not shown) flow cytometry were per-
formed and results compared to those observed with
high glucose conditions. Again, low glucose conditions
alone did not induce major differential effects. The only
notable difference was treatment of M263 with metfor-
min and the com bination, which resulted in an increase
of pAMPK levels in low glucose media compared to a
decrease in high glucose media. Consistent with this,
phosphorylation of ACC was elevated and pS6 inhibited.
Additional ly, similar comparison studies with the antag-
onistic SKMEL28 cell line showed that vemurafenib
treatment resulted in a slight increase in pAMPK, which
was not found in the high glucose concentrations (Addi-
tional File 4b). Overall, the effects of metformin or the
combination with vemurafenib were not significantly
different in low or high glucose media for any of these
assays.
Discussion
The description of a molecular linkage between th e
MAPK and the LKB1-AMPK pathway in BRAF
V600E
mutant cells suggested that cells with this mutation may
escape metabolic stress-induced checkpoints [10]. A cor-
ollary would be that simultaneous blocking of the driver
BRAF
V600E
oncogene, t ogether with s timulation of
AMPK, may result in synergistic antitumor activity. This
could be achieved with a combination of vemurafenib
with metformin. We had anticipated that the combina-
tion would have synergistic effects only in cell lines
that carry the BRAF
V600E
mutation. The reactivation
of AMPK brought by the inhibition of oncogenic
BRAF
V600E
with vemurafenib, together with the stimula-
tion of AMPK with metformin, m ay co-operate to
induce cell death in cells with this oncogenic driver
mutation. However, this combination also showed simi-
lar effects in some BRAF wild type cells. Synergistic
effects of the combi nation were observed in 6 out of 11
BRAF
V600E
mutants,6outof7NRAS
Q61
mutants, and
the cell line wild type for both oncogenes. This was not
dependent on the sensitivity to each drug alone. How-
ever,wefoundhighlysynergisticactivityofthecombi-
nation only in a s ubset of BRAF
V600E
mutant cell lines
and none of the BRAF wild type cells. Inter estingly, sin-
gle agent metformin treatment in the NRAS
Q61K
mutant
SKMEL173 resulted in increased proliferation, which
could not be explained by a differential effect of this
agent on AMPK or the PI3K/AKT pathway. In addition,
some of the BRAF
V600E
and NRAS
Q61
mutants displayed
antagonistic effects with the combination of vemurafenib
and metformin.
The finding of some cell lines having divergent effects,
together with the lack of predictive markers for either
effect, raises serious concerns about the potential clinical
use of metformin alone or in combination with vemura-
fenib for its hypothesized potential benefits in stimu-
lating AMPK in m elanoma cells. Of note, the two
BRAF
V600E
mutant cell lines with acquired resistance to
vemurafenib had antagonistic effects with the combina-
tion with metformin. This suggests that the addition of
metformin is unlikely to be o f benefit in patients pro-
gressing on single agent vemurafenib.
We explored changes in phospho-protein levels as
means to understand the differential effects of this com-
bination in this panel of cell lines. In our studies a
decrease of pERK after treatment with vemurafenib cor-
related well with a decrease in LKB1 phosphorylation.
Dephosphorylated LKB1 is able to phosphorylate and
activate AMPK. This correlatio n could not be seen after
24 hours, even though time-course exp eriments showed
that pAMPK leve ls changed earlier (at 4 hours). Inter-
estingly, even though pAMPK levels at 24 hours did not
correlate well, pACC levels were always incr eased when
pERK was inhibited. Therefore, effects of vemurafenib
blocking oncogenic BRAF
V600E
signaling are in ac cor-
dance with th eir predicted effects based on prior studies
[9,10]. An interesting observation is that in the
BRAF
V600E
mutant cell lines with highest sensitivity to
the combinat ion there was evidence of a pERK decrease
after exposure to metformin. Therefore, it is possible
that the synergistic effects of vemurafenib and metfor-
min in these cell lines would be due to a more signifi-
cant blockade of oncogenic MAPK signaling. However,
thefactthatsingleagentvemurafenib results in appar-
ently complete inhibition of p ERK by Western Blot in
cell lines sensitive to this agent makes it difficult to ana-
lyze if the addition of metformin has an even stronger
pERK inhibiting effect. The observation of strong corre-
lation between pERK and pACC increase suggests that
some of the effects of the co mbination may be related
to modulation of lipogenesis [19].
The exact mecha nism by which metformin activates
AMPK, and if AMPK is the primary therapeutic target
of metformin, is a matter of debate. One issue that
comes up is the relatively high concentrations of the
drug (1-20 mM) that are required for AMPK activation
in cultured cells. Estimated concentrations in human
plasma after a standard therapeutic dose of around
30 mg/kg range from 10-40 μM. An explanation for this
could be the low level or lack of expression of the trans-
porter OCT1 in many cultured cell lines [21]. Other
metabolic regulators such as resveratrol, berberine and
thiazolidinediones also inhibit mitochondrial ATP pro-
duction and thus activate AMPK indirectly, although
thesedonotrequireOCT1.Surprisingly, single agent
Niehr et al . Journal of Translational Medicine 2011, 9:76
/>Page 11 of 13
metformin inhibited phosphorylation of ERK in some
BRAF
V600E
and NRAS
Q61
mutant melanoma cell lines. A
time course experiment with M263 sho wed that this
decrease was observed 8 hours after treatment. Since
the metformin-induced increase in pACC was noted
earlier, it suggests that the inhibitory effect of metformin
on the MAPK pathway may be mediated by a feedback
mechanism. Interestingly, pACC was elevated in all cell
lines, indicating that AMPK activity must have been
increased by metformin, since AMPK is responsible for
ACC phosphorylation. ACC phosphorylation was depen-
dent on the sensitivity to the drug, with those sensitive
showing the strongest increase in pACC. Of note,
research by Guo et al. [19] with AICAR showed that the
anti-growth properties of this AMPK activator are not
fully mediated through inhibition of mTORC1 signaling,
but rather through inhibition of cholesterol and fatty
acid synthesis by inhibition of ACC and HMG-CoA.
Conclusions
Our studies provide evidence that the combination of an
inhibitor of the MAPK pathway with an AMPK activator
has synergistic antitumor effects in some BRAF
V600E
and
BRAF
WT
cell lines, including NRAS
Q61
mutants. How-
ever, the differential effects of this combination could
not be attributed to known oncogenic mutations nor
differential modulation of MAPK, PI3K/AKT or LKB1-
AMPK signaling p athways. In particular, the combina-
tion did not reverse natural or acquired resistance to
vemurafenib in BRAF
V600E
mutant cell lines, and the
effects on BRAF
WT
cell lines could not be explained by
a unified effect on the signaling pathways studied by us.
Given the observation of metformin paradoxically stimu-
lating the growth of one cell line in our panel, and the
antagonistic effects of the combination of metformin
and vemurafenib in several cell lines, the combination of
vemurafenib and metformin should not be considered
clinically until a more detailed understanding of their
differential effects is generated.
Additional material
Additional file 1: Western blot analysis of two cell lines with
synergy with the combination. To analyze the phospho-protein
signaling events triggered by exposure to vemurafenib and metformin,
cell lines were treated with DMSO, vemurafenib (5 μM), and metformin
(10 mM), either singly or in combination, for 24 hours. Protein
phosphorylation was examined by Western Blot analysis and phospho-
specific flow cytometry. Blotting for total proteins and b-actin was used
as a loading control. Phosphorylation was analyzed with antibodies
against pRAF, pMEK, pERK, pLKB1, pAMPKa, pACC, pS6K, pS6, and their
total proteins. a) BRAF
V600E
mutant cell line M263; b) NRAS
Q61L
mutant
cell line M207.
Additional file 2: Time course analysis of signaling in two
BRAFV600E mutant cell lines with different response to the
combination. Cells were treated for 2, 4, and 24 hours with 5 μM
vemurafenib, 10 mM metformin, or the combination. a) M263, in which
the combination showed slight synergistic effects in proliferation assays;
b) SKMEL28, in which the combination had slight antagonistic effects in
proliferation assays.
Additional file 3: Phospho-specific flow cytometry for p-Akt Thr308.
Cells were treated with vemurafenib (5 μM), metformin (10 mM) or the
combination for 24 hours, and intracellularly stained with a pAKT Thr308
antibody. Percentages shown are in relation to DMSO controls and were
analyzed by flow cytometry.
Additional file 4: Time-course Western blot analysis of the
BRAF
V600E
mutant cell lines M263 (top) and SKMEL28 (bottom) in
low glucose media. For these studies, the BRAF
V600E
mutant cell lines
M263, resistant to vemurafenib and sensitive to metformin, and SKMEL28,
resistant to vemurafenib and metformin, were treated with agents
dissolved in low glucose media (1000 mg/L) instead of normal RPMI
(3000 mg/L) and analyzed at 4, 8 or 24 hours.
Abbreviations
acetyl CoA carboxylase (ACC); AMP-activated protein kinase (AMPK); cancer
Osaka thyroid (COT); combination index (CI); dimethyl sulfoxide (DMSO); 50%
inhibitory concentrations (IC50); insulin-like growth factor-1 receptor (IGF1R);
liver kinase B1 (LKB1); materials transfer agreement (MTA); tetrazolium
compound [3-(4,5-dimethylthiazol-2-yl)-5-(3-carboxymethoxyphenyl)-2-(4-
sulfophenyl)-2H-tetrazolium (MTS); organic cation transporter-1 (OCT1);
phosphorylated Erk (pErk); platelet-derived growth factor receptor beta
(PDGFRβ); receptor tyrosine kinases (RTKs)
Acknowledgements
This work was funded by The Seaver Institute, the Melanoma Research
Alliance, The Fred L. Hartley Family Foundation, the Louise Belley and Richard
Schnarr Fund, and the Caltech-UCLA Joint Center for Translational Medicine.
Author details
1
Department of Medicine, Division of Hematology/Oncology, University of
California Los Angeles (UCLA), Los Angeles, CA, USA.
2
Department of
Pathology and Laboratory Medicine, UCLA, Los Angeles, CA, USA.
3
Jonsson
Comprehensive Cancer Center at UCLA, Los Angeles, CA, USA.
4
Vall
d’Hebron Research Institute, Barcelona, Spain.
5
Department of Medicine,
Division of Dermatology, UCLA, Los Angeles, CA, USA.
6
Department of
Surgery, Division of Surgical Oncology, UCLA, Los Angeles, CA, USA.
Authors’ contributions
FN, BC-A and AR planned the research. FN performed the majority of the
experiments. She received help from EvE, NA and DG on the performance of
Western Blot analysis, from DG on the use of metformin, from DM, HS and
CN for the care of melanoma cell lines and cell viability studies and from
BC-A for the optimization and conduct of cell viability, cell cycle, apoptosis
and phosphoflow studies: JAG, JAR, RSL and PSM helped focus the research
plan and discussed the proposed experiments, as well as provided
interpretation of the emerging results and the studies that should follow. FN
and AR wrote the manuscript, with significant contributions and edits from
JAR, RSL and PSM. All authors read and approved the final manuscript.
Competing interests
Antoni Ribas has received honoraria from Roche-Genentech, the maker of
vemurafenib.
Received: 14 February 2011 Accepted: 24 May 2011
Published: 24 May 2011
References
1. Padua RA, Barrass N, Currie GA: A novel transforming gene in a human
malignant melanoma cell line. Nature 1984, 311:671-673.
2. Davies H, Bignell GR, Cox C, Stephens P, Edkins S, Clegg S, Teague J,
Woffendin H, Garnett MJ, Bottomley W, et al: Mutations of the BRAF gene
in human cancer. Nature 2002, 417:949-954.
3. Gray-Schopfer V, Wellbrock C, Marais R: Melanoma biology and new
targeted therapy. Nature 2007, 445:851-857.
Niehr et al . Journal of Translational Medicine 2011, 9:76
/>Page 12 of 13
4. Flaherty KT, Puzanov I, Kim KB, Ribas A, McArthur GA, Sosman JA,
O’Dwyer PJ, Lee RJ, Grippo JF, Nolop K, Chapman PB: Inhibition of
mutated, activated BRAF in metastatic melanoma. N Engl J Med 2010,
363:809-819.
5. Kefford R, Arkenau H, Brown MP, Millward M, Infante JR, Long GV,
Ouellet D, Curtis M, Lebowitz PF, Falchokk GS: Phase I/II study of
GSK2118436, a selective inhibitor of oncogenic mutant BRAF kinase, in
patients with metastatic melanoma and other solid tumors. Proc
American Society of Clinical Oncology 2010, 28:611s.
6. Nazarian R, Shi H, Wang Q, Kong X, Koya RC, Lee H, Chen Z, Lee MK,
Attar N, Sazegar H, et al: Melanomas acquire resistance to B-RAF(V600E)
inhibition by RTK or N-RAS upregulation. Nature 2010, 468:973-977.
7. Johannessen CM, Boehm JS, Kim SY, Thomas SR, Wardwell L, Johnson LA,
Emery CM, Stransky N, Cogdill AP, Barretina J, et al: COT drives resistance
to RAF inhibition through MAP kinase pathway reactivation. Nature 2010,
16;468(7326):968-72.
8. Villanueva J, Vultur A, Lee JT, Somasundaram R, Fukunaga-Kalabis M,
Cipolla AK, Wubbenhorst B, Xu X, Gimotty PA, Kee D, et al: Acquired
resistance to BRAF inhibitors mediated by a RAF kinase switch in
melanoma can be overcome by cotargeting MEK and IGF-1R/PI3K.
Cancer Cell 2010, 18:683-695.
9. Esteve-Puig R, Canals F, Colome N, Merlino G, Recio JA: Uncoupling of the
LKB1-AMPKalpha energy sensor pathway by growth factors and
oncogenic BRAF. PLoS One 2009, 4:e4771.
10. Zheng B, Jeong JH, Asara JM, Yuan YY, Granter SR, Chin L, Cantley LC:
Oncogenic B-RAF negatively regulates the tumor suppressor LKB1 to
promote melanoma cell proliferation. Mol Cell 2009, 33:237-247.
11. Fogarty S, Hardie DG: Development of protein kinase activators: AMPK as
a target in metabolic disorders and cancer. Biochim Biophys Acta 2010,
1804:581-591.
12. Corton JM, Gillespie JG, Hawley SA, Hardie DG: 5-aminoimidazole-4-
carboxamide ribonucleoside. A specific method for activating AMP-
activated protein kinase in intact cells? Eur J Biochem 1995, 229:558-565.
13. Merrill GF, Kurth EJ, Hardie DG, Winder WW: AICA riboside increases AMP-
activated protein kinase, fatty acid oxidation, and glucose uptake in rat
muscle. Am J Physiol 1997, 273:E1107-1112.
14. Woodard J, Platanias LC: AMP-activated kinase (AMPK)-generated signals
in malignant melanoma cell growth and survival. Biochemical and
biophysical research communications 2010, 398:135-139.
15. Shaw RJ, Lamia KA, Vasquez D, Koo SH, Bardeesy N, Depinho RA,
Montminy M, Cantley LC: The kinase LKB1 mediates glucose homeostasis
in liver and therapeutic effects of metformin. Science 2005,
310:1642-1646.
16. Sondergaard JN, Nazarian R, Wang Q, Guo D, Hsueh T, Mok S, Sazegar H,
Macconaill LE, Barretina JG, Kehoe SM, et al
: Differential sensitivity of
melanoma cell lines with BRAFV600E mutation to the specific raf
inhibitor PLX4032. J Transl Med 2010, 8:39.
17. Ben Sahra I, Laurent K, Loubat A, Giorgetti-Peraldi S, Colosetti P, Auberger P,
Tanti JF, Le Marchand-Brustel Y, Bost F: The antidiabetic drug metformin
exerts an antitumoral effect in vitro and in vivo through a decrease of
cyclin D1 level. Oncogene 2008, 27:3576-3586.
18. Comin-Anduix B, Sazegar H, Chodon T, Matsunaga D, Jalil J, von Euw E,
Escuin-Ordinas H, Balderas R, Chmielowski B, Gomez-Navarro J, et al:
Modulation of cell signaling networks after CTLA4 blockade in patients
with metastatic melanoma. PLoS One 2010, 5:e12711.
19. Guo D, Hildebrandt IJ, Prins RM, Soto H, Mazzotta MM, Dang J, Czernin J,
Shyy JY, Watson AD, Phelps M, et al: The AMPK agonist AICAR inhibits the
growth of EGFRvIII-expressing glioblastomas by inhibiting lipogenesis.
Proc Natl Acad Sci USA 2009, 106:12932-12937.
20. Chou TC, Talalay P: Quantitative analysis of dose-effect relationships: the
combined effects of multiple drugs or enzyme inhibitors. Adv Enzyme
Regul 1984, 22:27-55.
21. Wang W, Guan KL: AMP-activated protein kinase and cancer. Acta Physiol
(Oxf) 2009, 196:55-63.
doi:10.1186/1479-5876-9-76
Cite this article as: Niehr et al.: Combination therapy with vemurafenib
(PLX4032/RG7204) and metformin in melanoma cell lines with distinct
driver mutations. Journal of Translational Medicine 2011 9:76.
Submit your next manuscript to BioMed Central
and take full advantage of:
• Convenient online submission
• Thorough peer review
• No space constraints or color figure charges
• Immediate publication on acceptance
• Inclusion in PubMed, CAS, Scopus and Google Scholar
• Research which is freely available for redistribution
Submit your manuscript at
www.biomedcentral.com/submit
Niehr et al . Journal of Translational Medicine 2011, 9:76
/>Page 13 of 13