Báo cáo sinh học: "The impact of Metastasis Suppressor-1, MTSS1, on oesophageal squamous cell carcinoma and its clinical significance" doc
Bạn đang xem bản rút gọn của tài liệu. Xem và tải ngay bản đầy đủ của tài liệu tại đây (1.74 MB, 10 trang )
RESEARCH Open Access
The impact of Metastasis Suppressor-1, MTSS1,
on oesophageal squamous cell carcinoma and its
clinical significance
Fei Xie
1,2
, Lin Ye
1
, Jinfeng Chen
2
, Nan Wu
2
, Zhiqian Zhang
2
, Yue Yang
2
, Lijian Zhang
2*
and Wen G Jiang
1*
Abstract
Background: Metastasis suppressor-1 (MTSS1) has been proposed to function as a cytoskeletal protein with a role
in cancer metastasis. Recent studies have demonstrated the clinical significance of MTSS1 in certain type of
cancers, yet the clinical relevance of MTSS1 in oesophageal squamous cell carcinoma (ESCC) has not been
reported.
Methods: In this study, we assessed the expression levels of MTSS1 in tumours and its matched adjacent non-
tumour tissues obtained from 105 ESCC patients. We also used ESCC cells with differing MTSS1 expression and
assessed the influence of MTSS1 on ESCC cells.
Results: Down-regulation of MTSS1 expression was observed both in oeso phageal tumour tissues and ESCC cancer
cell lines. We also reported that MTSS1 expression was associated with tumour grade (p = 0.024), lymph node
metastasis (p = 0.010) and overall survival (p = 0.035). Patients with high levels of MTSS1 transcripts had a favorable
prognosis in comparison with those who had reduced or absent expression levels. Using over-expression and
knockdown approach, we created sublines from ESCC cells and further demonstrated that MTSS1 expression in
ESCC cells significantly influenced the aggressiveness of the oesophageal cancer cells, by reducing their cellular
migration and in vitro invasiveness.
Conclusion: MTSS1 serves as a potential prognostic indicator in human ESCC and may be an important target for
cancer therapy.
Keywords: metastasis suppressor-1, MTSS1, MIM, oesophageal squamous cell carcinoma, metastasis
Background
Tumour metastasis is the most significant contributor to
the mortality of patients with cancers. Metastasis of can-
cer cells proceeds via a long series of sequential, interre-
lated steps modulated largely by activators and
suppressors of metastasis. Metastasis suppressor genes
are defined by their ability to inhibit metastasis at any
step of the metastatic cascade. To date, only a limited
number of metastasis suppressor genes, including
NM23, KAI1, KiSS1, MKK4, BRMS1, RHOGDI2, CRSP3
and VDUP1, have been identified [1]. These metastasis
suppressor genes inhibit metastasis of a cancer cell line
in vivo without blocking its tumourigenicity.
MTSS1 (metastasis suppressor-1), also known as MIM
(Miss ing-In-Metastasis) , MIM-B, BEG4 (Basal cell carci-
noma-enriched gene 4) or KIAA0429, was first identified
as a potential metastasis suppressor gene missing in
metastatic bladder carcino ma cell lines [2] and subse-
quently investigated in some types of cancer. In prostate
cancer and breast cancer, expression of MTSS1 has
been shown to be reduced, whereas up-regulation of
MTSS1 expression has also been observed in hepatocel-
lular carcinoma [3]. MTSS1 may exert its metastasis
suppressor functions by acting as a scaffold protein that
interacts with actin-associated proteins to regulate
lamellipodia formation [4-6]. Biochemical study revealed
* Correspondence: ;
1
Metastasis and Angiogenesis Research Group, Cardiff University School of
Medicine, Cardiff, CF14 4XN, UK
2
Key Laboratory of Carcinogenesis and Translational Research (Ministry of
Education), Department of Thoracic Surgery, Peking University School of
Oncology and Beijing Cancer Hospital, Beijing, 100142, China
Full list of author information is available at the end of the article
Xie et al . Journal of Translational Medicine 2011, 9:95
/>© 2011 Xie et al; licensee BioMed Central Ltd. This is an Open Access article distributed under the terms of the Creative Commons
Attribution License ( which permits unrestricted use, distribution, and reproduction in
any medium, provided the original work is properly cited.
that MTSS1 binds monomeric actin through its C-term-
inal WH2 domain for polymerization and deforms phos-
phoinositide-rich membranes through its N-terminal I-
BAR domain [6,7]. MTSS1 has also been identified as a
sonic hedgehog inducible protein that potentiates Gli
transcription in the developing hair follicle and basal
cell carcinomas of the skin [8]. To date, the role and
biochemical mechanisms for MTSS1 in tumourigenesis
and metastasis remain largely unknown. This is due
partly to t he fact th at the s tudies of MTSS1 have been
restricted to a limited number of cancer types, with little
support from the clinical aspect.
Until now, there has been no research reporting the
role of MTSS1 in oesophageal squamous cell carcinom a
(ESCC). Here, we sought to determine MTSS1 expres-
sion in oesophageal cancer patient specimens and evalu-
ate the clinical implications of MTSS1 expression in
oesophageal squamous cell carcinoma. We also provide
new insights into the biological functions of MTSS1 and
its role in oesophageal squamous cell carcinoma.
Material and methods
Cell lines and human oesophageal specimens
This study used three human oesophageal squamous cell
carcinoma cell lines and a n oesophageal adenocarci-
noma cell line. Moderate-differentiated cell lines OE19
(oesophageal adenocarcinoma cell line) and OE21 w ere
obtained fro m the European Collection for Animal Cell
Culture (ECACC, Porton Down, Salisbury, UK). The
other two oesophageal cancer cell lines KYSE150
(poorly-differentiated) and KYSE510 (well-differentiated)
were gifted from D r. Zhiqian Zhang (Beijing Institute
for Cancer Research). Cells were routinely cultured with
Dulbecco’ s modified Eagle medium (DMEM) supple-
mented with 10% foetal calf serum, penicillin and strep-
tomycin (Gibco BRC, Paisley, Scotland, UK).
Fresh frozen oesophageal squamous cell carcinoma tis-
sues (n = 105), along with matched normal tissue from
the same patients, were obtained from patients who
attended Beijing Cancer H ospital from January 2003 to
December 2009. Ethical approval was provided by the
Beijing Cancer Hospital Ethics Committee. None of the
patients received any neoadjuvant therapy prior to sur-
gery. Histological types of the oesophageal squamous
cell carcinoma patients are given in table 1. These tis-
sues were collected immediately after surgical resection
at the Beijing Cancer Hospital and were stored in the
Tissue Bank of Peking University Oncology School.
Clinico-pathologic factors, including age, sex, histologi-
cal types of tumours, TNM stage, and lymph node
metastasis were recorded and stored in the patients’
database. Patients were followed up from the day o f
operation to December 2009 as the end of the follow-up
for the present study. The follow-up intervals were cal-
culated as survival intervals after surgery.
RNA isolation and reverse transcription polymerase chain
reaction
Total RNA was isolated from the homogenized oesopha-
geal tissues and cell lines using Total RNA Isolation
Reagent (ABgene™). Reverse transcription was done
using the Reverse Transcription kit (Primer design), fol-
lowed by PCR using a REDTaq™ ReadyMix PCR reac-
tion mix (Sigma-Aldrich, Inc.). RNA concentration was
determined through spectrophotometric measurement
(WPA UV 1101, Biotech Photometer, Cambridge, UK).
1 μg RNA was used to generate cDNA with a RT kit
(AbGene Laboratories, Essex, England). The quality of
DNA was verified using GAPDH primers (sense: 5’ -
ATGATATCGCCGCGCTCGTC-3’ ;antisense:5’ -
CGCTCGGTGAGGATCTTCA-3’ ). MTSS1 mRNA
levels were assessed using MTSS1 primers (sense: 5’ -
TCAAGAACAGATGGAAGAATGG-3’ ;Antisense:5’-
TGCGGTAGCGGTAATGTG-3’,exon5-10).PCRwas
performed in a GeneAmp PCR system 2400 thermocy-
cler (Perkin-Elmer, Norwalk CT, USA). Cycling condi-
tions for the 16-μl-reaction mixture were 30s at 94°C
for denaturation, 30s at 55°C for annealing and 30s at
72°C for elongati on (30 cy cles). This was followed by a
final 10 min extension period at 72°C. PCR products
were then separated o n a 2% agarose gel. The gel was
then visualized under ultraviolet light following ethidium
bromide staining.
Table 1 Clinical data of the patients with oesophageal
squamous cell carcinoma.
Clinical data Grouping Sample number
Tissue Sample Tumour 105
Normal 105
Gender Male 87
Female 18
Age > 55 64
≤ 55 41
T status 1 1
225
356
419
N status 0 48
1/2 53
M status 0 99
12
WHO grade 1 7
246
341
47
Xie et al . Journal of Translational Medicine 2011, 9:95
/>Page 2 of 10
Quantitative real time PCR
Real time quantitative PCR (QPCR) was performed on
the Icycler IQ5 system (Bio-Rad, Hammel Hemstead,
UK) to quantify the level of MTSS1 transcripts in the
oesophageal squamous cell carcinoma specimens (shown
as copies/μl from internal standard). Oesophageal cDNA
samples were then examined for MTSS1 transcript
expression, along with a set of standards and negative
controls [9]. The QPCR technique utilized the Ampli-
fluor system™ (Intergen Inc., England) [10] and QPCR
master mix (BioRad). Pairs of primers as follow were
designed using Beacon Design software (PREMIER Bio-
soft, Palo Alto, CA): MTSS1 QPCR primers as follow:
sense: 5’-ATATCCCAGGATGCCTTC-3’;antisense:5’ -
ACTGAACCTGACCGTACACGGTTCTCGCTTCTC
TTT-3’ , exon 10-12). The underlined sequence in the
reverse primers was the additional Z sequence, which is
complementary to the universal Z probe (TCS Bio logi-
cals Ltd., Oxford, UK). Real-time QPCR conditions were
95°Cfor15min,followedby60cyclesat95°Cfor20s,
55°C for 30 s and 72°C for 20 s. QP CR for GAPDH was
also performed on the same samples to n ormalize for
any residual differences in the initial level of RNA in the
specimens, using a GAPDH quantitation kit from Per-
kin-Elmers (Perkin-Elmer, Surrey, England, UK).
Immunohistochemical staining of MTSS1
Paraffin sections of oesophageal squamous cell carci-
noma tumours (n = 35) and matched background tis-
sues (n = 35) were cut at a thickness of 6 μm. The
sections were first dewaxed using a series of zylene
and ethanol washes. Endogenous peroxidase activity
was blocked with 0.3% hydrogen peroxide for 15 min.
For antigen retrieval, sections were boiled in 10 mM
citrate buffer (pH 6.0) for 10 min. The sections were
then immersed in ‘Optimax’ wash buffer for 10 min to
rehydrate and incubated for 20 min in a horse serum
blocking solution before probing with the MTSS1 anti-
body (1:80) (Abnova, Caltag-Med-systems Ltd., B uck-
ingham, UK) and also without primary antibody as a
negative control. Following extensive washing, sections
were incubated for 30 min with the secondary biotiny-
lated antibody (Multi link swine anti-goat/mouse/rabbit
immunoglobulin, Dako Inc. Carpinteria, CA). Avidin-
biotin complex (Vector Laboratories) was then applied
to the sections followed by extensive washing. Diamino
benzidine chromogen (Vector Laboratoriess) was then
added to the sec tions and incubated in the dark for 5
min. Sections were then counterstained in Gill’shae-
matoxylin and dehydrated in ascending grades of
methanol before clearing in xylene and mounting
under a cover slip. Staining was independently assessed
by the authors.
Construction of MTSS1 Expressing and Ribozyme
Transgenes, and Transfection
The full sequence of MTSS 1 was amplified from PLC/
PRF-5 cDNA, using the standard PCR procedure
described above and a master mix with proof reading
enzyme, we previously reported [11,12]. The following
primers which allowed amplification of the full length
human MTSS1 (exon 1-14) were used: sense primers:
5’-ATGGAGGCTGTGATTGAG-3’; antisense: 5’-CTAA-
GAAAAGCGAGGGG-3’ . Correctly amplified product
was then cloned into pEF6/V5-His-TOPO vector (Invi-
trogen, Paisley, UK). Multiple c lones of E. coli were
screened and plasmids from the clones were sequenced.
Detailed procedure was adapted from the reports
described previously [12]. Purified plasmids were then
electroporated into the KYSE150 oesophageal cancer
cell line. Blasticidin (5 μg/ml final concentration) was
used to select stably transfected strains. The KYSE150
cell s stably expressing MTSS1 were termed in the study
as KYSE150-MTSS1-Exp. The control group of cells
contained the same plasmid vector (minus the MTSS1
sequence) and was termed KYSE150-PEF-control.
Anti-MTSS1 ribozyme tra nsgenes were employed to
knockdown the expression of MTSS1 in the KYSE510
oesophageal cancer cell line, and were generated using
the methods previously described [12] . Briefly, the anti-
MTSS1 hammerhead ribozyme targeting was designed
based on the secondary structure generated using
Zuker’s RNA mFold program. Then the ribozymes that
specifically target MTSS1 were generated using touch-
down PCR with the appropriate primers (sense: 5’ -
CTGCAGAGGCTTTTTAGATCTTCCGACTGATGA
GTCCGTGAGGA-3’; antisense: 5’-ACTAGTTAACCCA
CCTTCAGACCATTTCGTCCTCACGGACT -3’ ). Cor-
rectly amplified inserts w ere purified a nd cloned into
the pEF6/V5-His-TOPO vector, before transfecting the
KYSE510 oesophageal cancer cell line by way of electro-
poration. The same procedure as described above was
employed to select stably transfected strains. KYSE510
cells with MTSS1 eliminated and the control group of
cells contained the same plasmid vector were termed
KYSE510-MTSS1- Rib and KYSE 510-PEF-control
respectively.
Western blotting
To detect the expression level of MTSS1 in the oeso-
phageal cancer cell lines, confluent cells were pelleted
and then lysed using a lysis buffer co ntaining 2.4 mg/ml
Tris, 4.4 mg/ml NaCl, 5 mg/ml sodium deoxycholate, 20
μg/ml sodium azide, 1.5% Triton, 100 μg/ml PMSF, 1
μg/ml leupeptin, and 1 μg/ml aprotinin, for 45 min at 4°
C. After lysis and centrifugation at 13,000 rpm for 15
min, protein concentrations for each sample were
Xie et al . Journal of Translational Medicine 2011, 9:95
/>Page 3 of 10
measured using an improved Lowary assay (DC Protein
Assay kit, Bio-Rad). The samples were adjusted to equal
concentrations with sample buffer and the n boiled at
100°C for 5 min, before separated on a 10% polyacryla-
mide gel. Following electrophoresis, these separated pro-
teins were blotted onto nitrocellulose sheets and
blocked in 10% skimmed milk (w/v in TBS) for 1 hour.
The membranes were then probed with the anti-
MTSS1-antibody (Abnova, Caltag-Med-systems Ltd.,
Buckingham, UK) and anti-actin-antibody (Santa-Cruz
Biotechnologies, California, USA) as internal control,
followed by a peroxidase-conjugated secondary antibody
(1:1,000). Protein bands were visualised using an ECL
system (Amersham, U K), and photographed using a
UVITech imager (UVITech, Inc.).
In vitro cell growth assay
Cells were plated into 96-well plated at 2,000 cells/well
after a period of incubation. Cells were fixed in 10% for-
maldehyde after 1, 3 and 5 days. 0.5% crystal violet (w/
v) was used to stain cells. Following washing, the stained
crystal violet was dissolved with 10% (v/v) acetic acid
and the absorbance was determined at a wavelength of
540 nm using a spectrophotometer (Bio-Tek, ELx800).
Cell matrix adhesion assay
The cell matrix adhesion assay was done as previously
described [13]. 96-well plate was precoated with 5 μgof
Matrigel and allowed to dry. Following rehydration,
30,000 cells were added to each well. After 40 min of
incubation non-adherent cells were washed off using
BSS buffer. The remaining cells were fixed with 4% for-
malin and stained with 0.5% crystal violet. The number
of adherent cells was then counted under microscopy.
Wounding/migration assay
The wounding assay was performed as previously
described [14]. The cells were seeded at a density of
40,000 per well into a 24-well plate and allowed to
reach confluence. The monolayer of cells was then
scraped with a fine gauge needle to create a wound of
approximately 200 μm. The movement o f cells to close
the wound was recorded as described previously using a
time-lapsed video system. Images were captured from
the videotape at the equivalent of 15 min intervals in
real-time and stored as a series of gray scale bitmap
images. The movement of single cells within a colony
was analyzed by tracking each cells boundary, for each
frame in a series, using the Optimas 6.0 motion analysis
(Meyer Instruments, Houston, Texas).
In vitro invasion assay
Transwell inserts (upper chamber) with 8 μmporesize
were coated with 50 μg of Matrigel (Collaborative
Research Products, Bedford, Massachusetts, USA) and
air-dried. Following rehydration, cells were seeded at a
density of 30,000 per insert and allowed to invade for 3
days. After incuba tion, cells that had migrated through
the matrix and adhered to the other side of the insert
were fixed in 4% formalin, stained with 0.5% (weight/
volume) crystal violet, and counted under a microscope.
2.11 Statistical analysis
Statistical analysis was performed u sing SPSS software
(SPSS Standard version 13.0, SPSS Inc.). The relation-
ship between MTSS1 expression and t umour grade,
TNM staging and nodal status was assessed by Mann-
Whitney U test. The error bar shown in the graph
represents the SEMs. Survival curve was analyzed using
Kaplan-Meier survival analysis. Multivariate analysis of
the impact o f the fa ctors, including gender, age, grade,
TNM, nodal status and MTSS1 expression levels, were
conducted using the Cox regression model. Differences
were considered statistically significant at p < 0.05.
Results
Quantitative PCR analysis of the expression pattern of
MTSS1 in oesophageal squamous cell carcinoma tissues
MTSS1 mRNA expression in oesophageal squamous cell
carcinoma tissues
MTSS1 transcript expression was examined in th e oeso-
phageal specimens of 105 oesophageal squamous cell
carcinoma patients using real-time quantitative PCR
(expressed as mean MTSS1 transcript copies/μlofRNA
from 50 ng total RNA and standardized with GAPDH).
The cohort comprised 87 men (82.86%) and 18 women
(17.14%). The average age of all patients was 58.75
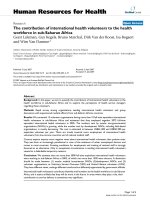
years. Lower mRNA expression level of MTSS1 was
observed in tumour tissues (27.42 ± 7.32) when com-
pared to t he normal background tissues (57.38 ± 13.61),
although the difference was only marginally statistically
significant (p = 0.054)(Figure 1A).
MTSS1 expression correlates with tumour grade or TNM
staging
The relation of MTSS1 expression against pathological
status was also assessed in the present study throug h
quantitative analysis of MTSS1 transcript. Since the
tumour grade and TNM staging information of 4 cases
in the cohort was missing, the tissues used for t he ana-
lysis of tumour grade, T status, N status were 101.
MTSS1 levels were first assessed in relation to oeso pha-
geal tumour grade (grade 1 , n = 6; grade 2, n = 46;
grade 3, n = 41; grade 4, n = 7). Tumour grade (well or
moderat ely differentiated (grade 1/2) vs. poorly differen-
tiated or undifferentiated (grade 3/4)) outcomes are
shown in Figure 1B. Grade 3/4 tumours (13.82 ± 5.13)
had significant reduced levels of MTSS1 compared to
grade 1/2 tumours (48.19 ± 16.07) (p = 0.024).
Xie et al . Journal of Translational Medicine 2011, 9:95
/>Page 4 of 10
The relationship between MTSS1 expression and clini-
cal TNM staging was also analyzed. Patient TNM
grouping revealed that TNM 3/4 pa tients had lower
expression levels of MTSS1 (20.99 ± 6.23) in compari-
son with the TNM 1/ 2 group (49. 97 ± 23.24). However,
statistical analysis show no significant difference (p =
0.095, Figure 1C).
MTSS1 expression in relation to nodal status
As lymph node metastasis is one of the most impor-
tant prognostic factors, we next explored possible cor-
relations between MTSS1 expression levels and lymph
node metastasis. The patients were divided into two
groups based on the nodal status: the first group
included N0 patients and the second group N1/N2
Figure 1 Quantitative PCR analysis of MTSS1 expression in human oesophageal tissues. (A) Tumour versus normal background tissues; (B)
Tumour grade; (C) Tumour-node-metastasis classification; (D) Node status; (E) A two-way division of the patients based on the expression levels
of MTSS1 yield a significant correlation with overall survival; (F) A three-way division of the patients based on the expression levels of MTSS1
yield a significant correlation with overall survival; (G) Overall survival analysis in node negative patients; (H) Overall survival analysis in node
positive patient.
Xie et al . Journal of Translational Medicine 2011, 9:95
/>Page 5 of 10
patients. We found a significant correlation between
MTSS1 expression level a nd nodal status (p = 0.010).
Quantitative studies showed that MTSS1 expression
levels in node positive patients were significantly lower
(10.06 ± 2.65) than those without metastases (48.76 ±
15.27) (Figure 1D).
Correlation between MTSS1 expression and oesophageal
squamous cell carcinoma patient survival
Of the 105 oesophageal squamous cell carcinoma
patients, none was lost to follow-up. The median obser-
vation period was 20 months (0-86 months). Kaplan-
Meier analysis demonstrated that patients with high
levels of MTSS1 expression in their tumours showed a
longer overa ll surv ival time (30.00 ± 3.70 months), com-
pared with lower expression levels group (18.00 ± 2.78
months) (p = 0.035, Figure 1E). We further characterize
the patients into three groups according to MTSS1
expression levels: high, moderate or low levels. Most
remarkably, patients with high MTSS1 levels had the
longest survival time (47.70 ± 6.32 months), compared
with those with moderate (38.22 ± 5.41 months) or low
MTSS1 levels (24.64 ± 3.61 months) (p = 0.015, Figure
1F). In stratified survival analysis according to the node
status, node negative patients with high MTSS1 levels
had a significan t longer survival (53.41 ± 6.82 months) in
comparison with low levels group (34.51 ± 4.79 months)
(p = 0.045, Figure 1G). In the node positive patients, no
significant association was found between MTSS1
expression and survival (p > 0.05, Figure 1H). Finally,
multivariate analysis using gender, age, grade, TNM,
nodal status and MTSS1 expression levels as variants has
shown that nodal status (p = 0.015), TNM (p = 0.006),
grade (p = 0.026), age (p = 0.020) and MTSS1 (p = 0.037)
are independent factors for the overall survival.
Immunohistochemical staining of human oesophageal
specimens
To assess the expression pattern of MTSS1 at the pro-
tein le vel, we performed immunohistochemical analysis
of MTSS1 in the human oesophageal squamous cell car-
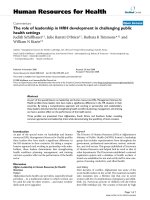
cinoma tissue sections (n = 35 pairs). Using a specific
anti-MTSS1 monoclonal antibody, MTSS 1 was detected
both in the cytoplasm and nuclei of non-tumour cells
(Figure 2-left panels). Upon the analysis of oesophageal
tumour tissues we found that the expression levels of
MTSS1 were significantly reduced or absent than those
in nontumour t issues (Figure 2-right panel s). No
obviousstainingofMTSS1wasobservedinstromal
cells in either normal or tumour tissues.
Expression pattern of MTSS1 in oesophageal cancer cell
lines
A panel of oesophageal cancer cell lines was examined
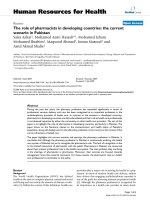
for the presence of MTSS1 through RT-PCR. MTSS1
transcript was detectable in three cell l ines (well or
moderate differentiated), but not expressed in the poorly
diff erentiated oesoph ageal squamous cell carcinoma cell
KYSE150 (Figure 3A).
Stable over-expression and knockdown of MTSS1
To investigate the role of MTSS1 in oesphageal can-
cer we used KYSE150 for MTSS1 expression as we
demonstrated that the wild-type KYSE150 cell line
did not express the MTSS1 mRNA. Whereas knock-
down of MTSS1 expression was employed from
KYSE510 cell line which expressed moderate expres-
sion levels of MTSS1. MTSS1 over-expression was
successfully established in KYSE150 cells (KYSE150-
MTSS1-Exp) after transfection compared with that in
KYSE150-WT (KYSE150-wild-type) and empty vector
control (KYSE150-PEF-control) cells (Figure 3B).
Likewise, MTSS1 which w as present within the wild-
type and control KYSE510 cells was reduced in the
KYSE510-MTSS1-Rib cells. These experiments were
replicated at the protein level through Wester n blot-
ting (Figure 3C). These new MTSS1-modified cell
lines w ere ready for the analysis through a series of in
vitro studies.
Regulation of MTSS1 expression had an impact on
oesophageal squamous cell carcinoma cell aggressiveness
Effects of MTSS1 over-expression or knockdown on in vitro
cell growth
We first determined the effect of MTSS1 over-expres-
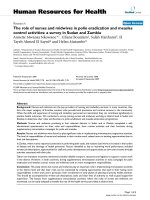
sion on in vitro cell growth (Figure 4A). The results sug-
gest an i nhibitory effect on cell growth by MTSS1 over-
expression in oesphag eal cancer cells. KYSE150-MTSS1-
Exp oesophageal cancer cells had a minor yet
Figure 2 Immunohistochemical staining of MTSS1 in human
oesophageal tissues. Top panel: the MTSS1 protein was found to
be stained in the normal oesophageal epithelial cells (indicated by
black arrows); Bottom panel: staining of oesophageal cancer cells for
MTSS1 was found to be negative in the oesophageal tumour
tissues.
Xie et al . Journal of Translational Medicine 2011, 9:95
/>Page 6 of 10
significantly reduced rate of growth (p = 0.013) com-
pared to the control group. This was consistent with
observations in KYSE510-MTSS1-Rib cells, i n which
MTSS1 expression had been knocked down. The
increased rate of growth (p = 0.009) compared to the
control group was seen in KYSE510-MTSS1-Rib cells.
Effects of MTSS1 over-expression or knockdown on in vitro
cell matrix adhesion
We further examined the influence of MTSS1 on the
adhesive nature of these oesophageal cancer cells (Figure
4B). Over-expressing MTSS1 in KYSE150 significantly
enhanced the adhesive properties compared to the con-
trol group (p = 0.0003). Conversely, knockdown of
MTSS1 expression resulted adramaticreductionin
adhesive ability (P < 0.0001).
Effects of MTSS1 over-expression or knockdown on in vitro
motility
In vitro wounding assay was employed to examine the
influence of MTSS1 over-expression or knockdown on
oesophageal cancer cell biological behavior. Over-
expression of MTSS1 also significantly inhibited the
motile nature of oesophageal cancer cells (Figure 4C).
The presence of MTSS1 within the cells significantly
suppressed cell migration to close the wound compared
to the controls (p < 0.05). The result was also consistent
with observations in MTSS1 knockdown cells. Cell
migration was enhanced in KYSE510-MTSS1-Rib cells
compared to the control group (p < 0.05).
Effects of MTSS1 over-expression or knockdown on in vitro
invasion
Finally, the presence of MTSS1 has also been shown to
affect oesophageal cancer cells invasion (Figure 4D).
Over-expression of MTSS1 in KYSE150 resulted in a
dramatic reduction in the degree of invasion (p < 0.0001
versus controls). This was also co nfirmed by further
determination on the invasive nature of MTSS1 knock-
down cells. KYSE510-MTSS1-Rib oesophageal cancer
cells were significantly more invasive than the control
cells which expressed MTSS1 (p < 0.0001).
Discussion
Since t he study of MTSS1 has been restricted to a lim-
ited number of cancer types and available data seem to
be controversial, whether or not MTSS1 serves as a
metastasis suppressor has not been clearly defined to
date. Several lines of evidence have indicated that the
expression of MTSS1 could be down-regulated in solid
tumours [2,12,15,16], whereas up-regulation of MTSS1
expression has also been observed in one other tumour
type [3]. Thus. the role of MTSS1 in cancer and cancer
metastasis remains somewhat open. To our best knowl-
edge, the current study is the first report of down- regu-
lation of MTSS1 in oesophageal squamous cell
carcinoma. Our study has shown a reduced or absent
levels of MTSS1 both in oesophageal squamous cell car-
cinoma tumour tissues and cancer cell line. We also
reported that the expression of MTSS1 was associated
with the clinical pathology and prognosis of the patients
with oesophageal squamous cell carcinoma. Cellular
function tests further demonstrated that the presence of
MTSS1 is related to the inhibition of the oesophageal
squamous cell carcinoma cell aggressiveness.
MTSS1 has been found to be transcriptionally
expressed at lower levels or absent in a limited number
of tumour cells. In the present study, the expression
levels of MTSS1 were examined in several oesophageal
cancer cell lines with different aggressiveness (from well
or moderate to poorly differentiated). It is evident from
the present study that MTSS1 was absent only in a
Figure 3 MTSS1 expression in oesophageal cancer cell lines
and over-expression and knockdown of MTSS1. (A) RT-PCR
analysis of MTSS1 mRNA expression within a panel of oesophageal
cancer cell lines. MTSS1 was not expressed in KYSE150 oesophageal
squamous cell carcinoma cells, but expressed in other three types
of oesophageal cancer cell lines. (B) Verification of over-expression
and knockdown of MTSS1 in the oesophageal cancer cell lines
using RT-PCR. MTSS1 was over-expressed in the KYSE150-MTSS1-Exp
cells; whereas MTSS1 expression levels were reduced in the
KYSE510-MTSS1-Rib cells. (C) Western blotting confirmation of
MTSS1 protein level.
Xie et al . Journal of Translational Medicine 2011, 9:95
/>Page 7 of 10
Figure 4 Cellular function tests of MTSS1 in oesophageal cance r cell lines.(A)In vitro cell growth assay. (Left panel) Over-expression of
MTSS1 significantly reduced cell growth rate. (Right panel) Suppression of MTSS1 expression levels enhanced cell growth rate. (B) In vitro cell
matrix adhesion assay. (Left panel) Cell adhesive ability was dramatically enhanced through over-expression MTSS1 in KYSE150. (Right panel) A
reduction in the adhesive nature of KYSE510 was observed through the knockdown of MTSS1 expression. (C) In vitro motility assay. (Left panel)
Over-expression of MTSS1 significantly inhibited the motile nature of oesophageal cancer cells. (Right panel) Knockdown of MTSS1 expression
dramatically enhanced cell migration. (D) In vitro invasion. (Left panel) The presence of MTSS1 within KYSE150 significantly suppressed the
invasive capacity. (Right panel) Knockdown of MTSS1 promoted the invasiveness of KYSE510. Each cell line was tested in triplicate, three
independent experiments were done. Bars, SD.
Xie et al . Journal of Translational Medicine 2011, 9:95
/>Page 8 of 10
poorly differentiated cell line, but was maintained in the
well or moderate differentiated cell lines, which indi-
cated that MTSS1 expression may be associated with
more aggressive cell lines within the same type of
cancer.
Perhaps the most important observation in the present
study is the relationship between MTSS1 expression and
oesophageal squamous cell carcinoma patient clinical
data in a cohort of human oesophageal squamous cell
carcinoma specimens by using quantitative PCR and
immunohistochemical analysis. Our data demonstrated a
reduced level of MTSS1 expression in oesophageal squa-
mous cell carcinoma tumours compared to the normal
tissues. This in contrary to the results obtained in hepa-
tocellular carcinoma, but clearly in line with the studies
in other types of cancer to date. A highly significant link
was also seen between MTSS1 expression and nodal sta-
tus, tumour grade and overall survival. Our findings
clearly indicate therefore that MTSS1 may serve as a
potential prognostic indicator for patients with oesopha-
geal squamous cell carcinoma, as we s how that patients
expressing high levels of MTSS1 have a favorable prog-
nosis in contrast to those patients with reduced levels of
MTSS1 and a poo r prognosis. Consistent with our find-
ings, high levels of MTSS1 expression was also found in
breast cancer or hepatocellular carcinoma patients with
a favorable prognosis in the previous reports . This indi-
cates that MTSS1 serves as a potential prognostic indi-
cator in human cancer.
Our functional studies have demonstrated that the
MTSS1 over-expression resulted in a dramatic reduction
in tumour cell migration, invasion and growth, and an
increase in cell adhesion. The loss of MTSS1 by way of
hammerhead ribozyme transgenes resulted in enhanced
invasiveness, migration, growth and decreased adhesive
ability, in comparison with control cells, which further
verified the results of MTSS1 expression. The inhibition
effect of MTSS1 on oesoph ageal cell growth is in agree-
ment with the find ings in prostate cell lines [16,17]. The
effect of overexpressed MIM on Shh signaling may be
involved in the mechanism for growth suppression [8].
Studies also reported that MIM regulates cell motility
by modulating actin polymerization factor s through dif-
ferent signaling pathway [4,7,8,18-23], although the
detailed mechanism of MTSS1’s effect on cell motility
need to be further defined. It is interesting to note the
enhanced adhesive ability induced by MTSS1, which
was in contrast to the findings that MTSS1 did not
affect the ability of cell adhesion [16,17]. The mechan-
ism of MTSS1’s effect on ce ll adhesion propertie s may
be related to the role of M TSS1 in cell polarity. Mattila
et al. suggested that MIM may help promote and main-
tain cell polarity, whereas the loss of polarity in epithe-
lial cells may affect adhesion [6]. Rece nt study revealed
that MTSS1 deficient mice display defects in the inter-
cellular junctions of epithelial cells. Thus, MTSS1
appears to contribute to the integrity of epithelial sheets,
which may provide an explanation for why the loss of
MTSS1 in certain epithelial tumours is linked to
increased metastatic behaviour [24,25].
Conclusions
Down-regulation of MTSS1 expression was observed
both in oesophageal tumour tissues and oesophageal
squamous cell carcinoma cancer cell lines, and is related
to clinical pathology and prognosis of the patients with
oeso phageal squamous cell carcinoma . Cellular function
tests further demonstrated that the presence of MTSS1
is related to the inhibition of the oesophageal squamous
cell carcinoma cell aggressiveness. This study showed
that MTSS1 could be of value as a potential prognostic
indicat or in human ESCC and may be an impo rtant tar-
get for cancer therapy.
Acknowledgements
The authors would like to thank Cancer Research Wales and the Albert
Hung Foundation for their support. The authors also thank Sevier Medical
Art for their kind permission to produce some of present figures using their
prepared images. Dr Fei Xie is a recipient of the China Medical Scholarship
of Cardiff University and Peking University School of Oncology.
Author details
1
Metastasis and Angiogenesis Research Group, Cardiff University School of
Medicine, Cardiff, CF14 4XN, UK.
2
Key Laboratory of Carcinogenesis and
Translational Research (Ministry of Education), Department of Thoracic
Surgery, Peking University School of Oncology and Beijing Cancer Hospital,
Beijing, 100142, China.
Authors’ contributions
FX carried out the Quantitative PCR, western blotting, cell function test, and
drafted the manuscript. YL carried out the RNA extraction, reverse
transcription PCR, immunoassays and performed the statistical analysis. LY
carried out the construction of MTSS1 expressing and ribozyme transgenes.
JC participated in the collection of tissue samples and investigated the
clinical features. NW participated in collection of the tissue samples. ZZ
helped to draft the manuscript. YY participated in the design of the study.
LZ participated in the design of the study. WJ conceived of the study, and
participated in its design and coordination. All authors read and approved
the final manuscript.
Competing interests
The authors declare that they have no competing interests.
Received: 23 March 2011 Accepted: 22 June 2011
Published: 22 June 2011
References
1. Steeg PS: Metastasis suppressors alter the signal transduction of cancer
cells. Nat Rev Cancer 2003, 3:55-63.
2. Lee Y, Macoskay JA, Korenchukx S, Pientay KJ: MIM, a potential metastasis
suppressor gene in bladder cancer. Neoplasia 2002, 4:291-294.
3. Ma S, Guan X, Lee TK, Chan KW: Clinicopathological significance of
missing in metastasis B expression in hepatocellular carcinoma. Hum
Pathol 2007, 38:1201-1206.
4. Lin J, Liu J, Wang Y, Zhu J, Zhou K, Smith N, Zhan X: Differential regulation
of cortactin and N-WASP-mediated actin polymerization by missing in
metastasis (MIM) protein. Oncogene 2005, 24:2059-2066.
Xie et al . Journal of Translational Medicine 2011, 9:95
/>Page 9 of 10
5. Yamagishi A, Masuda M, Ohki T, Onishi H, Mochizuki N: A novel actin
bundling/filopodium-forming domain conserved in insulin receptor
tyrosine kinase substrate p53 and missing in metastasis protein. J Biol
Chem 2004, 279:14929-14936.
6. Mattila PK, Salminen M, Yamashiro T, Lappalainen P: Mouse MIM, a tissue-
specific regulator of cytoskeletal dynamics, interacts with ATP-actin
monomers through its C-terminal WH2 domain. J Biol Chem 2003,
278:8452-8459.
7. Mattila P K, Pykäläinen A, Saarikangas J, Paavilainen VO, Vihinen H,
Jokitalo E, Lappalainen P: Missing-in-metastasis and IRSp53 deform PI
(4,5)P2-rich membranes by an inverse BAR domain-like mechanism. J
Cell Biol 2007, 176:953-964.
8. Callahan CA, Ofstad T, Horng L, Wang JK, Zhen HH, Coulombe PA, Oro AE:
MIM/BEG4, a Sonic hedgehog-responsive gene that potentiates Gli-
dependent transcription. Genes Dev 2004, 18:2724-2729.
9. Nazarenko IA, Bhatnagar SK, Hohman RJ: A closed tube format for
amplification and detection of DNA based on energy transfer. Nucleic
Acids Res 1997, 25:2516-2521.
10. Jiang WG, Douglas-Jones A, Mansel RE: Level of expression of
lipoxygenase-5, 12, and 15 and cyclooxygenase in human breast cancer.
Prostaglaindins Leukotr Ess Fatty Acids 2003, 69:275-281.
11. Jiang WG, Grimshaw D, Lane J, Martin TA, Abounader R, Laterra J,
Mansel RE: A hammerhead ribozyme suppresses expression of
hepatocyte growth factor/scatter factor receptor c-MET and reduces
migration and invasiveness of breast cancer cells. Clin Cancer Res 2001,
7:2555-62.
12. Parr C, Jiang WG: Metastasis suppressor 1 (MTSS1) demonstrates
prognostic value and anti-metastatic properties in breast cancer. Eur J
Cancer 2009, 45:1673-1683.
13. Jiang WG, Hiscox S, Hallett MB, Scott C, Horrobin DF, Puntis MC: Inhibition
of hepatocyte growth factor-induced motility and in vitro invasion of
human colon cancer cells by gamma-linolenic acid. Br J Cancer 1995,
71:744.
14. Jiang WG, Hiscox SE, Parr C, Martin TA, Matsumoto K, Nakamura T, et al:
Antagonistic effect of NK4, a novel hepatocyte growth factor variant, on
in vitro angiogenesis of human vascular endothelial cells. Clin Cancer Res
1999, 5:3695.
15. Nixdorf S, Grimm M, Loberg R, Marreiros A, Russell RJ, Pienta KJ, Jackson P:
Expression and regulation of MIM (missing in metastasis), a novel
putative metastasis suppressor gene, and MIM-B, in bladder cancer cell
lines. Cancer Lett 2004, 215:209-220.
16. Utikal1 J, Gratchev A, Muller-Molinet I, Oerther S, Kzhyshkowska J, Arens N,
Grobholz R, Kannookadan S, Goerdt S: The expression of metastasis
suppressor MIM/MTSS1 is regulated by DNA methylation. Int J Cancer
2006, 119:2287-2293.
17. Loberg RD, Neeley CK, Adam-day LL, Fridman Y, St John LN, Nixdorf S,
Jackson P, Kalikin LM, Pienta KJ: Differential expression analysis of MIM
(MTSS1) splice variants and a functional role of MIM in prostate cancer
cell biology. Int J Oncol 2005, 26:1699-1705.
18. Bompard G, Sharp SJ, Freiss G, Machesky LM:
Involvement of Rac in actin
cytoskeleton rearrangements induced by MIM-B. J Cell Sci 2005,
118:5393-5403.
19. Wang Y, Zhou K, Zeng X, Lin J, Zhan X: Tyrosine phosphorylation of
missing in metastasis protein is implicated in platelet-derived growth
factor-mediated cell shape changes. J Biol Chem 2007, 282:7624-7631.
20. Suetsugu S, Murayama K, Sakamoto A, Hanawa-Suetsugu K, Seto A,
Oikawa T, Mishima C, Shirouzu M, Takenawa T, Yokoyama S: The RAC
binding domain/IRSp53 -MIM homology domain of IRSp53 induces RAC-
dependent membrane deformation. J Biol Chem 2006, 281:35347-35358.
21. Saarikangas J, Zhao H, Pykäläinen A, Laurinmäki P, Mattila PK, Kinnunen PK,
Butcher SJ, Lappalainen P: Molecular mechanisms of membrane
deformation by I-BAR domain proteins. Curr Biol 2009, 19:95-107.
22. Woodings JA, Sharp SJ, Machesky LM: MIM-B, a putative metastasis
suppressor protein, binds to actin and to protein tyrosine phosphatase
delta. Biochem J 2003, 371:463-71.
23. Xie F, Ye L, Ta M, Zhang L, Jiang WG: MTSS1: a multifunctional protein
and its role in cancer invasion and metastasis. Front Biosci 2011, 3:621-31.
24. Saarikangas J, Mattila PK, Varjosalo M, Bovellan M, Hakanen J, Calzada-
Wack J, et al: Missing-in-metastasis MIM/MTSS1 promotes actin assembly
at intercellular junctions and is required for intergrity of kidney
epithelia. J Cell Sci 2011, 124:1245-1255.
25. Mustafa N, Martin TA, Jiang WG: Metastasis tumour suppresor-1, MTSS-1
and the aggressiveness of prostate cancer cells. Exp Therapeut Med 2011,
2:157-162.
doi:10.1186/1479-5876-9-95
Cite this article as: Xie et al.: The impact of Metastasis Suppressor-1,
MTSS1, on oesophageal squamous cell carcinoma and its clinical
significance. Journal of Translational Medicine 2011 9:95.
Submit your next manuscript to BioMed Central
and take full advantage of:
• Convenient online submission
• Thorough peer review
• No space constraints or color figure charges
• Immediate publication on acceptance
• Inclusion in PubMed, CAS, Scopus and Google Scholar
• Research which is freely available for redistribution
Submit your manuscript at
www.biomedcentral.com/submit
Xie et al . Journal of Translational Medicine 2011, 9:95
/>Page 10 of 10