báo cáo hóa học: " Body mass index and health related quality of life in elementary school children: a pilot study" pdf
Bạn đang xem bản rút gọn của tài liệu. Xem và tải ngay bản đầy đủ của tài liệu tại đây (231.48 KB, 6 trang )
BioMed Central
Page 1 of 6
(page number not for citation purposes)
Health and Quality of Life Outcomes
Open Access
Research
Body mass index and health related quality of life in elementary
school children: a pilot study
Lei Zhang*
1
, Peter J Fos
2
, William D Johnson
3
, Vafa Kamali
4
, Reagan G Cox
5
,
Miguel A Zuniga
6
and Theresa Kittle
1
Address:
1
Mississippi State Department of Health, Jackson, MS, USA,
2
University of Texas at Tyler, Texas, USA,
3
Louisiana State University, Baton
Rouge, LA, USA,
4
University of Southern Mississippi, Hattiesburg, Mississippi, USA,
5
Vanderbilt University, Nashville, TN, USA and
6
Texas A&M
Health Science Center, South Texas, McAllen, TX 78503, USA
Email: Lei Zhang* - ; Peter J Fos - ; William D Johnson - ;
Vafa Kamali - ; Reagan G Cox - ; Miguel A Zuniga - ;
Theresa Kittle -
* Corresponding author
Abstract
Background: We investigated the relationship between Body Mass Index (BMI) and health-related
quality of life (HRQOL) indicated by baseline health status in elementary school children.
Methods: Data were obtained via parents whose children enrolled in an elementary school,
kindergarten to fourth grade, in southern Mississippi in spring 2004. Parents completed the SF-10
for Children™, a brief 10-item questionnaire designed to measure children's HRQOL on a voluntary
basis.
Results: A total of 279 parents completed the questionnaires for their children. On average,
physical and psychosocial summary scores, major indicators for HRQOL, were significantly higher
among the elementary school children in our study relative to those from U.S. children overall (p
< 0.0001 and p = 0.0007, respectively). Males tended to have better physical functioning than their
female classmates, whereas females had better psychosocial health. Overall, except for third
graders, the physical summary scores increased as grade level increased. The means for
psychosocial score fluctuated without a clear pattern over the five grade levels. High level of BMI
was significantly associated with children's physical summary scores below 50, a norm used for U.S.
children (p = 0.003). Gender and grade were not significant predictors of children's physical and
psychosocial scores.
Discussion: This study can be used as baseline information to track changes over time, in BMI and
health status among the elementary school children. In addition, this study can be used to
investigate relationships between BMI, health status, intellectual ability, and performance in school.
Conclusion: The findings suggest that programs designed to encourage children to lose weight in
a healthy manner, thus reducing their BMI, could improve the physical and psychosocial health, and
subsequently increase HRQOL.
Published: 9 October 2008
Health and Quality of Life Outcomes 2008, 6:77 doi:10.1186/1477-7525-6-77
Received: 25 January 2008
Accepted: 9 October 2008
This article is available from: />© 2008 Zhang et al; licensee BioMed Central Ltd.
This is an Open Access article distributed under the terms of the Creative Commons Attribution License ( />),
which permits unrestricted use, distribution, and reproduction in any medium, provided the original work is properly cited.
Health and Quality of Life Outcomes 2008, 6:77 />Page 2 of 6
(page number not for citation purposes)
Background
Health is a concept that is broader than simply the
absence of disease, but encompasses physical, social,
mental, and emotional well-being. Health-related quality
of life (HRQOL) is a notion that attempts to merge all
aspects of overall quality of life related to general health.
These life circumstances have been identified as both
physical and mental [1]. Indices of HRQOL represent
physical and mental perceptions, and health risks, func-
tional status, and socioeconomic status. At the population
level HRQOL measures conditions and resources that
affect the perceptions of health and functional status. In
this context, HRQOL can be seen as an expansion to the
concept of health which then allows for encompassing the
physical and mental needs in a population [2].
HRQOL is becoming a popular measurable outcome that
questions the perceived physical and mental health and
function, and is generally considered an appropriate and
adequate measure of health care service needs and inter-
vention outcomes [3]. HRQOL measurements allow for
scientific demonstration of the impact of quality of life on
health. HRQOL is related to self-reported characteristics
associated with chronic diseases and risk factors. HRQOL
surveillance can provide insights to the identification of
sub-groups in a population who have perceived poor
health, and then provide guidelines for targeting of high
priority interventions.
Several measures have been used to assess HRQOL and
related functional status, and to describe these notions in
the context of health status. These measures include: Med-
ical Outcomes Study Short Forms (SF-36, SF-12, SF-10 for
Children™, and SF-8), the Sick Impact Profile, and Coop
Charts. The SF-survey series are used by the Center for
Medicare and Medicaid Services and the National Com-
mittee for Quality Assurance's Health Plan Employer Data
Information Set (HEDIS 3.0) to evaluate the quality of
care that is provided in managed care plans and other
health care facilities [4].
Health status is determined by several factors, including
physical health and functional status, and its measure-
ment involves these dimensions and associated objective
and subjective measures. Health status measurement is
accomplished as either a health status index or profile. An
index is characterized by a single score representing health
status. On the other hand, a health status profile provides
a multidimensional evaluation of all aspects of health.
Health profiles are popular in situations where the inter-
action of the physical, social, mental and emotional deter-
minants of health are of interest. Health indices are useful
in health policy and economic evaluation, because a sin-
gle score is useful in making choices and decisions. The
SF-series and the SF-10 for Children™ are examples of a
health profile.
Body Mass Index (BMI) is a tool for indicating a person's
weight status. It is a measure of body weight for a specified
height. BMI correlates with body fat and a high level of
body fat may increase the risk of developing diseases. The
relation between fatness and BMI differs with age and gen-
der. As BMI increases, the risk for some disease increases.
In adults, BMI is often divided into the following catego-
ries with respect to height: (1) underweight, (2) normal
weight, (3) overweight, and (4) obese. Common condi-
tions that are related to being overweight or obese
include: premature death, cardiovascular disease, high
blood pressure, osteoarthritis, some cancers, and diabetes.
However, BMI is only one of many factors used to predict
risk for disease. Different from adults, BMI for children is
frequently categorized as (1) underweight, (2) normal
weight, (3) at risk for overweight, and (4) overweight.
Children's body fatness changes over the years as they
grow. Also, girls and boys differ in their body fatness as
they mature, so the BMI for children, also referred to as
BMI-for-age, is a gender and age specific measurement
[5,6]. In 2007, American Medical Association Expert
Committee on the Assessment, Prevention, and Treat-
ment of Child and Adolescent Overweight and Obesity
recommended to use "overweight" and "obese" to replace
terminology "at risk for overweight" and "overweight"
respectively. Since the study was conducted prior to the
recommendation, the traditional classification on BMI
was used in this study so the findings are consistent with
the previous records.
Based on the 2007 data from the National Behavioral Risk
Factor Surveillance System and Youth Risk Behavior Sur-
veillance System, Mississippi led the nation in obesity
among adults and public high school students. Similar
population data are not available for Mississippi elemen-
tary school children. The main objective of this study is to
investigate if BMI is associated with HRQOL in a small
sample among elementary school students to gain insight
about correlates of early onset of obesity.
Methods
The SF-10 for Children™ is a brief 10-item questionnaire
designed to measure children's HRQOL. Study question-
naires were composed of standardized SF-10 For Chil-
dren™ questions, as well as questions requesting
demographic characteristics (age, gender and grade level)
and personal characteristics (height and weight). A
detailed description of the survey is reported elsewhere
[7]. In the spring of 2004, our investigation surveyed par-
ents of children enrolled in an elementary school, kinder-
garten to fourth grade, in southern Mississippi. Parents
completed the SF-10 for Children™ on a voluntary basis.
Health and Quality of Life Outcomes 2008, 6:77 />Page 3 of 6
(page number not for citation purposes)
Physical (PHS-10) and psychosocial (PSS-10) summary
scores were calculated according to SF-10 for Children™
survey guidelines [7]. Higher scores indicate more favora-
ble physical and psychosocial functioning. Five survey
questions are required for the physical score and five are
necessary for the psychosocial score. Summary score were
not calculated for students with missing responses to
required questions.
BMI was calculated for children with reported height and
weight data. Insufficient height and/or weight measure-
ments were reported for 88 (31.5%) of sample partici-
pants. Height measurements were rounded to the nearest
inch and weight measurements were rounded to the near-
est pound. BMI was calculated as weight in pounds
divided by height in inches, squared and multiplied by
703 to obtain the standard BMI measurement unit of (kil-
ograms/meters
2
). Data from the 2000 Centers for Disease
Control and Prevention (CDC) gender-specific, BMI-for-
age growth charts were used to determine BMI percentiles
for individuals [8]. Children were classified into four cat-
egories: (1) underweight (BMI is less than or equal to 5th
percentile), (2) normal weight (BMI is greater than 5th-
but less than 85th percentile), (3) at risk for being over-
weight (BMI is greater than or equal to 85th- but less than
95th percentile) and (4) overweight (BMI is greater than
or equal to 95th percentile). Of the children with suffi-
cient data to calculate BMI, 12 (6.3%) were classified as
"underweight" and were excluded from analyses.
SAS 9.1 (SAS Institute Inc., Cary, NC) was used for all sta-
tistical calculations. Summary statistics (mean, standard
deviation and range) were calculated for PHS-10 and PSS-
10 scores. Mean PHS-10 and PSS-10 scores were calcu-
lated for the total sample and also for gender and grade
level sub-groups. A score of 50 was established as the
norm for U.S. children for both physical and psychosocial
health. The one-sample t-test was used to determine if the
physical and psychosocial mean scores differed from the
national averages. PHS-10 and PSS-10 scores each were
categorized into three groups: "substantial impact" (score
< 47), "some impact" (score 47–50), and "little or no
impact" (scores ≥ 50). The prevalence of children in each
score category was calculated based upon their BMI classi-
fication. Physical and psychosocial scores were regrouped
into dichotomous variables where students with scores
less than 50 were considered to have poor physical or psy-
chosocial functioning. Logistic regression was used to
investigate factors that may be associated with poor func-
tioning. Effects of the following correlated factors were
examined: gender, grade level and BMI.
Results
The sample included 279 students from a single elemen-
tary school in Mississippi. Slightly more females than
males were included in the sample (53% vs. 47%). Chil-
dren represented five consecutive grade levels, from kin-
dergarten through fourth grade. The percentage of
students in each respective grade level (K, 1st, 2nd, 3rd,
and 4th) was 20%, 21%, 25%, 18% and 16%.
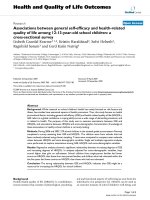
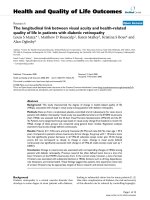
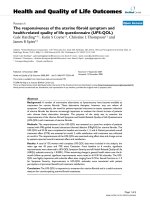
Figure 1 contains comparisons of mean physical and psy-
chosocial summary scores for the sample population. On
average, children in the sample had significantly higher
physical summary scores than children in the general U.S.
population (p < 0.0001). Children's psychosocial sum-
mary scores were also significantly higher than the U.S.
norm (p = 0.0007). Male students tended to have better
physical functioning than their female classmates,
whereas female students had better psychosocial func-
tioning. Overall, physical summary scores increased as
grade level increased except for those from the third grade.
Mean psychosocial scores fluctuated without a clear pat-
tern over the five grade levels.
Physical summary scores were calculated for 264 students.
The mean physical summary score was 52.1 with range
from 6.3 to 56.7. Table 1 depicts the frequency of students
with physical summary scores in each category based
upon their BMI classification. The percentage of children
reporting physical summary scores greater than or equal
to 50 decreased as BMI increased. Likewise, as BMI
increased the percentage of children reporting physical
scores between 47 and 50 decreased. Although the per-
centage of children reporting PHS-10 scores below 47
decreased with increasing BMI, there was no linear trend.
Psychosocial summary scores were available for 274 stu-
dents. The mean psychosocial score was 51.7 with range
from 13.9 to 60.8. Psychosocial scores were grouped into
categories based upon SF-10 for Children™ survey guide-
lines. Table 2 shows the frequency of students with psy-
chosocial summary scores in each category based upon
their BMI classification. As BMI increased the percentage
of children reporting psychosocial summary scores greater
than or equal to 50 decreased. Similarly, the percentage of
students reporting the poorest psychosocial health (PSS-
10 scores < 47) decreased as BMI increased. The percent-
age of children reporting physical scores between 47 and
50 decreased as BMI increased, however the trend was not
linear.
The majority of children in this sample scored 50 or
higher on the physical and psychosocial summary score
scales. Only 41 (21.5%) children reported a physical sum-
mary score less than 50. Of these children, 36 also had
data available for gender, grade and BMI. The model for
physical summary score was significant (p = 0.026).
Increasing BMI was significantly associated with physical
Health and Quality of Life Outcomes 2008, 6:77 />Page 4 of 6
(page number not for citation purposes)
summary scores below 50 (p = 0.003). Gender and grade
level were not significantly correlated with PHS-10 scores.
A total of 51 (26.7%) children reported a psychosocial
score less than 50. Of these, 48 had data available for the
selected independent factors. The model for psychosocial
summary score was not significant (p = 0.193).
Discussion
The general health of youth in Mississippi concerns par-
ents and community leaders. It is encouraging to see that
young children in this Mississippi school currently enjoy
physical and psychosocial functioning at a level higher
than in the general U.S. population. In order to continu-
ously monitor children's health status, however, similar
but more inclusive studies are necessary as researchers
need to further investigate factors that could potentially
impede the health of our children.
Of the 279 children for which physical and psychosocial
summary scores were calculated, 73% had PHS-10 scores
≥ 50 and 69% had PSS-10 scores ≥ 50. Although the
majority of students apparently enjoy very good HRQOL,
the prevalence of high scores may be distorted by sample
characteristics. The children who attend this elementary
school are predominantly white and from middle- to
upper class families. Thus, the demographic profile of the
sample is not representative of either the entire state of
Mississippi or the general U.S. population. We hypothe-
size that a sample with a higher percentage of minority
Mean PHS-10 and PSS-10 scores by gender and grade levelFigure 1
Mean PHS-10 and PSS-10 scores by gender and grade level.
35
40
45
50
55
Mean Score
PHS-10
52.1 52.7 52.0 51.7 52.1 52.9 50.3 53.9
PSS-10
51.7 51.5 52.3 52.3 51.7 52.0 50.8 52.0
U.S. Norm
50.0
Total Males Females K 1st 2nd 3rd 4th
Table 1: PHS-10 scores by BMI category
PHS-10 Score Category
< 47 47–50 ≥ 50
BMI Category Frequency (Percent) Frequency (Percent) Frequency (Percent)
Normal weight 9 (39.1) 10 (55.6) 88 (58.7)
At risk for overweight 5 (21.7) 4 (22.2) 27 (18.0)
Overweight 8 (34.8) 4 (22.2) 24 (16.0)
§Students with BMI classification of "underweight" were excluded due to small frequencies. Therefore, column percentages do not necessarily total
to 100%.
Health and Quality of Life Outcomes 2008, 6:77 />Page 5 of 6
(page number not for citation purposes)
children and with diverse family income levels would
most likely produce a lower prevalence of children with
high physical and psychosocial scores.
Our results are reasonably consistent with previous
research. A few studies have identified high BMI or obesity
as a significant factor associated with poor HRQOL [9-
11]. Investigators have consistently reported high BMI to
be significantly associated with lower physical health
scores. The association appears to hold for a variety of
youth populations: a community-based sample of
younger adolescents (ages 8–11) [9], a nationally repre-
sentative sample of older adolescents (ages 12–20) [10],
and a sample of severely obese children and adolescents
(ages 5–18) [11]. Previous studies have not consistently
reported a significant association between BMI and psy-
chosocial health among children [9-11]. Overweight chil-
dren scored significantly lower on the psychosocial health
score compared to children of normal weight in a Cleve-
land, Ohio community-based sample [9]. Children
included in the sample for the Cleveland study were not
representative of Mississippi children. Specifically, the
sample population was slightly older (ages 8–11) and
31.5% were of minority racial descent. Furthermore, the
definition for normal weight (BMI is greater than or equal
to 20th- but less than 85th percentile) was more exclusive
than our definition and the logistic regression model uti-
lized this category for comparison purposes. Differences
in methodology, sample size and sample characteristics
may explain our findings that suggest psychosocial health
is not significantly associated with a child's BMI.
Our findings suggest that males enjoy a higher quality of
physical health compared to their female classmates. Con-
versely, females score higher on the psychosocial func-
tioning scale.
Our study has several limitations. The study participants
were not randomly selected from some larger population.
Parents were given the option to answer or decline to
answer the study questionnaire for their children. No
demographic information was collected for the students
whose parents declined participation in the study, so we
were unable to examine whether these students differed
from the students who participated. Further, a larger sam-
ple may have enhanced our ability to detect statistically
significant relationships.
The instrument used to collect survey data relied upon
parental evaluation of child health. While proxy reporting
of health indicators by parents/guardians is generally
valid for children in this age range, data may be distorted
by factors that are not controllable, e.g. parent-child rela-
tionships or parental perception of child functioning.
Height and weight were collected via parental report. The
accuracy of measurements was not confirmed. Moreover,
over 30 percent of respondents did not report height and
weight. This limited our ability to evaluate the relation-
ship between BMI and physical and psychosocial health.
Despite these limitations, our study has shown that par-
ent-reported health status of children was successfully col-
lected using the SF-10 for Children™ survey instrument.
Also, baseline BMI and health status data were deter-
mined for a population of elementary school children in
a state with the highest prevalence of adult obesity. This
baseline information can be used to track changes over
time, in BMI and health status. In addition, this study can
be used as baseline information to investigate relation-
ships between BMI, health status, intellectual ability, and
performance in school.
Conclusion
This study provides evidence of an association between
BMI and HRQOL in elementary school children. The
impact of being overweight appears to affect both the
physical and psychosocial health of children as young as
5 years of age. In fact, our findings suggest that the health
of younger children may be more disturbed by their high
BMI, compared to children a couple years older. While
our findings do not suggest causality, the association
between childhood obesity and childhood HRQOL is
something that should not be overlooked. Many research-
ers are concerned with childhood eating and exercise hab-
its that may contribute to poor health as adults. Our
findings suggest that a child's present health may be less
Table 2: PSS-10 scores by BMI category
PSS-10 Score Category
< 47 47–50 ≥ 50
BMI Category Frequency (Percent) Frequency (Percent) Frequency (Percent)
Normal weight 15 (44.1) 8 (47.1) 84 (60.0)
At risk for overweight 10 (29.4) 2 (11.8) 24 (17.1)
Overweight 7 (20.6) 6 (35.3) 23 (16.4)
§Students with BMI classification of "underweight" were excluded due to small frequencies. Therefore, column percentages do not necessarily total
to 100%.
Publish with BioMed Central and every
scientist can read your work free of charge
"BioMed Central will be the most significant development for
disseminating the results of biomedical research in our lifetime."
Sir Paul Nurse, Cancer Research UK
Your research papers will be:
available free of charge to the entire biomedical community
peer reviewed and published immediately upon acceptance
cited in PubMed and archived on PubMed Central
yours — you keep the copyright
Submit your manuscript here:
/>BioMedcentral
Health and Quality of Life Outcomes 2008, 6:77 />Page 6 of 6
(page number not for citation purposes)
than optimal due in part to their elevated BMI. Further
research is necessary to elucidate other aspects of the rela-
tionship between BMI and children's HRQOL. However,
the findings from this study suggest that programs
designed to encourage children to lose weight in a healthy
manner, thus reducing their BMI, could also improve their
physical and psychosocial health.
Competing interests
The authors declare that they have no competing interests.
Authors' contributions
LZ led data analysis and writing, and supervised all aspects
of its implementation. PJF originated the study and con-
tributed writing. WDJ contributed interpreting results and
writing. VK proposed the ideas and posed a number of
substantive questions related to data collection and anal-
ysis. RGC contributed data analysis and writing. MAZ pro-
vided guidance on using SF-10 for Children
TM
related to
data collection and analysis. TK managed the database
and did data entry. All authors read and approved the
final manuscript.
Acknowledgements
We would like to thank all the parents who participated the survey. We
thank the reviewers and the HQLO Editorial Team for their comments.
Our thanks also go to Beth McGinty for her help on formatting and submit-
ting the article.
References
1. McHorney CA: Health status assessment methods for adults:
past accomplishments and future challenges. Annual Review
Public Health 1999, 20:309-35.
2. Stokols D: Establishing and maintaining healthy environ-
ments: toward a social ecology of health promotion. Amer Psy-
chol 1992, 47(1):6-22.
3. Idler EL, Benyamini Y: Self-reported health and mortality: a
review of twenty-seven community studies. Journal of Health
Soc Behavior 1997, 38:21-37.
4. Centers for Disease Control and Prevention: Measuring Healthy Days
Atlanta, Georgia: CDC; 2000.
5. Hammer LD, Kraemer HC, Wilson DM, Ritter PL, Dornbusch SM:
Standardized percentile curves of body-mass index for chil-
dren and adolescents. Am J Dis Child 1991, 145(3):259-263.
6. Pietrobelli A, Faith MS, Allison DB, Gallagher D, Chiumello G, Heyms-
field SB: Body mass index as a measure of adiposity among
children and adolescents: A validation study. Journal of Pediat-
rics 1998, 132:204-210.
7. Turner-Bowker DM, Bayliss MS, Kosinski M, Zhao J, Saris-Baglama
RN: SF-10 for Children™ A User's Guide Lincoln (RI): QualityMetric Inc;
2003.
8. Kuczmarski RJ, Ogden CL, Guo SS, Grummer-Strawn LM, Flegal KM,
Mei Z, Wei R, Curtin LR, Roche AF, Johnson CL: 2000 CDC growth
charts for the United States: Methods and development.
National Center for Health Statistics. Vital Health Stat 11
2002:1-190.
9. Friedlander SL, Larkin EK, Rosen CL, Palermo TM, Redline S:
Decreased quality of life associated with obesity in school-
aged children. Arch Pediatr Adolesc Med 2003, 157:1206-1211.
10. Swallen KC, Reither EN, Haas SA, Meier AM: Overweight, obesity,
and health-related quality of life among adolescents: The
National Longitudinal Study of Adolescent Health. Pediatrics
2005, 115(2):340-347.
11. Schwimmer JB, Burwinkle TM, Varni JW: Health-related quality of
life of severely obese children and adolescents. JAMA 2003,
289(14):1813-1819.