báo cáo hóa học: " Cognitive impairment and preferences for current health" ppt
Bạn đang xem bản rút gọn của tài liệu. Xem và tải ngay bản đầy đủ của tài liệu tại đây (568.59 KB, 9 trang )
BioMed Central
Page 1 of 9
(page number not for citation purposes)
Health and Quality of Life Outcomes
Open Access
Research
Cognitive impairment and preferences for current health
JosephTKingJr*
1,2
, Joel Tsevat
3,4,5
and Mark S Roberts
6,7,8
Address:
1
Section of Neurosurgery, VA Connecticut Healthcare System, West Haven, Connecticut, USA,
2
Department of Neurosurgery, Yale
University, New Haven, Connecticut, USA,
3
Section of Outcomes Research, Division of General Internal Medicine, Department of Internal
Medicine, University of Cincinnati Medical Center, Cincinnati, Ohio, USA,
4
Center for Clinical Effectiveness, Institute for Health Policy and Health
Services Research, University of Cincinnati Medical Center, Cincinnati, Ohio, USA,
5
Veterans Affairs Medical Center, Cincinnati, Ohio, USA,
6
Section of Decision Sciences and Clinical Systems Modeling, Division of General Internal Medicine, Department of Medicine, University of
Pittsburgh, Pittsburgh, Pennsylvania, USA,
7
Center for Research on Health Care, University of Pittsburgh, Pittsburgh, Pennsylvania, USA and
8
Division of General Internal Medicine, University of Pittsburgh, Pittsburgh, Pennsylvania, USA
Email: Joseph T King* - ; Joel Tsevat - ; Mark S Roberts -
* Corresponding author
Abstract
Background: We assessed preferences for current health using the visual analogue scale (VAS),
standard gamble (SG), time trade-off (TTO), and willingness to pay (WTP) in patients with cerebral
aneurysms, a population vulnerable to cognitive deficits related to aneurysm bleeding or treatment.
Methods: We measured VAS, SG, TTO, and WTP values for current health in 165 outpatients
with cerebral aneurysms. We assessed cognitive impairment with the Mini Mental State
Examination (MMSE; scores < 24 = cognitive impairment). We examined the distributions of
preference responses stratified by cognitive status, and the relationship between preferences and
cognitive impairment, patient characteristics, and aneurysm history.
Results: Eleven patients (7%) had MMSE scores < 24. The distribution of preferences responses
from patients with cognitive impairment had greater variance (SG, 0.39 vs. 0.21, P = 0.001; TTO,
0.36 vs. 0.24, P = 0.017) and altered morphology (VAS, P = 0.012; SG, P = 0.023) compared to the
responses of unimpaired patients. There was good correlation between most preference measures
for unimpaired patients (VAS:TTO, rho = 0.19, P = 0.018; SG:TTO, rho = 0.36, P < 0.001; SG:WTP,
rho = -0.33, P < 0.001) and a trend towards significance with another pairing (VAS:WTP, rho =
0.16, P = 0.054). In subjects with cognitive impairment, there was a significant correlation only
between VAS and TTO scores (rho = 0.76, P = 0.023). Separate regression models showed that
cognitive impairment was associated with lower preferences on the VAS (β = -0.12, P = 0.048), SG
(β = -0.23, P = 0.002), and TTO (β = -0.17, P = 0.035).
Conclusion: Cognitive impairment is associated with lower preferences for current health in
patients with cerebral aneurysms. Cognitively impaired patients have poor inter-preference test
correlations and different response distributions compared to unimpaired patients.
Background
Patient preferences for health states, also known as health
values or utilities, are central to decision analysis and cost-
effectiveness analysis. There are several methods to assess
health state preferences, including the visual analogue
scale (VAS), standard gamble (SG), time trade-off (TTO),
and willingness to pay (WTP) methods [1-4]. The SG and
TTO present the subject with a hypothetical choice involv-
Published: 9 January 2009
Health and Quality of Life Outcomes 2009, 7:1 doi:10.1186/1477-7525-7-1
Received: 16 May 2008
Accepted: 9 January 2009
This article is available from: />© 2009 King et al; licensee BioMed Central Ltd.
This is an Open Access article distributed under the terms of the Creative Commons Attribution License ( />),
which permits unrestricted use, distribution, and reproduction in any medium, provided the original work is properly cited.
Health and Quality of Life Outcomes 2009, 7:1 />Page 2 of 9
(page number not for citation purposes)
ing a risk of immediate death or a shorter life, respectively,
in exchange for perfect health, and then calculate prefer-
ences based on responses. The VAS, often not considered
a true preference measure, asks the subject to rate health
states on a linear scale anchored usually by dead and per-
fect health. WTP offers subjects the option of purchasing
a hypothetical treatment producing perfect health, and
the purchase price indicates the strength of their prefer-
ence.
Cerebral aneurysms have a prevalence from 2–6% [5-7],
and can adversely affect quality of life via subarachnoid
hemorrhage (SAH), mass effect, thromboembolic stroke,
psychological distress, and adverse outcomes of surgical
or endovascular aneurysm treatment. Up to 50% of
patients who experience aneurysmal hemorrhage experi-
ence cognitive deficits [8], and deficits can also occur as a
complication of elective treatment aimed at preventing
aneurysm rupture [9]. Cognitive deficits can affect quality
of life. Both the general population and caretakers for
patients with Alzheimer's disease report diminished val-
ues for dementia health states [10-12], and patients with
cognitive impairment have altered response patterns dur-
ing testing of preferences for current health [13]. As part of
a larger study of quality of life in patients with cerebral
aneurysms, we examined the effects of cognitive impair-
ment on preferences as measured with the VAS, SG, TTO,
and WTP.
Methods
Study Population
We enrolled a sample of outpatients with cerebral aneu-
rysms from the University of Pittsburgh Medical Center
neurosurgery clinics between June 2001 and February
2004. All neurosurgery clinic patients with a cerebral
aneurysm were eligible for inclusion in the study, includ-
ing patients with a newly diagnosed symptomatic or inci-
dental aneurysm, patients being followed for a known
aneurysm, and patients who had recently undergone elec-
tive or emergency aneurysm treatment. After obtaining
informed consent, the patients underwent a structured
interview administered by a research assistant to collect
information on demographics, personal habits, comorbid
diseases, cognitive functioning, and preferences. Addi-
tional data were abstracted from paper and electronic
medical records. The protocol was approved by the insti-
tutional review boards (IRB) of Yale University and the
University of Pittsburgh. Patients received $25 as compen-
sation for completing the interview. Our IRB has deter-
mined that payments of this amount are not coercive, and
the payments help maximize the participation of the full
spectrum of eligible patients.
Preference Testing
Preferences for the subjects' current state of health were
assessed in order with the VAS, SG, TTO, and WTP. The
VAS, SG, and TTO were anchored by "perfect health" and
"death." Perfect health was defined as "The best possible
health that you can imagine. You are cured of your brain
aneurysm, and you are cured of all other health prob-
lems." Subjects were given a card printed with the anchor
point definition as a mnemonic. We used iMPACT3 soft-
ware [14] for SG and TTO testing, a paper and pencil
instrument for the VAS, and a custom Visual Basic pro-
gram to assess WTP. A research assistant performed prefer-
ence testing using a script, and recorded when the subject
had difficulty understanding or completing one or more
of the four preference assessment tasks.
Visual Analogue Scale
Subjects were asked to value their current health by plac-
ing a mark on a 10 cm line anchored by the words "death"
and "perfect health" [1]. Preferences were calculated as the
ratio of the distances from death to current health and
death to perfect health.
Standard Gamble
Subjects were offered a choice between living in their cur-
rent state of health or accepting a hypothetical treatment
for all of their health problems [2]. The treatment had two
possible outcomes: "death" or "perfect health." The prob-
abilities of death and cure were varied systematically using
a ping-pong technique [15] until the subject was indiffer-
ent between their current health and the treatment. The
probability of dying was represented graphically on the
computer screen by blackening out a corresponding pro-
portion of a grid of 100 faces. The iMPACT3 software per-
mitted probabilities to vary by 1%. The patient's
preference score was then calculated as the probability of
perfect health at the indifference point.
Time Trade-Off
Subjects were offered a choice between continuing in their
current state of health or reducing their life span by trading
off years of life in exchange for perfect health [3]. The
number of years required to obtain perfect health was sys-
tematically varied using a ping-pong technique until the
subject was indifferent between their current health and the
trade-off. We presented all subjects with a 20-year life
expectancy, the maximum permitted by the iMPACT3 soft-
ware; the minimal incremental change permitted by the
iMPACT3 software was 1 year, the equivalent of 0.05 utility
units. The relationships between 20 years of life in current
health, reduced life expectancy in disease-free health, and
time lost from early death were displayed by horizontal
bars on the computer screen. The patient's preference was
calculated as the ratio between time in perfect health and
time in current health at the indifference point.
Willingness to Pay
We used a closed-ended contingent valuation WTP bid-
ding method to determine WTP for a hypothetical treat-
Health and Quality of Life Outcomes 2009, 7:1 />Page 3 of 9
(page number not for citation purposes)
ment resulting in perfect health [4]. We asked subjects to
imagine that they could purchase this treatment with a
single payment. Subjects were encouraged to consider the
financial consequences of buying the treatment by read-
ing the following statement: "To pay for your treatment, you
might use your savings, your present household income, loans
that you would have to pay back, and possible future increases
in your income after you have perfect health." The interviewer
then quoted a series of prices to the subject, and for each
amount the subject was asked: "Would you be willing to pay
$X for a cure for your health problems?" A computer program
calculated each successive price offer based on an algo-
rithm incorporating annual household income and the
subject's last response. Subjects were first asked if they
were willing to pay $1. If they were willing to pay $1 (>
98% were), the next price offer was the equivalent value of
1 month's income. Offers were then systematically
increased or decreased until convergence on a final mon-
etary value was reached. The maximum WTP value per-
mitted was 10 times the subject's own annual household
income.
Mini-Mental State Examination
After assessments of health values, the interviewer admin-
istered the MMSE [16], an 11-item test of cognitive func-
tion consisting of 7 tasks designed to measure orientation,
memory, attention, and naming, and the ability to follow
verbal and written commands, write a sentence spontane-
ously, and copy a complex polygon. The tasks are scored
individually, and scores are summed to yield the standard
composite score (range from 0–30). Lower scores repre-
sent worse cognitive functioning, and scores < 24 are con-
sidered indicative of cognitive impairment. The MMSE
has been used to assess cognitive functioning in patients
with cerebral aneurysms [9,17-20].
Data Analysis
Categorical variables were tabulated, and means, standard
deviations, and medians were calculated for continuous
variables. Characteristics of study patients and excluded
patients (i.e., those who did not complete all study instru-
ments) were compared by using Fisher's exact test for cat-
egorical variables and the Mann-Whitney U test for
continuous variables. The distributions and variances of
preferences of unimpaired and cognitively impaired
patients were compared using the Kolmogorov-Smirnov
test and the folded F test, stratified by preference measure-
ment tool. The correlations between preference measure-
ment tools were measured using Spearman's rho,
stratified by cognitive status. Four separate stepwise mul-
tivariate linear regression models were developed to
explore the relationships between VAS, SG, TTO, and WTP
health values versus subjects' characteristics (age, sex, race,
education, and income [WTP only]), aneurysm history
(previous SAH, prior aneurysm treatment, history of
stroke), and cognitive impairment (MMSE < 24). Simple
linear regression and a P value < 0.200 were used to select
candidate variables for inclusion in the stepwise regres-
sion models. Statistical significance was defined by a P
value < 0.05; P values ≥ 0.05 but < 0.1 were considered to
indicate a trend.
Results
Study Population
Two hundred seventeen eligible patients consented to par-
ticipate in the study, and 165 (76%) completed the VAS,
SG, TTO, WTP, and MMSE, comprising the study popula-
tion. Incomplete data collection was caused by errors in
survey completion, research staffing issues (i.e., staff vaca-
tion or sick time, simultaneous patients in excess of what
available staff could process), and patient time con-
straints. There was a trend towards excluded patients hav-
ing a lower rate of stroke (11%) compared to the study
patients (22%; P = 0.099). There were no significant dif-
ferences between the 165 study patients and the 52
excluded patients in terms of age, sex, race, education,
income, cognitive impairment, history of SAH, or prior
aneurysm treatment (for all, P ≤ 0.110). The mean (SD)
patient age was 54.2 (12.5) years; 119 (72%) were women
and 151 (92%) were Caucasian (Table 1). Eighty-five
patients (52%) had a history of SAH, 112 (68%) had
undergone previous aneurysm treatment, and 35 (22%)
had a history of stroke.
Cognitive Impairment
The mean (SD) MMSE score was 27.5 (2.6), and 11 (7%)
patients had an MMSE score < 24 consistent with cogni-
tive impairment. There was no association between a his-
tory of stroke and cognitive impairment (P = 0.451).
Twenty patients (12%) had difficulty understanding or
completing one or more preference assessments; however,
there was no association between difficulty understanding
or completing preference instruments and cognitive
impairment (P = 1.000).
Preferences for Current Health
The median (intra-quartile range) for each of the prefer-
ence measures were: VAS: 0.70 (0.52, 0.81), SG: 0.86
(0.70, 0.97), TTO: 0.90 (70, 1.00), and WTP: $35,000
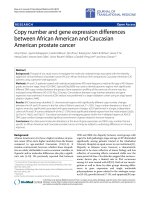
($6,400, $153,500). A comparison of histograms of each
preference measure stratified by cognitive functioning
revealed differences in location and distribution of
responses (Figure 1). Preferences of patients with normal
cognitive functioning had typical skewed-normal (VAS)
or skewed (SG, TTO, WTP) distributions with a modal
response near perfect health. In contrast, patients with
cognitive impairment showed significantly different pat-
terns for VAS (i.e., a quasi-normal distribution with
modal values near 0.5; d = 0.461, P = 0.012) and SG
(quasi-bimodal distribution with peaks near 0.0 and 1.0,
Health and Quality of Life Outcomes 2009, 7:1 />Page 4 of 9
(page number not for citation purposes)
d = 0.429, P = 0.023), but no difference in TTO (d = 0.188,
P = 0.778) or WTP (d = 0.299, P = 0.216). The folded F test
showed significantly more variance among responses of
cognitively impaired patients compared to unimpaired
patients measured with the SG (0.39 vs. 0.21, F = 3.38 (10,
153), P = 0.001) and TTO (0.36 vs. 0.24, F = 2.26 (10,
153), P = 0.017). There was no difference in the preference
variance of VAS (0.21 vs. 0.20, F = 1.08 (10, 153), P =
0.378) or WTP as a proportion of income (4.0 vs. 4.0, F =
1.00 (10, 153), P = 0.555).
There were marked differences in the correlation matri-
ces of the preference measurement tools when stratified
by cognitive status. In subjects without cognitive impair-
ment, among the six possible pairings of preference
measurement instruments, there were significant corre-
lations between three pairings (VAS:TTO, rho = 0.19, P =
0.018; SG:TTO, rho = 0.36, P < 0.001; SG:WTP, rho = -
0.33, P < 0.001) and a trend towards significance with
another pairing (VAS:WTP, rho = 0.16, P = 0.054). In
subjects with cognitive impairment, there was a signifi-
cant correlation only between VAS and TTO scores (rho
= 0.76, P = 0.023).
Regression Models of Preferences
Visual Analogue Scale
Mean (SD) preferences for current health were 0.67
(0.20), i.e., on average, patients rated their current health
equivalent to 67% of perfect health. There was a signifi-
cant association between lower VAS scores and cognitive
impairment (β = -0.12, P = 0.04, Table 2), but there was
no association between VAS scores and patient character-
istics or aneurysm history.
Standard Gamble
Mean (SD) preferences for current health were 0.78
(0.23), i.e., on average, patients were willing to accept up
to a 22% risk of immediate death in return for a 78%
chance of obtaining perfect health for the rest of their life.
Multivariate regression modelling showed a significant
Table 1: Characteristics of the Study Population
N = 165
Age (years) Mean (SD) 51.2 (12.5)
Range 25 – 90
Sex Female 119 (72%)
Race Non-Hispanic Caucasian 151 (92%)
Other 14 (8%)
Education High school or technical school graduate 149 (91%)
Missing 1 (0.6%)
Annual income* Mean (SD) $41,100 ($33,800)
Missing 8 (5%)
Number of aneurysms 1120 (73%)
2 25 (15%)
315 (9%)
43 (2%)
51 (0.6%)
71 (0.6%)
Aneurysm locations Anterior circulation 210 (87%)
Posterior circulation 32 (13%)
Aneurysm status All aneurysms obliterated 73 (44%)
One or more unsecured aneurysms 92 (56%)
Patients with prior SAH 85 (52%)
Patients with prior aneurysm treatments Surgical clipping 83 (50%)
Endovascular embolization 25 (15%)
Both 4 (3%)
None 53 (32%)
History of stroke 35 (22%)
MMSE assessment of cognitive functioning Mean (SD) 27.5 (2.6)
Impaired (MMSE 0–23) 11 (7%)
Unimpaired (MMSE 24–30) 154 (93%)
2003 $US
SAH = subarachnoid hemorrhage
SD = standard deviation
MMSE = Mini Mental State Examination
Health and Quality of Life Outcomes 2009, 7:1 />Page 5 of 9
(page number not for citation purposes)
independent association between lower SG values and
cognitive impairment (β = -0.23, P = 0.002, Table 2).
There was no association between SG values and patient
characteristics or aneurysm history.
Time Trade-Off
Mean (SD) preferences for current health were 0.80
(0.25), i.e., on average, patients were willing to trade-off
up to 4 years of expected survival to obtain 16 years of per-
Cognitive impairment and preferences for current healthFigure 1
Cognitive impairment and preferences for current health. Histograms stratified by cognitive status illustrating prefer-
ences for current health measured with the visual analogue scale (VAS), standard gamble (SG), time trade off (TTO), and will-
ingness to pay (WTP). Cognitive impairment is defined as a Mini Mental State Examination (MMSE) score < 24.
0 10 20 30 40 50 60 70
0.00 0.20 0.40 0.60 0.80 1.00 0.00 0.20 0.40 0.60 0.80 1.00
MMSE 0-23, impaired MMSE 24-30, normal
Percentage of Patients
Visual Analogue Scale
0 10 20 30 40 50 60 70
0.00 0.20 0.40 0.60 0.80 1.00 0.00 0.20 0.40 0.60 0.80 1.00
MMSE 0-23, impaired MMSE 24-30, normal
Percentage of Patients
Standard Gamble
Graphs by MMSE, cat.
0 10 20 30 40 50 60 70
0.00 0.20 0.40 0.60 0.80 1.00 0.00 0.20 0.40 0.60 0.80 1.00
MMSE 0-23, impaired MMSE 24-30, normal
Percentage of Patients
Standard Gamble
0 10 20 30 40 50 60 70
0.00 0.20 0.40 0.60 0.80 1.00 0.00 0.20 0.40 0.60 0.80 1.00
MMSE 0-23, impaired MMSE 24-30, normal
Percentage of Patients
Time Trade Off
0 10 20 30 40 50 60 70
0 2 4 6 8 10 0 2 4 6 8 10
MMSE 0-23, impaired MMSE 24-30, normal
Percentage of Patients
Ratio WTP/Income
Table 2: Linear Regression Models of Patient Preferences
β Coefficients Final Model
Preference Measure Cognitive impairment Prior aneurysm treatment Income (2003 $US) Constant R
2
F
Visual Analogue Scale -0.12* - - 0.68*** 0.02 0.048
Standard Gamble -0.23** - - 0.79*** 0.06 0.002
Time Trade-Off -0.17* 0.08* - 0.75*** 0.04 0.028
Willingness to Pay
†
2.02*** $34,000
†
0.13 < 0.001
* P < 0.05
** P < 0.01
*** P < 0.001
†
2003 $US
Health and Quality of Life Outcomes 2009, 7:1 />Page 6 of 9
(page number not for citation purposes)
fect health, followed by death. There was a significant
independent association between lower TTO values and
cognitive impairment (β = -0.17, P = 0.035), and an
absence of previous aneurysm treatment (β = -0.08, P =
0.044; Table 2). There was no association between TTO
values and patient characteristics or aneurysm history.
Willingness to Pay
Mean (SD) preferences for current health were $116,200
($184,300), i.e., on average, patients were willing to pay
up to 2.8 times their annual income to obtain perfect
health. There was a significant association between higher
WTP values (corresponding to lower health values) and
greater income (β = 2.02, P < 0.001; Table 2). There was
no association between WTP values and cognitive impair-
ment, age, sex, race, education, or aneurysm history.
Discussion
We measured preferences for current health using the VAS,
SG, TTO, and WTP in a population of patients with cere-
bral aneurysms. We then looked at the association
between preference values and cognitive functioning as
assessed with the MMSE, patient characteristics, and aneu-
rysm history. The MMSE classified 7% of our study popu-
lation as cognitively impaired. The distributions of
responses were different for unimpaired and cognitively
impaired patients for the VAS, SG, and TTO. Cognitive
impairment was associated with significant reduction in
preferences for current health measured with the VAS, SG,
and TTO. There was no association between cognitive
impairment and difficulty in understanding or complet-
ing the preference measurement task.
There are several possible reasons that preference scores
were lower in our patients with cognitive impairment.
Patients with cognitive impairment may actually value
their health state less because it includes a component of
cognitive impairment. Alternatively, cognitive impair-
ment may alter how patients respond to VAS, SG, and TTO
and testing per se, biasing their responses downward inde-
pendent of their "true" preferences. The two explanations
are not mutually exclusive, and both could be operating in
an additive or synergistic fashion. If our current measure-
ment tools cannot accurately measure preferences in
patients with cognitive impairment, then measuring the
preferences of impaired individuals will require the devel-
opment and validation of new instruments, and in the
interim these individuals should be identified and
excluded from preference analyses.
Cognitive impairment may well diminish preferences for
current health – preferences vary with a variety of subject
characteristics such as demographics [21,22], comorbid
conditions [21,22], measurement instrument [23-25],
mode of administration – computer versus personal inter-
view [26], the population being tested – individuals with
the condition of interest often provide higher values than
others [27-29], and scale anchor points [30-32]. Neu-
mann et al. used the Health Utilities Index Mark II to
assess health values for Alzheimer's dementia from car-
egivers [10]. Health values were inversely related to
patient health, ranging from 0.73 for questionable
dementia to 0.14 for terminal dementia. Ekman and col-
leagues used the TTO and a postal survey to measure pref-
erences for mild cognitive impairment and mild,
moderate, and severe dementia health states in a cross sec-
tion of the Swedish population [12]. Preferences varied
inversely with cognitive functioning, ranging from 0.82
for mild cognitive impairment to 0.25 for severe demen-
tia.
Jonsson and co-workers used the EuroQol 5D to measure
preferences for current health in patients with Alzheimer's
disease and proxy valuations from their primary caregivers
[11]. Patient preferences varied little across MMSE-based
severity levels, averaging 0.83. Proxy valuations were
lower than patients' and varied inversely with the degree
of dementia (range 0.69 for MMSE > 25 to 0.33 for MMSE
< 10). In our regression models, cognitive impairment
was associated with a 0.12 – 0.23 decrease in preference
values, a substantial effect size. The consistent effect of
cognitive impairment on preferences measured with three
different techniques – SG, TTO, VAS – that differ widely in
their cognitive demands provides cross-validating evi-
dence in favour of a real detrimental effect of cognitive
impairment on preferences for current health. We have no
ready explanation why WTP preferences were not affected
by cognitive impairment.
Cognitive impairment might interfere with comprehen-
sion and processing of information required to complete
preference measurement tasks, leading to biased prefer-
ence values. Woloshin and colleagues have shown that
numeracy affects preferences measured with the SG, TTO,
and VAS [33]. Bravata and colleagues showed that, even
after excluding individuals with cognitive impairment
based on the MMSE, the remaining subjects with rela-
tively low MMSE scores were more likely to provide uni-
form preference values equal to 1.0 when asked to
evaluate multiple hypothetical health states [13]. We
found several differences between the patterns of
responses of patients with cognitive impairment and
those of unimpaired patients. The distributions of
responses for our unimpaired subjects followed skewed-
normal or skewed distributions with modal values at or
near perfect health. In contrast, the preference distribu-
tions of our cognitively impaired subjects had non-stand-
ard morphologies and greater variance. This difference
suggests that some cognitively impaired subjects may not
have understood the test and given extreme or random
Health and Quality of Life Outcomes 2009, 7:1 />Page 7 of 9
(page number not for citation purposes)
responses (SG, TTO) or responses tending towards the
middle of the visual scale (VAS). This pattern would result
in lower mean preference scores compared to unimpaired
patients, and may account for some of the differences
between the two groups.
If there is a bias in preference reporting/measurement
associated with cognitive impairment, one solution
would be to exclude individuals with cognitive impair-
ment from testing. Such a policy could be problematic
for any assessments of societal preferences (which are
recommended for use in cost-effectiveness analyses
[23]), since it would exclude a substantial portion of the
population – for example, an estimated 4.5 million peo-
ple in the United States are afflicted with Alzheimer's dis-
ease [34]. The identification of cognitively impaired
individuals would also be difficult. Adding a cognitive
screening instrument to protocols collecting preference
data would consume study resources and add to
respondent burden. Our study used the MMSE, an 11-
item instrument requiring 5–10 minutes and a face-to-
face encounter. While widely used, the MMSE is not
without its critics, and some authorities have suggested
using a higher threshold to define cognitive impairment
[35,36]. Other "bedside" alternatives to the MMSE are at
least as complex and time consuming [37]. The 11-item
Telephone Interview for Cognitive Status can be used for
remote cognitive testing, but still requires 5–10 minutes
to administer [38].
Twelve percent of our patient population had some dif-
ficulty understanding or completing the preference test-
ing, although all provided responses for the VAS, SG,
TTO, and WTP. Interestingly, we did not find that testing
difficulties was associated with cognitive impairment as
measured with the MMSE. Some investigators have
excluded the responses of individuals who did not
appear to understand the preference testing process
[13,39,40], and others have developed techniques to
detect and minimize inconsistencies during multiple
preference measurements in the same subject [41].
Unfortunately, our study design did not provide us with
sufficient data to allow a confident investigation of the
effects of testing difficulties on preferences. Future inves-
tigations will include a more rigorous assessment of test-
ing difficulties and enable investigation of the
relationship between cognitive impairment and diffi-
culty understanding and completing preference testing.
Most researchers have found that patient preferences vary
depending on the measurement instrument, and our
study is no exception – our patients had SG and TTO pref-
erences significantly greater than VAS preferences (WTP
values have a unique metric that precludes direct compar-
ison with the other preference values).
These ubiquitous discrepancies have lead to a lively
debate about their etiology and significance. Some believe
that the SG is the "gold standard" in measuring patient
preferences because it conforms to the axioms of von Neu-
mann-Morgenstern utility theory; however, it is subject to
bias and framing effects, and can be distorted by risk aver-
sion [42-44]. The TTO has roots in decision theory and
was developed as a more "user friendly" alternative to the
SG, but TTO values can be confounded by time prefer-
ences [45-48]. While it is convenient to administer, the
VAS has been criticized for lacking the theoretical under-
pinnings of the SG or TTO and may have limited applica-
bility [49]. The VAS does not incorporate risk of death
(SG) or certain reduced survival (TTO). Since most sub-
jects are risk averse and somewhat reluctant to trade years
of life, the VAS generally yields lower scores that the SG or
TTO [50]. Finally, WTP responses are affected by eco-
nomic resources, and WTP preferences are not expressed
on a zero to one ratio scale, making it difficult to incorpo-
rate WTP values into decision analytic models [51,52].
Variations in risk aversion, time preferences, and eco-
nomic resources are all likely contributing to the differ-
ences in preference values provided by the four
instruments. We do not know whether one or more of
these factors are asymmetrically distributed across our
cognitively impaired and unimpaired patients, and it is
unclear whether or how much these factors may be con-
tributing to preference differences between cognitively
impaired and unimpaired patients.
Limitations
Our sample population was derived from patients with
cerebral aneurysms under care at a single university hospi-
tal, and thus the results may not be generalizable to other
patient populations. Logistical difficulties precluded the
enrolment of all eligible patients into our study, and some
who did enrol failed to complete all surveys. Relatively
few of our patients were cognitively impaired, thus limit-
ing our statistical power to determine the effects of cogni-
tive impairment on preference measurements. Our
patients exhibited only mild cognitive impairment: the
mean MMSE score was 27.5, only 7% were cognitively
impaired (MMSE score < 24), and only 1 patient had a
MMSE < 20. In contrast, patients with Alzheimer's disease
enrolled in studies have substantially lower mean MMSE
scores (i.e., in the low 20's or high teens [53,54]); there-
fore our findings may not generalize to patients such as
these with more severe cognitive deficits. Our data collec-
tion on subject difficulties with understanding or com-
pleting the preference instruments was sparse, limiting
our analysis of testing difficulties.
Conclusion
In our study population of patients with cerebral aneu-
rysms, cognitive impairment was associated with lower
Health and Quality of Life Outcomes 2009, 7:1 />Page 8 of 9
(page number not for citation purposes)
preferences for current health when measured with three
popular instruments – the standard gamble, time trade-
off, and visual analogue scale. Further work is needed to
assess whether lower preference values in these individu-
als represent a "real" decrement in preferences for a health
state that includes a component of cognitive impairment
or are the result of measurement bias related to cognitive
deficits, or a combination of the two.
Abbreviations
MMSE: Mini Mental State Examination; SAH: subarach-
noid hemorrhage; SD: standard deviation; SG: standard
gamble; TTO: time trade-off; VAS:visual analogue scale;
WTP: willingness to pay.
Competing interests
The authors declare that they have no competing interests.
Authors' contributions
JTK was responsible for primary study design, supervision
of data collection, primary data cleaning and analysis,
manuscript drafting, and manuscript submission. JS
served as a methodologic consultant, assisted with data
analysis and interpretation, and participated in manu-
script editing. MSR was a methodologic consultant,
assisted with data analysis and interpretation, and partic-
ipated in manuscript editing.
Acknowledgements
None.
References
1. Streiner DL, Norman GR: Health Measurement Scales. A practical guide
to their development and use New York: Oxford University Press;
1989.
2. von Neumann J, Morgenstern O: Theory of Games and Economic Behav-
ior New York: Wiley; 1953.
3. Torrance GW, Thomas WH, Sackett DL: A utility maximization
model for evaluation of health care programs. Health Serv Res
1972, 7:118-133.
4. Diener A, O'Brien B, Gafni A: Health care contingent valuation
studies: a review and classification of the literature. Health
Econ 1998, 7:313-326.
5. Rinkel GJ, Djibuti M, Algra A, van GJ: Prevalence and risk of rup-
ture of intracranial aneurysms: a systematic review. Stroke
1998, 29:251-256.
6. McCormick WF, Nofzinger JD: Saccular intracranial aneurysms:
an autopsy study. J Neurosurg 1965, 22:155-159.
7. Inagawa T, Hirano A: Autopsy study of unruptured incidental
intracranial aneurysms. Surg Neurol 1990, 34:361-365.
8. Kreiter KT, Copeland D, Bernardini GL, Bates JE, Peery S, Claassen J,
et al.: Predictors of cognitive dysfunction after subarachnoid
hemorrhage. Stroke 2002, 33:200-208.
9. The International Study of Unruptured Intracranial Aneurysm Investi-
gators: Unruptured intracranial aneurysms – risk of rupture
and risks of surgical intervention. N Engl J Med 1998,
339:1725-1733.
10. Neumann PJ, Kuntz KM, Leon J, Araki SS, Hermann RC, Hsu MA, et
al.: Health utilities in Alzheimer's disease: a cross-sectional
study of patients and caregivers. Med Care 1999, 37:27-32.
11. Jonsson L, Andreasen N, Kilander L, Soininen H, Waldemar G, Nyg-
aard H, et al.: Patient- and proxy-reported utility in Alzheimer
disease using the EuroQoL. Alzheimer Dis Assoc Disord 2006,
20:49-55.
12. Ekman M, Berg J, Wimo A, Jonsson L, McBurney C: Health utilities
in mild cognitive impairment and dementia: a population
study in Sweden. Int J Geriatr Psychiatry 2006, 22(7):649-655.
13. Bravata DM, Nelson LM, Garber AM, Goldstein MK: Invariance and
inconsistency in utility ratings. Med Decis Making 2005,
25:158-167.
14. Lenert LA, Michelson D, Flowers C, Bergen MR: IMPACT: an
object-oriented graphical environment for construction of
multimedia patient interviewing software. Proc Annu Symp
Comput Appl Med Care 1995:319-323.
15. Lenert LA, Cher DJ, Goldstein MK, Bergen MR, Garber A: The
effect of search procedures on utility elicitations. Med Decis
Making 1998, 18:76-83.
16. Folstein MF, Folstein SE, McHugh PR: "Mini-mental state": a prac-
tical method for grading the cognitive state of patients for
the clinician. J Psychiatr Res 1975, 12:189-198.
17. Kim DH, Haney CL, Van GG: Utility of outcome measures after
treatment for intracranial aneurysms: a prospective trial
involving 520 patients. Stroke 2005, 36:792-796.
18. Nozaki T, Sakai N, Oishi H, Nishizawa S, Namba H: Cholinergic
dysfunction in cognitive impairments after aneurysmal sub-
arachnoid hemorrhage. Neurosurg 2002, 51:944-947.
19. Saciri BM, Kos N: Aneurysmal subarachnoid haemorrhage:
outcomes of early rehabilitation after surgical repair of rup-
tured intracranial aneurysms. J Neurol Neurosurg Psychiatry 2002,
72:334-337.
20. King JT Jr, DiLuna ML, Cicchetti DV, Tsevat J, Roberts MS: Cognitive
functioning in patients with cerebral aneurysms measured
with the mini mental state examination and the telephone
interview for cognitive status. Neurosurg 2006, 59:803-810.
21. Fryback DG, Dasback EJ, Klein R, Klein BEK, Peterson K, Martin PA:
The Beaver Dam health outcomes study: Initial catalog of
health-state quality factors. Med Decis Making 1993, 13:89-102.
22. Kind P, Dolan P, Gudex C, Williams A: Variations in population
health status: results from a United Kingdom national ques-
tionnaire survey. BMJ 1998, 316:736-741.
23. Gold MR, Siegel JE, Russell LB, Weinstein MC: Cost-effectiveness in
Health and Medicine New York: Oxford University Press; 1996.
24. Neumann PJ, Goldie SJ, Weinstein MC: Preference-based meas-
ures in economic evaluation in health care. Annu Rev Public
Health 2000, 21:587-611.
25. Stiggelbout AM, Kiebert GM, Kievit J, Leer JW, Stoter G, De Haes JC:
Utility assessment in cancer patients: adjustment of time
tradeoff scores for the utility of life years and comparison
with standard gamble scores. Med Decis Making 1994, 14:82-90.
26. Bremner KE, Chong CA, Tomlinson G, Alibhai SM, Krahn MD: A
review and meta-analysis of prostate cancer utilities. Med
Decis Making 2007, 27:288-298.
27. Gabriel SE, Kneeland TS, Melton LJ III, Moncur MM, Ettinger B, Toste-
son AN: Health-related quality of life in economic evaluations
for osteoporosis: whose values should we use? Med Decis Mak-
ing 1999, 19:141-148.
28. Sackett DL, Torrance GW: The utility of different health states
as perceived by the general public. J Chronic Disorders 1978,
31:697-704.
29. Polsky D, Willke RJ, Scott K, Schulman KA, Glick HA: A compari-
son of scoring weights for the EuroQol derived from patients
and the general public. Health Econ 2001, 10:27-37.
30. Fryback DG, Lawrence WF, Martin PA, Klein R, Klein BE: Predicting
Quality of Well-being scores from the SF-36: results from
the Beaver Dam Health Outcomes Study. Med Decis Making
1997, 17:1-9.
31. Torrance GW, Furlong WJ, Feeny D, Boyle MH: Multi-attribute
preference functions: health utilities index. PharmacoEconomics
1995, 9:503-520.
32. King JT Jr, Styn MA, Tsevat J, Roberts MS: "Perfect health" versus
"disease free": the impact of anchor point choice on the
measurement of preferences and the calculation of disease-
specific disutilities. Med Decis Making
2003, 23:212-225.
33. Woloshin S, Schwartz LM, Moncur M, Gabriel S, Tosteson AN:
Assessing values for health: numeracy matters. Med Decis
Making 2001, 21:382-390.
34. Hebert LE, Scherr PA, Bienias JL, Bennett DA, Evans DA: Alzheimer
disease in the US population: prevalence estimates using the
2000 census. Arch Neurol 2003, 60:1119-1122.
Publish with BioMed Central and every
scientist can read your work free of charge
"BioMed Central will be the most significant development for
disseminating the results of biomedical research in our lifetime."
Sir Paul Nurse, Cancer Research UK
Your research papers will be:
available free of charge to the entire biomedical community
peer reviewed and published immediately upon acceptance
cited in PubMed and archived on PubMed Central
yours — you keep the copyright
Submit your manuscript here:
/>BioMedcentral
Health and Quality of Life Outcomes 2009, 7:1 />Page 9 of 9
(page number not for citation purposes)
35. Kukull WA, Larson EB, Teri L, Bowen J, McCormick W, Pfanschmidt
ML: The Mini-Mental State Examination score and the clini-
cal diagnosis of dementia. J Clin Epidemiol 1994, 47:1061-1067.
36. Monsch AU, Foldi NS, Ermini-Funfschilling DE, Berres M, Taylor KI,
Seifritz E, et al.: Improving the diagnostic accuracy of the Mini-
Mental State Examination. Acta Neurol Scand 1995, 92:145-150.
37. Nelson A, Fogel BS, Faust D: Bedside cognitive screening instru-
ments. A critical assessment. J Nerv Ment Dis 1986, 174:73-83.
38. Brandt J, Spencer M, Folstein MF: The telephone interview for
cognitive status. Neuropsychiatr Neuropsychol Behav Neurol 1988,
1:111-117.
39. SUPPORT: Study to understand prognoses and preferences
for outcomes and risks of treatments. Study design. J Clin Epi-
demiol 1990, 43(Suppl):1S-123S.
40. Tsevat J, Dawson NV, Wu AW, Lynn J, Soukup JR, Cook EF: Health
values of hospitalized patients 80 years or older. JAMA 1998,
279:371-375.
41. Lenert LA, Sturley A, Rupnow M: Toward improved methods for
measurement of utility: automated repair of errors in elici-
tations. Med Decis Making 2003, 23:67-75.
42. Tversky A, Kahneman D: The framing of decision and the psy-
chology of choice. Science 1981, 211:453-458.
43. Llewellyn-Thomas H, Sutherland HJ, Tibshirani R, Ciampi A, Till JE,
Boyd NF: The measurement of patients' values in medicine.
Med Decis Making 1982, 2:449-462.
44. Wakker P, Stiggelbout A: Explaining distortions in utility elicita-
tion through the rank-dependent model for risky choices.
Med Decis Making 1995, 15:180-186.
45. Torrance GW, Boyle MH, Horwood SP: Application of multi-
attribute theory to measure social preference for health
states.
Operations Res 1982, 30:1043-1069.
46. Johannesson M, Pliskin JS, Weinstein MC: A note on QALYs, time
tradeoff, and discounting. Med Decis Making 1994, 14:188-193.
47. Nord E: Methods for quality adjustment of life years. Soc Sci
Med 1992, 34:559-569.
48. Richardson J: Cost utility analysis: what should be measured?
Soc Sci Med 1994, 39:7-21.
49. Torrance GW, Feeny D, Furlong W: Visual analog scales: do they
have a role in the measurement of preferences for health
states? Med Decis Making 2001, 21:329-334.
50. Stiggelbout AM: Assessing patient's preferences. In Decision Mak-
ing in Health Care: Theory, Psychology, and Applications Edited by: Chap-
man GB, Sonnenberg FA. Cambridge: Cambridge University Press;
2000:289-312.
51. Gafni A: Willingness to pay. What's in a name? PharmacoEco-
nomics 1998, 14:465-470.
52. King JT Jr, Tsevat J, Lave JR, Roberts MS: Willingness to pay for a
quality-adjusted life year: implications for societal health
care resource allocation. Med Decis Making 2005, 25:667-677.
53. Paulino Ramirez DS, Gil GP, Manuel Ribera CJ, Reynish E, Jean OP,
Vellas B, et al.: The need for a consensus in the use of assess-
ment tools for Alzheimer's disease: the Feasibility Study
(assessment tools for dementia in Alzheimer Centres across
Europe), a European Alzheimer's Disease Consortium's
(EADC) survey. Int J Geriatr Psychiatry 2005, 20:744-748.
54. Small GW, Kaufer D, Mendiondo MS, Quarg P, Spiegel R: Cognitive
performance in Alzheimer's disease patients receiving
rivastigmine for up to 5 years. Int J Clin Pract 2005, 59:473-477.