báo cáo hóa học: " Changes in quality of life among Norwegian school children: a six-month follow-up study" doc
Bạn đang xem bản rút gọn của tài liệu. Xem và tải ngay bản đầy đủ của tài liệu tại đây (322.15 KB, 12 trang )
BioMed Central
Page 1 of 12
(page number not for citation purposes)
Health and Quality of Life Outcomes
Open Access
Research
Changes in quality of life among Norwegian school children: a
six-month follow-up study
Thomas Jozefiak*
1,2
, Bo Larsson
1
and Lars Wichstrøm
3
Address:
1
The Norwegian University of Technology and Science (NTNU), Regional Centre of Child and Adolescent Mental Health, MTFS N-7489,
Trondheim, Norway,
2
Department of Child and Adolescent Psychiatry, St Olavs Hospital, N-7433 Trondheim, Norway and
3
The Norwegian
University of Technology and Science (NTNU), Department of Psychology, N-7491 Trondheim, Norway
Email: Thomas Jozefiak* - ; Bo Larsson - ; Lars Wichstrøm -
* Corresponding author
Abstract
Background: A considerable gap exists in regard to longitudinal research on quality of life (QoL)
in community populations of children and adolescents. Changes and stability of QoL have been
poorly examined, despite the fact that children and adolescents undergo profound developmental
changes. The aims of the study were to investigate short-term changes in student QoL with regard
to sex and age in a school-based sample.
Methods: A representative Norwegian sample of 1,821 school children, aged 8–16 years and their
parents were tested at baseline and 6 months later, using the Inventory of Life Quality for Children
and Adolescents (ILC) and the Kinder Lebensqualität Fragebogen (KINDL). Student response rate
at baseline was 71.2% and attrition over the follow-up period was 4.6%, and 1,336 parents (70%)
completed the follow-up. Change scores between baseline and follow-up evaluations were analysed
by means of ANCOVA in regard to sex and age effects.
Results: Students in the 8
th
grade reported a decrease in QoL over the six-month follow-up period
as compared to those in the 6
th
grade with regard to Family and School domains and total QoL on
the KINDL. For emotional well-being a significant linear decrease in QoL across grades 6
th
to 10
th
was observed. However, student ratings on the Friends and Self-esteem domains did not change
significantly by age. Girls reported a higher decrease in their QoL across all grades over the follow-
up period than did boys in respect of Self-esteem on the KINDL, and an age-related decrease in
total QoL between 6
th
and 8
th
grade on the ILC. Parent reports of changes in child QoL were
nonsignificant on most of the domains.
Conclusion: The observed age and sex-related changes in school children's QoL across the six-
month follow-up period should be considered in epidemiological as well as clinical research.
Background
In spite of no gold standard for the definition of QoL,
there is a broad consensus to regard the concept of QoL as
multidimensional, covering physical, psychological and
social dimensions [1]. Thus, for the purpose of the present
study, we have defined "QoL" as "the subjective reported
well-being in regard to the child's physical and mental
health, self-esteem and perception of own activities (play-
ing/having hobbies), perceived relationship to friends
and family as well as to school."
Published: 4 February 2009
Health and Quality of Life Outcomes 2009, 7:7 doi:10.1186/1477-7525-7-7
Received: 2 May 2008
Accepted: 4 February 2009
This article is available from: />© 2009 Jozefiak et al; licensee BioMed Central Ltd.
This is an Open Access article distributed under the terms of the Creative Commons Attribution License ( />),
which permits unrestricted use, distribution, and reproduction in any medium, provided the original work is properly cited.
Health and Quality of Life Outcomes 2009, 7:7 />Page 2 of 12
(page number not for citation purposes)
Given the profound developmental changes that occur
over relatively short time frames during childhood and
adolescence, it is of particular concern that QoL changes
in community populations of children and adolescents
have been poorly examined. For example, in respect to
family-related QoL, the child's relationship to the parents
during puberty merits further investigation. So far, dra-
matic shifts in conflict behaviour as a function of age or
maturation in childhood and adolescence have not been
found [2]. However, Larson et al. [3] reported that the
amount of time that 5
th
–12
th
grade students spend with
their families decreased considerably during this age
period, indicating disengagement from parents. Accord-
ing to a transformation model [4] adolescents' affect with
family decreases in early adolescence and then increases
in late adolescence [3,5]. Thus, an important develop-
mental task for adolescents is to achieve psychological
independence from parents, while maintaining connect-
edness with them [3], possibly having a negative impact
on family-related QoL.
The subjective well-being related to friends represents
another social life domain often included in QoL assess-
ment of children and adolescents (for an overview of
instruments, see Spieth [6] and Eiser [7]). It has been
shown that parallel to observed changes in the relation-
ship between the adolescent and his/her family, time
spent by the adolescent with friends outside the family
increases with increasing age [4,8]. These extrafamilial
relationships during adolescence often serve the same
functions as familial relationships do during childhood.
Intimacy, mutuality and self-disclosure between friends
peak during adolescence, when developing relations to
significant friends is greater than in other life period [4].
Having friends has been associated with a sense of well-
being [9], and for 4
th
and 8
th
graders, friendship [10] has
been found to be quite stable during a six-month period.
The life domain School represents the third social context
of importance in the assessment of QoL in children and
adolescents. However, the impact of changes occurring in
community populations in the school QoL area is still
poorly investigated. Transitions during early adolescence
from primary to junior high school may also have a nega-
tive influence on the child [11]. School bonding refers to
"connections" that young people have with their schools
and various aspects of their academic lives. It has been
positively linked to student adjustment and perceived
school climate, but inversely correlated with levels of
problem behaviour [12,13]. School bonding has also
been shown to be higher among 6
th
graders than 7
th
or 8
th
graders [13].
The domain Emotional well-being, reflecting normal psy-
chological development in children and adolescents in
different social contexts, is often included in QoL assess-
ment of children and adolescents [6], as well as the Self-
esteem domain [14-16]. Although an extensive meta-anal-
ysis concluded that self-esteem showed substantial conti-
nuity and stability over time [17], self-esteem in some
children may depend on fluctuating social approval from
significant others [18].
Developmental transitions may follow different courses
for girls and boys, also in different cultural contexts. For
example, only Caucasian girls reported a decline in self-
esteem from age 11 to 16 years as compared to black girls
[19]. Generally, in cross-sectional studies of QoL in gen-
eral populations, adolescent girls have reported signifi-
cantly lower quality of life than younger children and
boys [20,21]. To date limited information exists on gen-
der differences and should be further investigated.
While most previous longitudinal research on QoL in
children has focused on various somatic diseases such as
cancer [22], cerebral palsy [23], epilepsy [24], and brain
injury [25], it is important also to evaluate changes of QoL
among children and adolescents in the general popula-
tion, because changes in QoL in clinical populations can-
not be adequately understood without such reference
data. Such information will serve as reference in research
evaluations of drug and psychological interventions [26]
for children typically being conducted within a relative
short time frame. In a longitudinal study, Shek and col-
leagues [27,28] examined family life quality in Chinese
adolescents, and a school-based study [29] in Australia
followed 363 students, primarily girls, aged 10 to 18 years,
over a six-month period in order to examine changes in
their QoL. The results showed that most of the students
reported good to excellent QoL both at baseline and at the
follow-up [29]. However, no specific information was
provided on QoL changes by group or gender related to
developmental issues for adolescents. Overall, the existing
knowledge on the extent and type of short-term QoL
changes in community populations, and how children's
normal development influences their experience of QoL is
very limited.
Given the substantial discrepancy between child and par-
ent reports of child QoL in cross-sectional studies [30-36],
it has been recommended to include both self and parent
by proxy reports in QoL studies of children and adoles-
cents [30,37]. In a recent cross-sectional study [37] we
investigated discrepancies between informants, and
found that parents in the general population evaluated
their children's QoL as higher than did the children them-
selves.
The aims of the present study were to investigate six-
month changes in self- and parent reports of child QoL,
Health and Quality of Life Outcomes 2009, 7:7 />Page 3 of 12
(page number not for citation purposes)
related to sex and age, in a representative school-based
sample of Norwegian students, aged 8–16 years. It was
hypothesized that over the six month follow-up,
(1) increasing age will have a decreasing effect on family-
related QoL, school-related QoL and emotional well-
being; while the students' perceived relationship to
friends and self-esteem will be stable across age-groups.
(2) girls will report lower total QoL levels than boys.
(3) parent by proxy ratings will show fewer significant age
and sex-related changes in child QoL than student reports
on different life domains.
Method
Population, sample selection and subjects
The baseline sample
The students in the county were stratified according to
geography and grade, and 4
th
, 6
th
, 8
th
and 10
th
grades were
included. In the county of Sør-Trøndelag, half of the pop-
ulation lives in typical urban (the city of Trondheim), and
the other half in rural areas. Almost all of students attend
public primary school, consisting of elementary (1
th
to 7
th
grade) and junior high school (8
th
to 10
th
grade). Further,
in Norwegian elementary school, students do not receive
marks. When the data were collected from September
2004 until November 2005, due to a school reform, tradi-
tional classes both in elementary and junior high school
were dispersed and reorganized in grade cohorts, i.e. all
students attending a specific grade received lessons some-
times together or separately in different minor groups.
The national Norwegian database for primary education
(GSI) was used to enumerate all pupils attending any of
the targeted grades in all schools and relevant region.
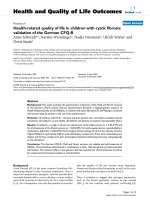
Thus, 426 school grade cohorts were identified. Using a
cluster sampling technique, 61 were randomly selected for
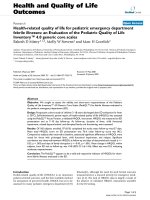
the study (see subject flow in figure 1). Thus, 1,997 stu-
dents (990 girls and 1,007 boys) aged 8–16 years were
finally included in the study, yielding a response rate of
71.2% (of 2804). Table 1 shows the number and age
range of included students per grade. For 1,777 (89%) of
the 1,997 students, there was at least one caregiver who
filled out the Inventory of Life Quality for Children (ILC)
[38], and for 1,743 (87%) students at least one caregiver
filled out the Kinder Lebensqualität Fragebogen (KINDL)
[14,15]. Exclusion criteria for the study were one or more
of the following: insufficient competence in the Norwe-
gian language or having a developmental level corre-
sponding to more than two years below the relevant
grade. To decide if a student fulfilled the exclusion criteria,
the local coordinator (a teacher at each school), discussed
possible students being excluded from the study with the
principal investigator (the first author).
The urban-to-rural residency ratio of the included chil-
dren in the main study sample was 1:1, compared to 1.2 :
1 in the county. Further, students from 24 of the 25
municipalities in the county were included. The male-to-
female ratio was almost identical in the study sample
(1.02:1) compared to the county (1.03:1). The mean age
of included students was 12.1 (SD = 2.3), and the number
of included students per grade ranged from 462 to 538
(see Table 1). Thus, the baseline sample was approxi-
mately representative in regard to geography, but also for
age, and grade.
The aims of the baseline study [37] were to assess psycho-
metric properties of two translated QoL instruments, the
KINDL and ILC, and to investigate factors influencing the
degree of discrepancy in regard to child and parent by
proxy ratings of child QoL.
The six-month follow-up sample
Students
Of students eligible for the 6-month follow-up, 1821
(95.4% of the baseline sample) completed the assessment
(see Figure 1). This sample was still representative for the
population with regard to urban-to-rural resident ratio (1
: 1.1) and sex ratio (1 : 1.01). The number of 8
th
grade stu-
dents were reduced (see Table 1) due to attrition and 88
students who were not eligible due to 2 or 4-week test-
retest evaluation (see Figure 1). Student mean age was
almost identical in the follow-up (Mean 12.0, SD = 2.3) to
baseline assessment (Mean 12.1, SD = 2.3). There was no
significant difference in total QoL baseline scores on the
KINDL between participants and non-participants at the
six-month follow-up (Mean = 70.5, SD = 12.5; Mean =
69.1, SD = 13.0, respectively). The mean interval between
baseline and follow-up was 180 days (SD = 9.1), and time
intervals (< 0.5 SD, ± 0.5 SD and > 0.5 SD) were unrelated
to changes in KINDL QoL scores.
Parents
At the follow-up, 1,336 students (70% of 1,909 eligible
students) had at least one parent who completed the
measure. Results of independent t-test showed that par-
Table 1: Number of subjects by grade and age at baseline and 6-
month follow-up
Baseline Six-month follow-up
Grade Age (years) n n
4
th
8–10 505 490
6
th
10–12 462 447
8
th
12–14 492 383
10
th
14–16 538 501
Total 8–16 1997 1821
Health and Quality of Life Outcomes 2009, 7:7 />Page 4 of 12
(page number not for citation purposes)
Flowchart of sample selectionFigure 1
Flowchart of sample selection.
Health and Quality of Life Outcomes 2009, 7:7 />Page 5 of 12
(page number not for citation purposes)
ents who participated in both the baseline and follow-up
evaluations reported significantly higher KINDL total QoL
scale scores at baseline (Mean = 76.4, SD = 9.7) than non-
participants at the follow-up (Mean 74.8, SD = 9.7),
t(1681) = 2.6, p < 0.01.
Given low reliability on some of the KINDL subscales for
the youngest children [37], we included 4
th
graders only
on the Self-esteem, Family and Total QoL scales. Due to
low test-retest reliability the KINDL Physical well-being
scale was not included in the analysis, but was used in cal-
culating KINDL QoL total score for all grades.
Assessment procedures
One teacher at each school was appointed as a project
coordinator and given information about the research
project and procedures for collecting the data. The coordi-
nator informed the students about the project and also
sent a standard information letter to their parents. The
principal investigator (the first author) or a research assist-
ant was present at each school when the students filled
out the questionnaires. They stressed informant confiden-
tiality, responded to questions, and read questions aloud
for students with reading problems and all pupils in the
4
th
grade. Completed questionnaires marked with an ID
number were collected in sealed envelopes by the
researchers. A total of 105 students being absent on the
day of data collection at follow-up completed the ques-
tionnaires individually during the following week under
the supervision of the local coordinator.
Measures
The Inventory of Life Quality in Children and Adolescents (ILC)
The ILC, consists of 15 items [38], and was developed as a
short and practical assessment tool for use in child mental
health settings. A Norwegian translation of the generic 7-
item ILC for children, adolescents and their parents was
used to assess QoL over the past week [37]. The ILC
includes one global QoL item, and six items addressing
school performance, family functioning, social integra-
tion, interests and hobbies, physical health, and the
child's mental health areas. Each item is rated on a 1 – 5
scale (1 = very good, 5 = very bad). The ILC LQ0-100 score
was obtained by summing the 7 items, and transformed
into a 0–100 scale in accordance with the originator [38].
Thus, 0 indicates very low and 100 very high QoL.
In school populations, the ILC has shown acceptable
internal consistency, with alpha of .63 (alpha = .76 for the
parent version). Test-retest reliability was r = .72 for the
ILC LQ0-100 score (r = .80 for the parent version) [38]. In
a study of German child psychiatric outpatients (N = 728)
effect sizes were reported to be d = .30 to .54 for single
items in respect of significant QoL changes at a one-year
follow-up [39]. The ILC has also shown a moderate con-
vergent validity with the KINDL (r = .65) [14,40]. In the
Norwegian translation, student ratings on the ILC LQ0-
100 and the KINDL total QoL scale correlated moderately
with each other (r = .69). The Norwegian version of the 7-
item ILC has shown satisfactory internal consistency for
the 7 items (alpha from 0.64 to 0.81 for the 4
th
to 10
th
grade, respectively) and two-week test-retest reliability of
0.86 (ICC) for the ILC LQ0-100 score [37]. The parent ver-
sion has also shown satisfactory internal consistency and
test-retest reliability [37].
The Kinder Lebensqualität Fragebogen (KINDL)
The KINDL [14,15] is a QoL measure developed for the
assessment of children and adolescents both in the gen-
eral population and clinical samples. Here, the 8–12 and
13–16 year age forms were used as well as a proxy version
completed by the parents. The forms consist of 24 items
equally distributed into the following six subscales: Phys-
ical well-being, emotional well-being, self-esteem, family,
friends, and school. Each item addresses the child's expe-
riences over the past week and is rated on a 5-point scale
(1 = never, 5 = always) with item 1–3, 6–8, 15–16, 20 and
23–24 scores reversed. Mean item scores are calculated for
all subscales and the total scale, which are transformed to
a 0–100 scale, 0 indicates very low and 100 very high QoL.
Correlations with comparable QoL scales [16] have
shown acceptable convergent validity as well as satisfac-
tory discriminant validity [15]. In regard to sensitivity, the
KINDL showed significant changes after a six-week inpa-
tient rehabilitation program for chronically ill children
(effect sizes from d = .02 to .69, and .24 for the total QoL
scale and the whole sample) [41]. In the original German
version, Cronbach's alpha was approximately .70 for most
subscales, while the overall scale had an alpha value over
.80. In the Norwegian version [37], generally satisfactory
alpha values were found (from .64 to .81 for the subscales,
and .83 to .89 for the total scale and children in the 4
th
to
10
th
grades). However, low alpha values were obtained for
the School, Friends, and Emotional well-being subscales
and 4
th
graders. Except for the physical well-being scale
(ICC = .43), two-week test-retest coefficients were good to
excellent (ICC from .70 to 87). The Parent version showed
satisfactory alpha values and test-retest reliability [37].
The ILC and the KINDL measures were developed for dif-
ferent research and clinical purposes, they differ in items,
content and length. To gain a comprehensive picture of
various aspects of short-term changes in QoL among
school children in our investigation, we used both instru-
ments.
Socio-demographic information on age and sex was
obtained from the students.
Health and Quality of Life Outcomes 2009, 7:7 />Page 6 of 12
(page number not for citation purposes)
Ethics
Before students could participate in the study, their par-
ents had to give their written consent. The Norwegian Eth-
ical Committee of Medical Research and the Norwegian
Data Inspectorate approved of the research protocol.
Statistical analysis
Missing values were substituted by using expectation max-
imization (EM) procedures. Group means were compared
by independent t-test or ANOVA. Differences between
baseline (T1) and retest raw scores (T2) were calculated
(by subtracting T1 from T2 scores) and ranged from -100
to +100. These scores were used as dependent variables in
ANCOVA with T1 scores as covariates. Effect sizes for
between-group differences were calculated by means of
eta squared (ES) as recommended by Cohen [42]. An
alpha level of p < 0.05 indicated statistical significance,
except for overall main and interaction effects in multiple
ANCOVA in which an alpha of < 0.01 was set due to mul-
tiple comparisons. All ANCOVA involving more than two
groups were conducted using "repeated contrasts", i.e.,
one group was compared to its preceding group and the
next group, with a hypothesis of linearity of age-related
means. Possible cluster effects have previously been exam-
ined in the baseline study [37] by means of Mixed Linear
Models. The results showed that only 3.6% of the total
variance of the ILC LQ 100 scores, and 6.5% of the total
KINDL Total QoL scores could be explained by differences
between the cohorts in the study.
Results
Descriptive information on the various KINDL subscales
and on the ILC are presented in Tables 2, 3 and 4. Mean
change scores (i.e. means of differences in raw scores
between baseline and follow-up) and results of ANCOVA
are shown in Tables 5, 6 and in Figure 2. It should be
noted that corrected mean changes in baseline-follow-up
differences were obtained in ANCOVA using baseline
scores as covariates.
Student report
Family-related QoL
Across the six-month follow-up a significant main effect
for grade, [F (3, 1761) = 19.86, p < 0.001] was found (ES
= 3.3%). Subsequent posthoc comparisons showed that
children in the 8
th
grade reported a significantly (p <
0.001) greater decrease in family-related QoL than did
those in the 6
th
grade over the six-month follow-up period
(see Table 5).
Friends
No significant effect for sex, grade or grade by sex interac-
tion was observed (see Table 5).
School
Across the six-month follow-up period, a significant main
effect for grade, [F (2, 1275) = 5.57, p < 0.01] (ES = 1%)
was found. Subsequent posthoc comparisons showed that
children's reported QoL in respect to school in 8
th
grade
decreased significantly (p < 0.05) more during the follow-
up period as compared to those in 6
th
grade (see Table 5).
Emotional well-being and self-esteem
Across the six-month follow-up period, a significant main
effect for grade [F (2, 1275) = 14.67, p < 0.001] (ES =
2.2%) was observed for emotional well-being. In subse-
quent posthoc comparisons a significant linear decrease
was found, in that the emotional well-being of children in
the 10
th
grade decreased (p < 0.05) more than those in the
Table 2: Mean raw scores on KINDL subscales: Student report
by grade
Mean Standard deviation
Grade T1 T2 T1 T2
Family
10
th
71.5 72.1 20.3 19.7
8
th
76.2 74.8 17.7 19.1
6
th
79.4 81.7 15.1 15.2
4
th
81.7 82.7 16.1 14.1
1
Total 77.2 77.8 17.9 17.7
Friends
10
th
73.2 74.4 16.6 16.2
8
th
74.9 75.9 15.7 16.4
6
th
77.4 78.9 16.6 16.3
2
Total 75.1 76.4 16.4 16.4
School
10
th
58.6 60.2 19.3 18.6
8
th
65.6 65.2 17.6 16.9
6
th
70.1 70.3 16.5 16.7
2
Total 64.4 65.0 18.6 18.0
Emotional well-being
10
th
74.0 74.1 16.0 16.3
8
th
77.4 77.5 14.1 15.5
6
th
77.1 80.5 14.3 13.1
2
Total 76.0 77.2 15.0 15.3
Self-esteem
10
th
53.7 54.3 19.2 20.4
8
th
56.2 55.3 19.7 21.3
6
th
57.4 57.8 18.8 19.0
4
th
56.0 55.8 20.5 21.1
1
Total 55.7 55.8 19.6 20.5
Sample size for 10
th
, 8
th
, 6
th
, 4
th
grade at T1: 494, 374, 434, 488.
Sample size for 10
th
, 8
th
, 6
th
, 4
th
grade at T2: 493, 377, 437, 490.
T1 = at baseline; T2 = at 6-month follow-up
1
Total N : T1 = 1790; T2 = 1797.
2
Total N : T1 = 1302; T2 = 1307.
Health and Quality of Life Outcomes 2009, 7:7 />Page 7 of 12
(page number not for citation purposes)
8
th
grade, while the emotional well-being of the latter
decreased (p < 0.01) more than that of children in the 6
th
grade (see Table 5).
While a non-significant main effect for grade was found
for self-esteem, a significant main effect was observed for
sex, [F (1, 1761) = 10.08, p < 0.01] (ES = 0.6%) in that
girls' self-esteem decreased more than boys' over the six-
month follow-up (the estimated mean change score for
girls was -1.4 (SEM = 0.6) vs. boys 1.2 (SEM = 0.6)).
Total QoL
On the total QoL KINDL score a significant main effect for
grade, [F (3, 1761) = 10.59, p < 0.001] (ES = 2%) was
found. The overall QoL of children in the 8
th
grade
decreased significantly (p < 0.001) more than for those in
the 6
th
grade. Mean raw scores for girls reports on the ILC
LQ0-100 score were higher for 4
th
and 6
th
graders than for
8
th
and 10
th
graders, while differences for boys were
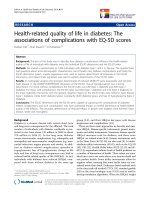
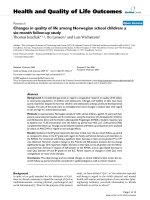
neglectable (see Table 4). A significant sex by grade inter-
action effect was found, [F (3, 1799) = 4.16, p < 0.01] (ES
= 0.7%). Further analysis showed that overall QoL levels
for girls in the 8
th
grade decreased significantly [F (1, 819)
= 8.25, p < 0.01] more than for those in the 6
th
grade over
the six-month follow-up period as compared to boys,
whose QoL scores remained stable across 6
th
and 8
th
grade
(see Figure 2).
Parent report
One significant main effect was observed on the KINDL
school scale for grade, [F (3, 1301) = 8.15, p < 0.001] (ES
= 2%). Subsequent post hoc tests showed that children's
attitude to school in the10
th
grade as perceived by their
parents, decreased significantly (p < 0.05) more during
the follow-up period as compared to those in 8
th
grade
(see Table 6).
Ceiling effects
The proportions of students who reported maximum
scores at baseline assessment on the KINDL subscales
were the following: Emotional well-being 3.8%, Friends
6.1%, School 2.2%, Family 11.8% and Self-esteem 1.8%.
The corresponding values for parent proxy report were:
Emotional well-being 3.3%, Friends 5.6%, School 4.9%,
Family 5% and Self-esteem 1.7%. For the ILC LQ0-100,
the respective values were 7% for student and 13.7% for
parent proxy report.
Discussion
The present study of short-term changes in child- and par-
ent reports of child QoL in a representative school-based
sample of Norwegian students, aged 8–16 years, showed
statistically significant differences related to age and sex in
various domains. Students in the 8
th
grade reported a
decrease in QoL over the six-month follow-up period as
compared to those in the 6
th
grade with regard to the QoL
Family, School domains and total QoL. For emotional
well-being, a significant linear decrease in QoL levels
across grades 6
th
to 10
th
was observed over the follow-up
period. However, student ratings on the Friends and Self-
esteem domains did not change significantly by age. Girls
reported a higher decrease in their QoL across all age-
groups over the follow-up period than did boys in respect
of Self-esteem, as well as an age-related decrease in total
QoL between 6
th
and 8
th
grade. Parents reported signifi-
cant changes of child QoL across the six months only for
Table 3: Mean raw scores on KINDL subscales: Parent proxy
report by grade
Mean Standard deviation
Grade T1 T2 T1 T2
Family
10
th
74.7 76.8 13.4 12.7
8
th
75.7 76.6 12.7 12.1
6
th
75.3 76.5 12.6 13.1
4
th
75.3 77.1 12.0 11.8
Total 75.3 76.8 12.4 11.6
Friends
10
th
77.4 78.7 12.8 12.0
8
th
78.8 78.8 12.6 12.0
6
th
77.5 78.7 13.7 11.9
4
th
80.1 81.3 11.8 10.8
Total 78.6 79.6 12.7 11.6
School
10
th
72.1 72.5 14.7 15.6
8
th
73.8 75.1 14.2 12.5
6
th
75.9 77.5 18.9 12.8
4
th
81.6 81.1 11.2 12.1
Total 76.6 77.2 15.3 13.5
Emotional well-being
10
th
79.3 80.4 13.4 13.1
8
th
79.6 81.2 13.5 12.7
6
th
78.4 80.3 13.8 13.4
4
th
80.6 81.7 11.5 10.9
Total 79.6 80.9 12.9 12.4
Self-esteem
10
th
65.0 66.6 14.8 13.5
8
th
66.4 66.9 14.0 12.7
6
th
66.0 65.8 14.0 14.0
4
th
70.1 70.1 12.6 12.2
Total 67.2 67.6 13.8 13.2
Sample sizes for 10
th
, 8
th
, 6
th
, 4
th
grade and total at T1: 266, 268, 349,
436 and 1319.
Sample sizes for 10
th
, 8
th
, 6
th
, 4
th
grade and total at T2: 267, 271, 352,
436 and 1326.
T1 = at baseline; T2 = at 6-month follow-up
Health and Quality of Life Outcomes 2009, 7:7 />Page 8 of 12
(page number not for citation purposes)
the School-domain. Overall, all significant changes
reported by students and parents showed small effect
sizes.
Age-related effects
Developmental trends in QoL related to family and friends
The results supported our first hypothesis. The decrease
over six months as reported by the students in family-
related QoL between 6
th
and 8
th
grade is likely to reflect a
desire for increased autonomy in early adolescence and
puberty. Our results are in accordance with a two-year fol-
low-up study [5] showing that adolescent reports of affec-
tion towards parents declined, for fathers from the 6
th
to
8
th
grades and for mothers from the 8
th
to 10
th
grades. The
adolescents also reported a decrease in reports of helpful-
ness towards their parents. Larson et al. [3], observed signs
of transformation in adolescents' changing emotional
experience with their families. The emotional states
among early adolescents became less positive, especially
during talk with their families, when they experienced
family members as less friendly. The authors concluded
that early adolescence is often the most strained period in
adolescent-parent relationships [3,43]. While it is likely
that our results also reflect such transformations in ado-
lescents-parent relationships, it is notable that the parents
did not report similar child QoL changes in this domain.
The students' report could have been influenced by their
emotions and need for autonomy rather than reflect real
changes in family conflict. A similar conclusion was
drawn by Eberly and Montemajor [5] who found that par-
ents did not report the same developmental changes in
adolescents' affection or helpfulness obtained on adoles-
cent report. Thus, it is likely that parents may have diffi-
culties in detecting minor changes in their child's feelings
over short-term, or they perceive the emotional fluctua-
tions in their children as a normal phenomenon.
As expected, students perceived their relationships with
friends as stable across age over the six-month follow-up
period. In their review, Hartup and Stevens [9] concluded
that good outcomes in respect to mental health are most
likely when a child is well socialized and has friends, and
when relationships with these individuals are supportive
and intimate. Thus, the high degree of stability related to
the QoL Friends domain in our school sample may reflect
normal development among adolescents. Parent proxy
reports further supported stability in student perception
of relationships with friends.
Discontinuity in school-bonding and QoL
Our hypothesis that reports of older students on school
QoL would decrease during the follow-up period, as com-
pared to younger ones was supported. The overwhelming
majority of the 8
th
graders had recently moved to junior
high school, representing a discontinuity in their school
situation. Wigfield et al. [11] found that self-perceived
ability in mathematics, English, sports and social activities
declined after transition from elementary school to junior
high school (6
th
to 7
th
grade in USA) possibly due to
changes in school and classroom environments. They also
observed a temporary decline of self-esteem among stu-
dents associated with the transition. Norwegian children
receive marks for the first time in the 8
th
grade, a potential
school stressor that may also have impact on school-
related QoL. The discontinuities in student school bond-
ing may explain some of the observed decrease in school-
Table 4: Mean raw scores on the ILC: Student and parent proxy report by sex and grade
Girls Boys
Mean Standard deviation Sample size Mean Standard deviation Sample size
GradeT1T2T1 T2 T1T2T1T2T1 T2 T1T2
Student report
10
th
74.5 76.3 15.2 15.8 260 260 80.8 81.1 13.4 14.0 240 240
8
th
80.1 78.9 12.9 15.7 187 187 82.9 84.2 12.7 13.3 196 195
6
th
81.6 82.4 14.7 13.6 231 231 80.7 82.9 15.5 14.6 212 215
4
th
82.2 82.9 11.1 11.5 231 235 84.2 82.3 11.6 11.4 254 255
Total 79.4 80.1 14.0 14.5 909 913 82.2 82.5 13.4 13.3 902 905
Parent proxy report
10
th
86.7 87.9 13.6 12.7 151 151 86.6 87.1 12.5 13.5 121 121
8
th
88.1 87.5 9.6 11.3 141 142 84.4 86.3 12.6 11.6 130 129
6
th
87.3 88.6 11.0 10.8 180 180 83.0 84.6 14.2 13.0 173 172
4
th
88.9 90.0 9.8 9.0 214 213 87.0 88.4 10.9 10.5 223 223
Total 87.8 88.6 11.0 10.9 686 686 85.4 86.7 12.6 12.1 647 645
T1 = at baseline
T2 = at 6-month follow-up
Health and Quality of Life Outcomes 2009, 7:7 />Page 9 of 12
(page number not for citation purposes)
related QoL between the 6
th
and 8
th
grades. This domain
was the only one in which parents reported significant
changes across the six-month follow-up period. This find-
ing supported our hypothesis that parent by proxy ratings
will show fewer significant age and sex-related changes in
child QoL over the six-month follow-up period than stu-
dent reports. Parents also reported a decrease of QoL
between the 8
th
and 10
th
grade, i.e. somewhat later than
did the students, an unclear finding. The reason why the
only parent-reported change was restricted to the School
domain, might be the existence of objective information
such as marks and teacher reports providing the parents
with some external indication about student's school-
related QoL. Regardless of the exact time period of change,
both students and parents in our school sample reported
a decrease in school-related Qol with increasing student
age.
Developmental trends in emotional well-being and Self-esteem
The hypothesis that older students would report a
decrease in emotional well-being as compared to younger
ones over the follow-up period was supported. Pubertal
changes combined with challenges for the maturing ado-
lescent in social contexts, e.g. in the family, school, is
likely to affect his/her emotional well-being from early to
mid-adolescence [44]. The observed linear decrease in stu-
dent reports of emotional well-being across the 6
th
, 8
th
and 10
th
grades represent a small effect and reflects an age-
related, temporary instability of emotional well-being
among the students as part of their normal psychological
Table 5: Mean change and estimated mean change on the KINDL: Student report by grade
Mean change
a
SD Est. Mean change
b
SEM Effect size (%)
Grade
Family
10
th
0.4 18.6 -2.3 0.7 3.3
8
th
-1.7 16.2 -2.2*** 0.8
6
th
2.1 14.9 3.1*** 0.7
4
th
1.0 16.7. 3.2 0.7
Total
c
0.5 16.8 - -
Friends
10
th
1.1 14.8 0.2 0.6
8
th
1.0 15.4 0.8 0.7
6
th
1.4 15.7 2.4 0.7
Total
d
1.2 15.2 - -
School
10
th
1.4 16.9 -1.0 0.7 1.0
8
th
-0.5 15.7 -0.1* 0.7
6
th
-0.3 15.1 2.2* 0.7
Total
d
0.3 16.0 - -
Emotional well-being
10
th
0.1 15.3 -0.9* 0.6 2.2
8
th
0.3 14.8 0.9* 0.7
6
th
3.2 15.0 3.8* 0.6
Total
d
1.2 15.1 - -
Self-esteem
10
th
0.5 15.6 -0.3 0.8
8
th
-0.9 18.6 -0.7 0.9
6
th
0.3 16.9 1.0 0.8
4
th
-0.3 23.4 -0.3 0.8
Total
c
-0.1 18.9 - -
a
Differences in means based on raw scores between baseline and follow-up (T2 minus T1).
b
Estimated marginal mean change scores by ANCOVA, using baseline-scores as covariates.
c
Total N = 1770;
d
total N= 1282.
Sample size for 10
th
, 8
th
, 6
th
and 4
th
grades: 488, 370, 424 and 488.
SD = Standard deviation; SEM = Standard error of the mean
*p < 0.05; **p < 0.01; ***p < 0.001
Health and Quality of Life Outcomes 2009, 7:7 />Page 10 of 12
(page number not for citation purposes)
development. Emotional well-being was shown to be the
only domain, in which 10
th
graders also reported a
decrease in QoL. It might be that other pubertal factors
not investigated in the present study, were responsible for
the decrease in emotional well-being among10
th
graders,
i.e. love relationships.
By contrast, parents did not detect any significant age-
related changes in regard to their child's emotional well-
being. From comprehensive cross-informant studies on
child emotional and behavioural problems [45], it is well
known that child-parent correlations in reports of inter-
nalizing problems are lower than overt behaviour prob-
lems.
As expected, differences between the four grades in stu-
dents' reports of self-esteem across the six-month follow-
up period, were small and nonsignificant. In their exten-
sive meta-analyses of 50 published studies (N = 29,839)
and four large national studies (N = 74,381), Trzesniewki
et al. found evidence for a robust developmental trend.
The stability of self-esteem was low during childhood (up
to the age of 9 years), increased throughout adolescence
into young adulthood and declined during midlife and
old age [17]. Overall, the authors concluded that self-
esteem is a stable trait across adolescence.
Sex-related effects
QoL and sex-related developmental changes
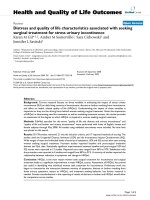
While the ILC evidenced a decrease of total QoL scores
between the 6
th
and 8
th
grade across the six-month follow-
up period, it was only shown for girls. Although such sex
by age interaction effect was not observed on the KINDL
total QoL scale, girls scored significantly lower across all
grades on the KINDL self-esteem subscale. Our results
support the hypothesis that girls will report a lower total
QoL than boys. In a 10-year longitudinal study, Biro et al.
[19] found that only Caucasian girls, as compared to Afro-
American girls showed a decline in self-esteem during
adolescence. The findings are also in line with other cross-
sectional studies showing that girls report a lower total
QoL than boys [20,21]. Even if the student reported sex by
Table 6: Mean change and estimated mean change on the
KINDL: Parent proxy report by grade
Mean change
a
SD Est. Mean change
b
SEM
Grade
Family
10
th
1.8 11.3 1.5 0.6
8
th
1.0 12.1 1.2 0.6
6
th
1.3 12.2 1.3 0.5
4
th
1.9 11.1 1.8 0.5
Total 1.5 11.6 - -
Friends
10
th
1.2 11.5 0.7 0.6
8
th
-0.1 11.1 0.1 0.6
6
th
1.3 11.7 0.8 0.5
4
th
1.3 10.5 2.0 0.5
Total 1.0 11.2 - -
School
10
th
0.3 11.5 -2.1*
c
0.7
8
th
1.3 11.5 -0.1* 0.7
6
th
1.6 17.9 1.2 0.6
4
th
-0.5 11.1 2.1 0.5
Total 0.6 13.4 - -
Emotional well-being
10
th
1.2 12.2 0.7 0.7
8
th
1.4 12.1 1.5 0.7
6
th
2.0 13.7 1.4 0.3
4
th
1.3 12.8 1.7 0.5
Total 1.4 12.8 - -
Self-esteem
10
th
1.4 12.8 0.3 0.7
8
th
0.5 13.7 0.2 0.7
6
th
-0.1 14.1 -0.8 0.6
4
th
0.1 11.3 1.4 0.5
Total 0.4 12.9 - -
a
Differences in mean change based on raw scores between baseline
and follow-up (T2 minus T1).
b
Estimated marginal mean change scores by ANCOVA, using baseline-
scores as covariates.
c
Effect size = 2%
SD = Standard deviation; SEM = Standard error of the mean
Sample size for 10
th
, 8
th
, 6
th
, 4
th
grades and total: 262, 266, 348, 434
and 1310.
*p < 0.05
Grade and sex interaction effect on the ILC across the 6-month follow-upFigure 2
Grade and sex interaction effect on the ILC across
the 6-month follow-up.
Health and Quality of Life Outcomes 2009, 7:7 />Page 11 of 12
(page number not for citation purposes)
age differences in our study were small, it is notable that
they were obtained after a 6-month follow-up period.
However, parents did not report sex-related QoL changes
among students on any subscale or for total QoL scores.
Implication of the findings for clinical research and
practice
(1) The present study illustrates the importance of obtain-
ing both child and parent proxy reports when assessing
QoL changes, in epidemiological surveys as well as in clin-
ical populations. The informants provide different per-
spectives and parent proxy report can not substitute for
child or adolescent subjective evaluation. (2) Only a QoL
instrument should be used that includes a generic part
with norms available in the general child population in
regard to age and sex. (3) When using QoL as an outcome
measure in clinical practice or research, the clinician
should expect a natural decrease across 6 months in QoL
related to family and emotional well-being domains in
the 12 to 14 (15) year age group. (4) With regard to the
child's school-related QoL, the clinician should assess
recent or future stressors in school that might implicate a
discontinuity in school-bonding. (5) Clinicians should
also be aware of a greater decrease in QoL among girls
than boys in puberty.
Strengths and Limitations of the study
The present follow-up sample was found to be represent-
ative for the population with regard to urban-to-rural res-
idency ratio, sex ratio, and mean age. Because the two-
week test-retest reliability of the reported KINDL scales
and the ILC was overall good to excellent [37], we can be
confident in that our results reflect real QoL changes
across the 6-month period in respect to student age and
sex.
Because four KINDL subscales in a former study showed
low reliability (internal consistency or two-week test-
retest reliability) for the youngest children in the 4
th
grade
[37], they were not included in all analyses here, limited
to the 6
th
to 10
th
grades. Further, parents who did not par-
ticipate at the follow-up reported a slightly, but signifi-
cantly lower QoL in their children at baseline as compared
to participants. Thus, our follow-up figures for parent
reports of child QoL may therefore be slightly overesti-
mated. Overall, we found small to moderate ceiling
effects. The highest ceiling effects were found for the stu-
dent report on the KINDL Family-subscale and for the par-
ent proxy report on the ILC LQ0-100 scale. Thus, the
observed differences in QoL for 8
th
graders compared to
6
th
graders over the six-month follow-up on the KINDL
family scale and the corresponding effect size, might
therefore be slightly underestimated. Similarly, student
and parent reports of stability on the Friends subscale, and
parent report on the ILC LQ0-100 scale could be slightly
biased due to moderate ceiling effects.
Conclusion
The child-reported changes in various QoL domains rep-
resented small effects and could be interpreted as reflect-
ing normal psychological developmental during puberty,
involving cognitive and emotional changes and contex-
tual transitions in parent-child relationships, friends and
school domains. However, it is important to be aware of
short-term changes of QoL among children and adoles-
cents in the general population, in particular in puberty.
Such aspects are important considerations when assessing
changes in QoL in clinical populations.
Abbreviations
ANOVA: Analysis of variance; ANCOVA: Analysis of cov-
ariance; EM: Expectation maximization; ES: Effect size;
ICC: Intraclass correlation coefficient; ILC: Inventory of
Life Quality for Children and Adolescents; KINDL: Kinder
Lebensqualität Fragebogen (In German. Questionnaire
for Measuring health-related Quality of life in children
and adolescents); LQ0-100: Life quality score (range 0–
100); SEM: Standard error of the mean; T1: time 1; T2:
time 2; QoL: Quality of Life.
Competing interests
The authors declare that they have no competing interests.
Authors' contributions
TJ contributed to the study design, data collection, statis-
tical analysis, interpretation of data and to the drafting of
the paper. BL contributed to the study design, statistical
analysis, interpretation of data and the revision of the
manuscript. LW contributed to the study design, statistical
analysis, interpretation of data and revision of the manu-
script. All authors read and approved the final manu-
script.
Acknowledgements
This study was funded by the 'National Council of Mental Health', the
organization 'Health and Rehabilitation' and St. Olav University Hospital.
Thanks to all parents and pupils participating in the study, to all teachers in
Sør-Trøndelag county and to Anne Mørkved who helped collect the data.
Thanks to Fritz Mattejat and Ulrike Ravens-Sieberer for cooperation in
developing the Norwegian ILC and KINDL and to Jan Wallander for valua-
ble comments on earlier drafts of the manuscript.
References
1. Koot HM: The study of quality of life: Concepts and methods.
In Quality of Life in Child and Adolescent Illness 1st edition. Edited by:
Koot HM, Wallander JL. New York: Brunner-Routledge; 2001:3-20.
2. Laursen B, Collins AW: Interpersonal conflict during adoles-
cence. Psychol Bull 1994, 115(2):197-209.
3. Larson RW, Richards MH, Moneta G, Holmbeck G, Duckett E:
Changes in adolescents' daily interaction with their families
from ages 10 to 18: Disengagement and transformation. Dev
Psychol 1996, 32(4):744-754.
Health and Quality of Life Outcomes 2009, 7:7 />Page 12 of 12
(page number not for citation purposes)
4. Collins WA, Laursen B: Changing relationships, changing
youths: Interpersonal contexts of adolescent development. J
Early Adolesc 2004, 24(1):55-62.
5. Eberly MB, Montemayor R: Adolescent affection and helpfulness
towards parents: A 2-year follow-up. J Early Adolesc 1999,
19(2):226-248.
6. Spieth LE: Generic health related quality of life measures for
children and adolescent. In Quality of Life in Child and Adolescent
Illness 1st edition. Edited by: Koot HM, Wallander JL. New York:
Brunner-Routledge; 2001:49-88.
7. Eiser C, Morse R: The Measurement of quality of life in chil-
dren: Past and future perspectives. J Dev Behav Pediatr 2001,
22(4):248-256.
8. Montemayor R: The relationship between parent-adolescent
conflict and the amount of time adolescents spend alone and
with parents and peers. Child Dev 1982, 53:1512-1519.
9. Hartup WW, Stevens N: Friendship and adaptation in the life
course. Psychol Bull 1997, 121(3):355-370.
10. Berndt TJ, Hawkins JA, Hoyle SG: Changes in friendship during a
school year: Effects on children's and adolescents' impres-
sions of friendship and sharing with friends. Child Dev 1986,
57:1284-1297.
11. Wigfield A, Eccles JS, Mac Iver D, Reuman DA, Midgley C: Transition
during early adolescence: Changes in children's domain-spe-
cific self-perceptions and general self-esteem across the
transition to junior high school. Dev Psychol 1991,
27(4):552-565.
12. Maddox SJ, Prinz RJ: School bonding in children and adoles-
cents: Conceptualization, assessment and associated varia-
bles. Clin Child Fam Psychol Rev 2003, 6(1):31-49.
13. Simons-Morton BG, Crump AD, Haynie DL, Saylor KE: Student-
school bonding and adolescent problem behaviour. Health
Educ Res 1999, 14(1):99-107.
14. Ravens-Sieberer U, Bullinger M: Assessing the health-related
Quality of life in chronically ill children with the German
KINDL: first psychometric and content analytical results.
Qual of Life Res 1998, 7:399-407.
15. Ravens-Sieberer U, Bullinger M: KINDL-R Questionnaire for
Measuring health-related Quality of Life in children and ado-
lescents – Revised Version. [
].
16. Landgraf JM, Abetz L, Ware JE: The Child Health Questionnaire User's
Manual (second printing) Boston: HealthAct; 1999.
17. Trzesniewski KH, Donnellan MB, Robins RW: Stability of self-
esteem across the life span. J Pers Soc Psychol 2003,
84(1):205-220.
18. Harter S, Whitesell NR: Beyond the debate: Why some adoles-
cents report stable self-worth over time and situation,
whereas others report changes in self-worth. J Pers 2003,
71(6):1027-1058.
19. Biro FM, Striegel-Moore RH, Franko DL, Padgett J, Bean JA: Self-
esteem in adolescent females. J Adolesc Health 2006, 39:501-507.
20. Ravens-Sieberer U, Görtler E, Bullinger M: Subjektive Gesundheit
und Gesundheitsverhalten von Kindern und Jugendlichen (in
German). (Subjective Health and Health Behaviour in Chil-
dren and Adolescents – A questionnaire study In co-opera-
tion with Hamburg school physicians). Gesundheitswesen 2000,
62:148-155.
21. Ravens-Sieberer U, Bettge S, Erhart M: Lebensqualität von
Kindern und Jugendlichen – Ergebnisse des Kinder- und
Jugendgesundheits-surveys (in German). (Quality of life in
children and adolescents – Results from the child and Ado-
lescent surveys). Bundesgesundheitsblatt – Gesundheitsforschung –
Gesundheitsschutz 2003, 46:340-345.
22. Varni JW, Burwinkle TM, Katz ER: The PedsQL in pediatric can-
cer pain: A prospective longitudinal analysis of pain and emo-
tional distress. J Dev Behav Pediatr 2004, 25(4):239-246.
23. Vargus-Adams J: Longitudinal use of the Child Health Ques-
tionnaire in childhood cerebral palsy. Dev med Child Neurol
2006, 48:343-347.
24. Empelen RV, Jennekens-Schinkel A, Rien PC, Helders PJM, Nieuwen-
huizen OV: Health-related Quality of Life and self-perceived
competence of children assessed before and up to two years
after epilepsy surgery. Epilepsia 2005, 46(2):258-271.
25. McCarthy ML, MacKenzie EJ, Durbin DR, Aitken ME, Jaffe KM, Paidas
CN, Slomine BS, Dorsch AM, Christensen JR, Ding R: Health-
related quality of life during the first year after traumatic
brain injury. Arch Pediatr Adolesc Med 2006, 160:252-260.
26. Cheng K: Psychotherapeutic Interventions.
In Child and Adoles-
cent Psychiatry. The Essentials 1st edition. Edited by: Cheng K, Myers
KM. Philadelphia: Lippincott Williams & Wilkins; 2005:439-456.
27. Shek DTL: Economic disadvantage, perceived family life qual-
ity, and emotional well-being in Chinese adolescents: A lon-
gitudinal study. Soc Indic Res 2007.
28. Shek D: A longitudinal study of the relations between parent-
adolescent conflict and adolescent psychological well-being.
J Genet Psychol 1998, 159(1):53-67.
29. Meuleners L, Lee A: Adolescent quality of Life: A school-based
cohort study in Western Australia. Pediatr Int 2003, 45:706-711.
30. Varni JW, Limbers CA, Burwinkle TM: Parent proxy-report of
their children's health related quality of life: an analysis of
13,878 parents' reliability and validity across age subgroups
using the PedsQL 4.0 Generic Core Scales. Health Qual Life Out-
comes 2007, 5:2.
31. Eiser C, Morse R: Can parents rate their child's health-related
quality of life? Results of a systematic review. Qual of Life Res
2001, 10:347-257.
32. Chang PC, Yeh CH: Agreement between child self-report and
parent by proxy-report to evaluate QoL in children with can-
cer. Psychooncology 2005, 14:125-134.
33. Eiser C, Morse R: The Measurement of quality of life in chil-
dren: Past and future perspectives. J Dev Behav Pediatr 2001,
22(4):248-256.
34. Cremeens J, Eiser C, Blades M: Factors influencing agreement
between child self- report and parent proxy-reports on the
Pediatric Quality of Life Inventory™ 4.0 (PedsQL™) Generic
Core Scales. Health Qual Life Outcomes 2006, 4(58):1-8.
35. Reinfjell T, Diseth TH, Veenstra M, Vikan A: Measuring health-
related quality of life in young adolescents: Reliability and
validity in the Norwegian version of the Pediatric Quality of
Life Inventory TM 4.0 (PedsQL) generic core scales. Health
Qual Life Outcomes 2006, 4:61.
36. Wilson-Genderson M, Broder HL, Phillips C: Concordance
between caregiver and child reports of child's oral health-
related quality of life. Community Dent Oral Epdemiol 2007,
35(Suppl 1):32-40.
37. Jozefiak T, Larsson B, Wichstrøm L: Quality of life reported by
school-aged children and their parents. Health Qual Life Out-
comes 2008, 6:34.
38. Mattejat F, Remschmidt H: Das Inventar zur Erfassung der Lebensqualität
bei Kindern und Jugendlichen (ILK) – (in German). (The inventory of life
quality in children and adolescents ILC) Bern: Hans Huber Verlag; 2006.
39. Mattejat F, Trosse K, John K, Bachmann M, Remschmidt : KJP-Qualität.
Modell- Forschungsprojekt zur Qualität ambulanter Kinder- und Jugendpsy-
chiatrischer Behandlung. Abschlussbericht (in German). (Child and Adoles-
cent Psychiatry Quality. Model research project in regard to quality of child-
and adolescent psychiatric treatment. Final Report.) Marburg: Görich &
Weiershäuser; 2006.
40. Kaestner F: Messung der Lebensqualität von Kindern und
Jugendlichen (in German). (Measuring Quality of Life in Chil-
dren and Adolescents). In PhD thesis Philipps-University Marburg,
Germany; 2000.
41. Ravens-Sieberer U, Redegeld M, Bullinger M: Lebensqualität chro-
nisch kranker Kinder im Verlauf der stationären Rehabilita-
tion (in German) (Quality of life in cronical ill children during
inpatient rehabilitation). In Verbindung und Veränderung im Fokus
der Medizinischen Psychologie (Connections and changes in medical psy-
chology) Edited by: Neuser J, de Bruin JT. Lengerich: Pabst Science;
2000:89.
42. Cohen J: Statistical power analysis for the behavioral sciences NJ: Hills-
dale, Erlbaum; 1988.
43. Holmbeck GN, Hill JP: Conflictive engagement, positive affect,
and menarche in families with seventh-grade girls. Child Dev
1991, 62:1030-1048.
44. Holmbeck GN, Paikoff RL, Brooks-Gunn J: Parenting adolescents.
In Handbook of Parenting Volume 1. Bornstein MH. Erlbaum, Mahwah,
NJ; 1995:91-118.
45. Achenbach TM, Rescorla L: An Integrated System of Multi-informant
Assessment – School-Age Forms and Profiles USA: Library of Congress;
2001.