AUDITOR-GENERAL’S REPORT FINANCIAL AUDITS Volume Three 2009 focusing on Electricity _part2 potx
Bạn đang xem bản rút gọn của tài liệu. Xem và tải ngay bản đầy đủ của tài liệu tại đây (178.59 KB, 9 trang )
Electricity Industry Overview ______________________________________________________________________
4 __________________________________________ Auditor-General’s Report to Parliament 2009 Volume Three
The Strategy comprises the following key elements:
continued Government ownership and operation of existing power stations and all electricity
networks (the pole and wires) in New South Wales
contracting the electricity trading rights of power stations to the private sector, commonly
referred to as the ‘Gentrader’ model
selling the retail arms of EnergyAustralia, Integral Energy Australia and Country Energy
selling the following key power station development sites around the State.
Development Site Size
(MW)*
Fuel Progress
Bamarang (Delta) 300-400 Gas Full Development Approval obtained
Tomago (Macquarie Generation) 500-790 Gas Full Development Approval obtained
Marulan (EnergyAustralia) 350 Gas Director-General’s requirements issued
(1)
Marulan (Delta) 350-450 Gas Director-General’s requirements issued
(1)
Munmorah (Delta) 700 Gas/coal Planning process underway
Bayswater B (Macquarie
Generation)
2000 Gas/coal Planning process underway
Mt Piper extension (Delta) 2000 Gas/coal Planning process underway
(1) On 8 October 2007 the Director-General of the New South Wales Department of Planning declared the Marulan Gas
Turbine Facilities Projects of EnergyAustralia and Delta Electricity were considered as Major Projects and would be
assessed under Part 3A of the Environmental Planning and Assessment Act 1979.
* MW = Megawatts
The Strategy’s completion date is mid 2010. The Government retains the discretion to offer
particular assets as part of an Initial Public Offering (IPO) should the first phase of the bid process
not deliver the Strategy’s objectives.
In September 2009 the Government called for Expressions of Interest (EOI) from national and
international electricity industry operators and investors. The EOI closes on 18 November 2009.
Those offering an appropriate EOI will be invited to submit bids for the assets.
The Government’s Strategy is intended to significantly increase private sector investment in new
generation capacity for New South Wales. Achieving this objective may require a trade-off between
maximising the financial return to the Government and minimising potential ongoing Government
liabilities.
There are a number of challenges associated with implementing the Strategy. Two of the more
significant are uncertainty of the Federal Government’s proposed Carbon Pollution Reduction
Scheme and the current global financial climate.
This is trial version
www.adultpdf.com
______________________________________________________________________ Electricity Industry Overview
Auditor-General’s Report to Parliament 2009 Volume Three __________________________________________ 5
Our 2008 report to Parliament ‘Oversight of Electricity Industry Restructuring’, included
consideration points that are relevant to the current Strategy. Most of the consideration points are
reflected in the current Strategy. The following table provides a comparison between the
consideration points and the current Strategy:
Consideration points from ‘Oversight of Electricity
Industry Restructuring’, August 2008
Items included in the ‘New South Wales Energy
Reform Strategy: Approach to transaction
implementation, September 2009’
Encourage new entrants and new investment to
promote competition in electricity generation and
retail markets by:
using simultaneous rather than sequential
Generator/Retailer transactions
holding separate tender(s) for a generation
development site(s)
The Strategy proposes that it will separately and on a
simultaneous basis:
contract the electricity trading rights of
Government-owned power stations
sell the retail arms of EnergyAustralia,
Integral Energy Australia and Country Energy
sell key power station development sites
around the State.
Treasury continuously evaluate the restructuring
process after the marketing effort and before the
first transaction.
Treasury advised that it has conducted a
considerable consultation process which included
potential trade purchasers prior to announcing the
strategy.
Treasury continuously evaluate the likelihood of the
success of transactions and whether contingency
plans require executing
The implementation process advises that if the trade
sale process does not deliver the Government’s
objectives, the Government retains the discretion to
offer particular assets as part of an Initial Public
Offering.
Reserve Price and Retention Value:
Treasury documents contingency plans prior
to commencing the first transaction which
inter alia include the setting of a reserve
price for each transaction and considerations
if the reserve price is not achieved
Treasury calculating a retention value for
each Generator and Retailer using consistent
assumptions prior to commencing each
transaction.
The Strategy does not publically articulate Treasury’s
approach to either of these points.
Access to fuel supply
To support the sale by providing some certainty over coal supplies and coal costs, a new coal mine
(Cobbora) will be developed to supply State owned generators.
The Cobbora open-cut coalfield covers a 320 kilometre area in the Cobbora and Laheys Creek area
of Warrumbungle Shire.
This is trial version
www.adultpdf.com
Electricity Industry Overview ______________________________________________________________________
6 __________________________________________ Auditor-General’s Report to Parliament 2009 Volume Three
The Government has approved an initial development budget of about $170 million for New South
Wales generators to implement the project. Of the seven State owned power stations five are in
the Hunter region and can receive coal from the Cobbora mine by rail. Existing rail infrastructure is
to be enhanced and expanded.
Expressions of interest have been invited from parties interested in building and operating a large
scale coalmine. Indicative offers are due by 5 February 2010 with initial deliveries of coal due to
commence from early in 2013.
Electricity Prices
Electricity wholesale prices in the National Electricity Market (NEM) decreased during 2009. The
average spot price for 2009 in New South Wales was $38.85 per megawatt hour, a fall of
6.75 per cent from the 2008 average of $41.66.
The wholesale (spot) price of electricity has been subject to volatility since the inception of the
National Electricity Market in 1997. Despite this volatility, the average spot price has remained
around $40-$45 per megawatt hour.
A report by IPART in 2004, ‘The Long Run Marginal Cost of Electricity Generation in New South
Wales’, estimated the long run marginal cost (LRMC) for base load thermal generators to be an
average of $36.33 per megawatt hour. The same report concluded that the LRMC for two other
technologies, combined cycle gas turbines and open cycle gas turbines, to be $41.77 and
$58.99 per megawatt hour respectively. These costs currently do not include the cost of carbon.
Renewable energy targets and carbon reduction schemes seek to use market forces to encourage
investment in renewable and low carbon energy sources. Both State and Commonwealth
governments have progressively introduced renewable energy targets and carbon reduction
schemes.
Under the existing market rules for the NEM average spot prices can range between a minimum of
negative $1,000 and a maximum of $10,000 per megawatt hour. The price volatility initially
impacted the valuation of generation assets by introducing uncertainty to cash flows and returns to
investors. In response, larger market participants manage the impact of price volatility through the
use of electricity fixed price contracts (derivative financial instruments).
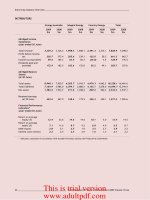
The following tables relate to the average annual wholesale spot prices of electricity:
Year ended 30 June NSW
$/MWh
Vic
$/MWh
Qld
$/MWh
SA
$/MWh
Tas
$/MWh
2009 38.85 41.82 34.00 50.98 58.48
2008 41.66 46.79 52.34 73.50 54.68
2007 58.72 54.80 52.14 51.61 49.56
2006 37.24 32.47 28.12 37.76 56.76
2005 39.33 27.62 28.96 36.07 190.38
2004 32.37 25.38 28.18 34.86 (a)
Source: AEMO price statistics average annual prices per financial year.
(a) Tasmania entered the National Electricity Market on 29 May 2005, and became an active participant on
29 April 2006.
This is trial version
www.adultpdf.com
______________________________________________________________________ Electricity Industry Overview
Auditor-General’s Report to Parliament 2009 Volume Three __________________________________________ 7
The average price per megawatt hour for June 2009 of $34.15 was lower than the June 2008 price
of $41.82.
The June 2009 average prices per megawatt hour were:
June NSW
$/MWh
Vic
$/MWh
Qld
$/MWh
SA
$/MWh
Tas
$/MWh
2009 34.15 30.07 30.76 31.29 173.80
2008 41.82 42.04 41.13 40.11 55.96
2007 (a) 230.66 143.28 192.45 102.63 77.81
Source: AEMO average regional reference price per region for the month.
(a) The average price per MWh for June 2007 was affected by constraints (including drought) on generating capacity.
The highest and lowest electricity prices recorded in New South Wales in the year to 30 June 2009
were:
lowest average daily price was $17.06 per Megawatt hour on 18 January 2009 ($18.42 on
25 December 2007)
highest average daily price was $2,207.11 per Megawatt hour on 31 October 2008 ($336.22 on
22 October 2007)
lowest half-hour price was negative $170.76 on 18 January 2009 at 5:30 am (positive $7.58
on 19 October 2007 at 3:30 am)
highest half-hour price was $10,000.00 per Megawatt hour on 31 October 2008 at 1:00 pm
and 1:30 pm ($7,858.07 on 22 October 2007 at 10 am).
Sustainable Energy
The Government is developing and encouraging initiatives to promote the growth of sustainable
energy sources. Initiatives in this area are detailed below.
Renewable Energy
The relatively higher cost of providing renewable generation has been a barrier to any large scale
investment. Renewable energy is energy sourced from alternative sources such as water, biomass,
landfill methane, wind, organic matter and the sun.
This is trial version
www.adultpdf.com
Electricity Industry Overview ______________________________________________________________________
8 __________________________________________ Auditor-General’s Report to Parliament 2009 Volume Three
Sourcing renewable energy reduces greenhouse gas emissions. Approximately six per cent of New
South Wales electricity is sourced from renewable energy sources. The New South Wales
Government has set a target of 15 per cent renewable energy consumption by 2020. This target has
been largely superseded by the expanded national Renewable Energy Target (RET), which was
developed through COAG and mandates that 20 per cent of energy production in Australia come
from renewable sources by 2020.
Source: Department of Industry and Investment NSW – October 2009
Coal continues to be the major source of electricity generation in Australia as shown below.
Source: NEMMCO, An Introduction to Australia’s National Electricity Market July 2009
This is trial version
www.adultpdf.com
______________________________________________________________________ Electricity Industry Overview
Auditor-General’s Report to Parliament 2009 Volume Three __________________________________________ 9
Greenhouse Gas Reduction Scheme
The New South Wales Greenhouse Gas Reduction Scheme (GGAS), formerly known as Greenhouse
Gas Abatement Scheme, pioneered emissions trading in Australia and is one of the first emissions
trading schemes in the world. The objectives of the GGAS are to:
reduce greenhouse gas emissions associated with the production and use of electricity
develop and encourage activities to offset the production of greenhouse gas emissions.
GGAS requires retailers and other parties (benchmark participants) to meet mandatory targets set
under the Electricity Supply Act 1995 for reducing emission of greenhouse gases from the
production of the electricity they supply or use.
The State’s greenhouse gas benchmarks under the Electricity Supply Act 1995 are as follows:
Source: Independent Pricing and Regulatory Tribunal, ‘Compliance and Operation of the NSW Greenhouse Gas Reduction
Scheme during 2008’, July 2009
tCO2e = tonnes of carbon dioxide equivalent. It is a measure used to compare different greenhouse gasses.
The benchmark dropped to 7.27 tonnes in 2007 which represents a reduction of five per cent below
the Kyoto Protocol baseline year of 1989-90.
The GGAS is expected to transition into the Federal Government’s Carbon Pollution Reduction
Scheme (see below). Most of the demand side abatement aspects of the GGAS were incorporated
into the New South Wales Energy Savings Scheme on 1 July 2009, with the exception of on-site
generation which remains an eligible activity under GGAS.
Customer initiatives - GreenPower
GreenPower is a national accreditation program that sets stringent environmental and reporting
standards for renewable energy products offered by electricity suppliers to households and
businesses across Australia. When customers choose to buy a GreenPower product through their
electricity retailer the extra price they pay is invested in the renewable energy sector.
This is trial version
www.adultpdf.com
Electricity Industry Overview ______________________________________________________________________
10 _________________________________________ Auditor-General’s Report to Parliament 2009 Volume Three
Data sourced from the National Greenhouse Accreditation Program shows considerable growth in
the number of customers opting to purchase green energy. In New South Wales for the nine month
period to 31 March 2009, GreenPower customers increased by 26,069 or 11.8 per cent from
30 June 2008.
The increase in green energy purchases was not spread equally between residential and commercial
customers. The two graphs appearing below highlight that residential customers in New South
Wales increased from 207,801 to 236,242 or 13.7 per cent at 31 March 2009, while commercial
customer numbers decreased from 13,021 to 10,649 or 18.2 per cent for the same period. The
decline in green energy purchase by commercial customers may in part be indicative of the overall
global financial crisis and its impact on the businesses in the economy.
Source: data extracted from the National GreenPower Accreditation Program Status Reports for the quarters ended 30
June 2008 and 31 March 2009 ‘Greenhouse Gas Reduction Scheme’
This is trial version
www.adultpdf.com
______________________________________________________________________ Electricity Industry Overview
Auditor-General’s Report to Parliament 2009 Volume Three _________________________________________ 11
Solar Feed-in Tariff Scheme
The New South Wales Government announced its intention to introduce a Solar Feed-in Tariff (FiT)
Scheme from 1 January 2010. The FiT will apply to small scale, grid connected, solar photovoltaic
(PV) systems. A tariff of 60 cents per kilowatt hour will be paid to PV system owners for electricity
produced by the systems that are fed back into the electricity grid (a ‘net’ tariff).
Electricity distributors are expected to bear the costs of the scheme with the costs being passed
onto electricity customers. Households are expected to pay on average between $2 and $9 per year
over the life of the scheme to fund the Scheme.
Carbon Pollution Reduction Scheme (CPRS)
All Australian businesses, including all electricity corporations in the New South Wales Public
Sector, will be affected directly or indirectly by the Federal Government’s proposed CPRS.
In December 2008, the Federal Government released a White Paper outlining its policy for a
national CPRS emissions trading scheme. On 4 May 2009, the Federal Government announced a
number of adjustments to the scheme to address public concerns and help manage the impacts of
the global recession.
The key variations included: delaying the scheme’s commencement by one year to 1 July 2011;
establishing a fixed price of carbon of $10 for the first year of the scheme; a global recession
buffer, providing additional assistance to emission intensive trade-exposed industries (EITE) for the
first five years of the scheme; announcement of a new emissions reduction target in the event of
an ambitious international agreement; and measures to account for the impact of voluntary action
to reduce abatement. After the first year of the scheme, carbon prices will revert to being set by
the market.
Depending on the outcome of international negotiations, the CPRS will help achieve emission
reductions of between 5 and 25 per cent below 2000 levels. From the scheme’s outset it will cover
around 75 per cent of Australia’s emissions, including those from stationary energy, industrial
processes, transport, fugitive emissions, waste and forestry.
Draft legislation was released earlier this year to implement this policy. As at October 2009 this has
been passed by the House of Representatives, but voted down in the Senate. It is expected to be
brought before the Senate again in November 2009.
Electricity Supply and Demand Outlook
Projected electricity demand in New South Wales is currently expected to exceed supply by
2015-16.
The AEMO provides the supply and demand outlook for each State, which includes:
an indication of the capability of existing and committed supply to meet projected demand
for the next ten years
the Low Reserve Condition (LRC) point, which indicates when reserves will fall below the
required level to avoid possible shortage of supply
the Reserve Deficit in megawatts (MW), which indicates the additional reserves potentially
required at the LRC point.
This is trial version
www.adultpdf.com
Electricity Industry Overview ______________________________________________________________________
12 _________________________________________ Auditor-General’s Report to Parliament 2009 Volume Three
Summary Overview of LRC and Reserve Deficit
State LRC Point Reserve Deficit (MW)
New South Wales 2015-16 182
Queensland 2014-15 34
Victoria and South Australia (combined) 2013-14 17
South Australia (local) 2012-13 68
Tasmania Beyond 2018-19
Source: AEMO Statement of Opportunities 2009.
Highest Demand in Summer
For New South Wales, the tightest supply-demand conditions are expected to occur during summer.
The summer supply–demand outlook for the New South Wales region for the next ten years is shown
in the chart below:
Source: Extracted from AEMO Electricity Statement of Opportunities for the National Electricity Market 2009.
(a) Allocated Installed Capacity: Represents the current projection of installed generation capacity allocated to meet
the reliability requirement for the region (Capacity for Reliability). It includes the available capacity within a region
plus the allocated net import from neighbouring regions.
(b) Additional Capacity Required: Represents the difference between the Capacity for Reliability and the Allocated
Installed Capacity or the MT PASA (Medium Term Projected Assessment of System Adequacy) Available Capacity. This
also represents the reserve deficit.
(c) MT PASA Available Capacity: Represents the operational projection of installed generation capacity available to meet
the scheduled maximum demand. This projection is taken from the preliminary MT PASA calculation performed using
available capacity bid into MT PASA as at 24 July 2007.
(d) Capacity for Reliability: represents the capacity that needs to be allocated to meet the minimum reserve level.
The New South Wales low reserve condition point occurs in 2016 when the additional capacity
required is 182 megawatts. If this additional capacity is not created by this time, supply will fall
below minimum reserve levels (as indicated by the solid line), which may necessitate load shedding
and periods of blackouts for some customers.
This is trial version
www.adultpdf.com