AUDITOR-GENERAL’S REPORT FINANCIAL AUDITS Volume Three 2009 focusing on Electricity _part4 pot
Bạn đang xem bản rút gọn của tài liệu. Xem và tải ngay bản đầy đủ của tài liệu tại đây (138.47 KB, 9 trang )
Electricity Industry Overview ______________________________________________________________________
22 _________________________________________ Auditor-General’s Report to Parliament 2009 Volume Three
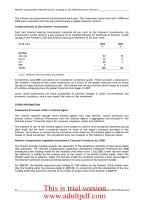
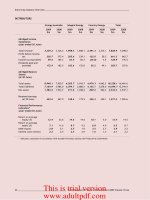
DISTRIBUTORS
Energy Australia Integral Energy Country Energy Total
2009 2008 2009 2008 2009 2008 2009 2008
$m $m $m $m $m $m $m $m
Abridged Income
Statements
(year ended 30 June)
Total revenue 3,339.2 3,136.3
1,998.4
1,848.1
2,491.3
2,314.1 7,828.9 7,298.5
Profit before income
tax 330.7 373.4
205.6
239.1
125.0
50.2 661.3 662.7
Income tax equivalent 99.4 105.3
63.4
66.7
(34.0)
4.5 128.9 176.5
Dividends paid and
provided 172.9 183.5
103.6
125.0
29.2
49.1 305.7 357.6
Abridged Balance
Sheets
(at 30 June)
Total assets 8,948.1 7,920.7
4,305.7
3,918.7
4,974.3
4,642.2 18,228.1
16,481.6
Total liabilities 7,164.9 5,986.0
3,394.7
2,880.5
4,135.1
3,678.0 14,694.7
12,544.4
Net assets 1,783.2 1,934.7
911.0
1,038.2
839.2
964.2 3,533.4 3,937.1
Retained earnings
(at 30 June) 422.6 467.0
168.4
179.5
426.3
430.1 1,017.3 1,076.6
Financial Performance
Indicators*
(year ended 30 June)
Return on average
equity (%) 12.4 23.6
14.6
14.6
10.1
5.0 12.4 14.5
Return on average
assets (%) 7.1 11.6
8.7
9.2
6.8
4.9 6.5 8.7
Debt/equity 2.8 2.1
2.5
1.9
3.5
2.7 2.9 2.2
Interest cover (times) 2.2 2.5
2.4
2.9
1.6
1.3 2.1 2.2
* Indicators calculated in accordance with standard formulas used by the Productivity Commission
This is trial version
www.adultpdf.com
Section Two
23
Commentary on Government Agencies
This is trial version
www.adultpdf.com
This is trial version
www.adultpdf.com
25
Minister for Energy
Electricity Generators:
Delta Electricity
Eraring Energy
Macquarie Generation
Electricity Distributors:
Country Energy
EnergyAustralia
Integral Energy Australia
TransGrid
Refer to Appendix 1 for:
Cobbora Unincorporated Joint Venture
Cobbora Management Company Pty Limited
Cobbora Coal Unit Trust
CCP Holdings Pty Limited
This is trial version
www.adultpdf.com
This is trial version
www.adultpdf.com
Auditor-General’s Report to Parliament 2009 Volume Three _________________________________________ 27
Delta Electricity
AUDIT OPINION
The audits of Delta Electricity and its controlled entities’ financial reports for the year ended
30 June 2009 resulted in unqualified Independent Auditor’s Reports.
Unless otherwise stated, the following commentary relates to the consolidated entity.
The Independent Auditor’s Reports for Delta Electricity and Delta Electricity Australia Pty Ltd drew
attention to significant uncertainty regarding forecast cash flows which may impact asset values.
Delta Electricity and Delta Electricity Australia Pty Ltd calculate the carrying value of their power
stations using estimated discounted cash flows. These estimates are subject to volatility,
particularly from the potential impacts of the Federal Government’s proposed Carbon Pollution
Reduction Scheme. The ultimate extent of this impact cannot presently be determined and this
creates significant uncertainty as to whether the estimated discounted cash flows will be realised.
KEY ISSUES
Restructure of Electricity Industry
The Government is proposing to contract Delta Electricity’s electricity trading rights to the private
sector and to sell four of Delta Electricity’s development sites. See the ‘Electricity Industry
Overview’ section appearing earlier in this report for details on the sale and the Government’s final
policy position on its ‘Energy Reform Strategy’ announced in September 2009.
PERFORMANCE INFORMATION
Delta Electricity provided the following information regarding its performance:
Year ended 30 June Target Actual
2009 2009 2008 2007 2006
Generation of electricity
– gigawatt hours sent out 24,801 23,746 24,054 21,952 21,948
Plant availability
– total all stations (%) 82.0 86.8 77.3 75.5 86.5
Thermal efficiency
– total all stations (%) 35.6 34.6 35.0 35.2 35.0
Earnings before interest and tax ($m) 226.8 146.4 212.1 244.9 282.6
Return on equity (%) (a) 12.8 7.5 12.7 64.9 22.5
Return on assets (%) (b) 7.6 4.5 7.7 7.6 13.2
Interest cover (times) 4.7 3.2 4.9 5.6 5.9
Debt to equity (%) 114.2 130.3 86.5 306.2 79.9
Total distributions to government ($m) 178.3 84.6 180.0 174.7 201.9
Capital expenditure ($m) 409.4 379.5 251.8 150.4 97.4
(a) profit after tax divided by equity.
(b) earnings before interest and tax divided by total assets.
This is trial version
www.adultpdf.com
Delta Electricity _________________________________________________________________________________
28 _________________________________________ Auditor-General’s Report to Parliament 2009 Volume Three
Plant availability measures the total time generating units were either in service or able to be
placed in service over a given period. Delta Electricity’s plant availability for 2008-09 was higher
due to a lower number of unexpected technical difficulties.
Thermal efficiency is a performance measure commonly used by power stations. The thermal
efficiency percentages above indicate the average percentage of energy contained in the coal used
by Delta’s Electricity’s power station to produce the electricity. That is, a measure of the overall
fuel conversion efficiency for the electricity generation process.
Thermal efficiency is influenced by the design, age and condition of a power plant, as well as by
the quality of coal used. New South Wales government owned coal fired power stations outperform
reported worldwide averages for thermal efficiency. A brand new state of the art power station
could expect to achieve a thermal efficiency in excess of 45 per cent.
Most financial performance measures were below target, driven by increases in generating costs,
mostly relating to coal purchases, and lower prices and volumes for electricity sold.
Debt to equity during 2008-09 increased due to an increase in borrowings from New South Wales
Treasury Corporation to finance construction of the Colongra gas turbine. In addition, a finance
lease relating to the Colongra gas pipeline was also recognised for the first time. In the absence of
these two developments the debt to equity ratio would have been 92.8 per cent.
Distributions to government comprised a dividend of $59.2 million ($124 million in 2007-08) and
taxation of $25.4 million ($55.6 million). As Delta Electricity’s retained earnings have reduced to
zero, its ability to pay dividends in the future will be limited to future earnings.
OTHER INFORMATION
Valuation and Remaining Life of Power Station Assets
The carrying value of power stations represents 26.7 per cent of the power stations’ gross
replacement cost, which indicates on average the power stations have slightly over one quarter of
their service potential remaining.
Delta Electricity’s power stations have a gross replacement cost of $10.4 billion. After deducting
accumulated depreciation of $7.4 billion and accumulated impairment of $225 million, the carrying
value of Delta Electricity’s power stations was $2.8 billion.
The remaining lives for most of Delta Electricity’s power stations range from 21 to 31 years.
Munmorah has an estimated remaining life of four to five years, with a generation capacity of 600
megawatts. The retirement of Munmorah will be offset by the commissioning of Colongra, due for
2009-10 which will add 667 megawatts to the State’s generation capacity.
Major Projects
Colongra Gas Turbine Power Station
Delta Electricity is finalising construction of a $574 million 667 megawatt gas turbine power station
near its existing Munmorah coal fired power station. The new station will operate as a peaking
plant supplying electricity at short notice during times of high demand. The plant is scheduled for
completion in November 2009.
This is trial version
www.adultpdf.com
_________________________________________________________________________________ Delta Electricity
Auditor-General’s Report to Parliament 2009 Volume Three _________________________________________ 29
Colongra Gas Pipeline - Public Private Partnership
Delta Electricity entered into a public private partnership for the gas pipeline supplying the
Colongra gas turbine. The private sector partner owns and operates the gas pipeline, and has
responsibility for its financing and construction. Construction of the pipeline was completed
this year.
Delta Electricity pays a monthly fee in return for the availability of gas transportation and storage
services over a period of 20 years. Upon commencement of the lease, Delta Electricity recognised a
lease asset and liability of $104 million.
Joint Venture Co-generation Plants
In 2002 Delta Electricity, through its controlled entity Delta Electricity Australia Pty Ltd, entered
into a joint development to design, construct and operate two 30 megawatt renewable energy
electricity co-generation plants at Condong and Broadwater in northern New South Wales.
Construction reached practical completion in October and November 2008 for Condong and
Broadwater respectively.
These plants predominately burn bagasse, the waste material left after crushing sugar cane, to
produce electricity to power nearby sugar mills and homes.
Following completion of the plants, the joint venture began earning revenue from electricity and
steam sales. The joint venture also earns income from the sale of renewable energy certificates
obtained from the production of renewable energy.
Potential Development Sites
Delta Electricity has identified four sites for new generation capacity. Proposals have been
developed for construction of new gas turbines at Marulan (near Goulburn) and Bamarang (near
Nowra), the rehabilitation of Munmorah as a gas or coal fired plant, and construction of new
generation facilities at Mount Piper using either coal or gas.
Delta Electricity is working to finalise the relevant approvals for these projects.
The Government’s revised energy reform strategy, introduced to help secure the future supply of
electricity in New South Wales, has identified these sites as suitable for the sale to the private
sector.
Coal Supply
Coal prices have increased significantly in recent years. This has increased the risk for Delta
Electricity in securing supplies of coal at competitive prices. To mitigate this risk Delta Electricity,
through its subsidiary Mid West Primary Pty Ltd, has entered into a joint venture with the other
State owned generators to explore for and purchase coal resources in Central West New South
Wales. Further details appear in the Energy Industry Overview earlier in this report.
This is trial version
www.adultpdf.com
Delta Electricity _________________________________________________________________________________
30 _________________________________________ Auditor-General’s Report to Parliament 2009 Volume Three
FINANCIAL INFORMATION
Abridged Consolidated Income Statements
Year ended 30 June Consolidated Parent
2009 2008 2009 2008
$’000 $’000 $’000 $’000
TOTAL REVENUE 1,004,587 1,016,923 997,375 1,016,896
PROFIT BEFORE FINANCE COSTS,
DEPRECIATION AND TAX 242,680 309,944 250,955 311,688
Finance costs 45,654 42,861 42,156 42,861
Depreciation 96,308 97,831 93,556 97,831
PROFIT BEFORE TAX 100,718 169,252 115,243 170,996
Income tax equivalent expense 25,369 55,560 29,684 56,083
PROFIT AFTER TAX 75,349 113,692 85,559 114,913
Dividend provided 59,221 124,422 59,221 124,422
Total revenue included $983 million in electricity sales compared to $1.0 billion in the previous
year. The decrease was due to a combination of a reduction in electricity sales and a decrease in
the average price for electricity from $41.66 to $38.85 per megawatt hour. Profit before tax also
decreased due to an increase in generation costs of $70.8 million, largely driven by coal price
increases.
Abridged Consolidated Balance Sheets
At 30 June Consolidated Parent
2009 2008 2009 2008
$’000 $’000 $’000 $’000
Current assets 292,490 208,032 337,332 248,350
Non-current assets 2,987,732 2,530,834 2,883,100 2,418,680
TOTAL ASSETS 3,280,222 2,738,866 3,220,432 2,667,030
Current liabilities 417,094 565,351 407,512 561,645
Non-current liabilities 1,863,497 1,276,545 1,797,447 1,207,302
TOTAL LIABILITIES 2,280,591 1,841,896 2,204,959 1,768,947
NET ASSETS 999,631 896,970 1,015,473 898,083
Current assets increased mainly due to a $33.6 million increase in financial assets. This relates to
changes in the value of derivative instruments used to manage energy price risk driven by changes
in the forecast price of electricity.
This is trial version
www.adultpdf.com