AUDITOR-GENERAL’S REPORT FINANCIAL AUDITS Volume Three 2010_part3 pot
Bạn đang xem bản rút gọn của tài liệu. Xem và tải ngay bản đầy đủ của tài liệu tại đây (112.66 KB, 9 trang )
________________________________________________________________________________ Financial Analysis
Auditor-General’s Report to Parliament 2010 Volume Three __________________________________________ 17
Unless otherwise stated, the following commentary relates to the Total State Sector.
REVENUES
Taxation
Total taxation revenue increased from $15.2 billion to $18.0 billion (18.3 per cent) over the last
five years (an average of 3.7 per cent per annum).
5.0
5.4
6.0
6.1
5.9
4.8
6.0
5.5
4.1
5.2
1.7
2.0
1.9
2.2
2.2
1.2
1.4
1.3
1.3
1.5
2.5
2.6
3.1
3.2
3.2
-
2.0
4.0
6.0
8.0
10.0
12.0
14.0
16.0
18.0
20.0
2006
2007
2008
2009
2010
$b
Tax Revenue 2006 to 2010
Payroll Tax
Stamp Duty
Land Tax
Gambling Tax
Other
Tax revenue increased by $1.1 billion when compared to 2008-09. Stamp duty increased by
approximately $1.1 billion (26.1 per cent) predominantly due to increase in transfer duty on
residential property. Payroll tax decreased by 3.4 per cent, land tax increased by 1.4 per cent and
gambling tax increased by 12.3 per cent from the prior year.
The following table details tax collected between 2005 and 2010 and The Treasury’s forecasts for
General Government Sector tax collections over the next 4 years.
-
1.0
2.0
3.0
4.0
5.0
6.0
7.0
8.0
2005
2006
2007
2008
2009
2010
2011
2012
2013
2014
$b
Trends in Tax Collections
Payroll Tax
Stamp Duty
Land Tax
Gambling Tax
This is trial version
www.adultpdf.com
Financial Analysis _________________________________________________________________________________
18 __________________________________________ Auditor-General’s Report to Parliament 2010 Volume Three
Commonwealth Grants
The Government received significant new grants of $6.3 billion ($3.1 billion) including the
Australian Governments’ Nation Building – Economic Stimulus Plan and National Building for the
Future Plan (National Partnership Payments).
11.9
12.0
13.4
7.6
6.6
6.6
-
3.1
6.3
-
2.0
4.0
6.0
8.0
10.0
12.0
14.0
16.0
2008
2009
2010
$b
Commonwealth Grants
General Purpose Payments
National Agreements
National Partnerships
General Purpose Payments
Commonwealth General Purpose GST grants increased by $1.4 billion from 2008-09. This was
primarily due to a change in the estimate of the total GST pool available for distribution to the
States, compared to the estimates provided in the 2009-10 Commonwealth Budget. The estimate of
total GST revenue has increased by $11.6 billion for the four years 2009-10 to 2012-13 and stems
from higher forecast growth for taxable consumption as the Australian economy recovers from the
global downturn.
National Agreements (excludes stimulus funding)
National Agreements set out the policy objectives in six key service delivery areas, covering
healthcare, education, skills and workforce development, disabilities, affordable housing and
national Indigenous reform. Each agreement establishes the roles and responsibilities between
levels of government and sets out the high level objectives, outcomes and performance indicators,
as agreed by all jurisdictions (source: 2010-11 Budget Statement).
In 2009-10, the State received the following significant National Agreement payments:
National Agreements Amount
$’000
National Healthcare (recurrent) 3,711,041
National Schools (recurrent) 1,104,539
National Affordable Housing (recurrent) 74,537
National Affordable Housing (capital) 305,682
Home and Disability Care Program (recurrent) 308,631
National Skills and Workforce (recurrent) 438,559
This is trial version
www.adultpdf.com
________________________________________________________________________________ Financial Analysis
Auditor-General’s Report to Parliament 2010 Volume Three __________________________________________ 19
National Partnerships (includes stimulus funding)
National Partnerships are time limited arrangements that focus on delivering specific outputs or
projects in areas of nationally significant reform or achieving service delivery improvements. The
Australian Government gives payments to support National Partnerships to help progress the
reforms and/or reward jurisdictions for achieving agreed performance benchmarks (source: 2010-11
Budget Statement).
In 2009-10, the State received the following significant National Partnership Payments:
National Partnerships Amount
$’000
Primary Schools for the 21st Century (capital) 1,623,659
Nation Building and Job Plans (capital) 1,312,647
National Land Transport (AUSLINK) (capital) 1,248,906
EXPENSES
Total State Sector Expenses by Nature
Total expenses increased from $60.2 billion in 2008-09 to $63.8 billion in 2009-10, an increase of
six per cent.
-
5.0
10.0
15.0
20.0
25.0
30.0
35.0
Employee Costs
Other
Grants and
Subsidies
Depreciation
and
Amortisation
Interest
$b
Total State Sector Expenses by Nature
2009
2010
This is trial version
www.adultpdf.com
Financial Analysis _________________________________________________________________________________
20 __________________________________________ Auditor-General’s Report to Parliament 2010 Volume Three
Employee Costs
Employee costs (excluding superannuation costs) increased by approximately 3.5 per cent
compared to 7.5 per cent in the prior year.
The increase in 2008-09 was significantly higher than that in 2009-10 due to award increases at the
Department of Education and Training and Department of Health and increased workers’
compensation claims incurred by NSW Self Insurance Corporation.
Employee costs do not include increases in superannuation obligations resulting from changes to
assumptions used to calculate these obligations (e.g. movements in discount rates and other
economic assumptions). These costs are reported in Other Economic Flows – Other Comprehensive
Income.
Other Expenses
Other expenses increased by $449 million to $16.8 billion. The increase includes costs associated
with privatising the Energy Sector, NSW Lotteries and WSN Environmental Solutions. It also includes
the cost of compensation payments made as a result of the Government’s decision to stop work on
the Sydney Metro project.
Costs to 30 June 2010
$’000
2009
$’000
2008
$’000
TOTAL
$’000
Compensation Payments –
Sydney Metro Authority
93,500 93,500
Privatisation Costs – Energy
Sector Reform
78,826 24,677 20,057 123,560
Privatisation Costs – NSW
Lotteries
5,307 1,419 6,726
Privatisation Costs – WSN
Environmental Solutions
4,140 1,379 5,519
I understand further costs will be incurred on all these transactions.
This is trial version
www.adultpdf.com
________________________________________________________________________________ Financial Analysis
Auditor-General’s Report to Parliament 2010 Volume Three __________________________________________ 21
Financial Information
Statement of Financial Position
Year ended 30 June General Government Total State Sector
2010 2009 2010 2009
$m
$m
$m
$m
ASSETS
Financial Assets
Cash and Cash Equivalents 3,071 3,350 6,299 5,541
Receivables 6,176 5,556 6,775 7,197
Tax Equivalents Receivable 286 245
Financial Assets at Fair Value 6,620 5,272 19,857 15,763
Advances Paid 905 780 434 319
Deferred Tax Equivalents 5,734 4,576
Equity Investments 79,692 73,696 1,305 1,050
Total Financial Assets 102,484 93,475 34,670 29,870
Non Financial Assets
Inventories 276 250 1,349 1,298
Forestry Stock and Other Biological Assets 7 7 669 560
Assets Classified as Held for Sale 133 115 267 173
Investment Properties 269 274 1,023 1,023
Property, Plant and Equipment 122,728 113,533 234,610 214,271
Intangibles 1,245 977 2,628 2,242
Other 1,116 1,023 1,497 1,374
Total Non Financial Assets 125,774 116,179 242,043 220,941
TOTAL ASSETS 228,258 209,654 276,713 250,811
LIABILITIES
Deposits Held 76 72 206 182
Payables 3,739 3,345 6,541 6,224
Tax Equivalents Payable 19 7
Borrowing and Derivatives at Fair Value 20 21 56,866 47,777
Borrowings at Amortised Cost 19,053 16,582 2,411 2,179
Advances Received 811 835 805 835
Employee Provisions 10,910 9,888 12,944 11,911
Superannuation Provision 32,722 29,423 34,530 31,003
Deferred Tax Equivalent Provision 796 746
Other Provisions 5,717 5,501 7,326 6,642
Other 3,032 2,620 3,721 3,444
TOTAL LIABILITIES 76,895 69,040 125,350 110,197
NET ASSETS 151,363 140,614 151,363 140,614
NET WORTH
Accumulated Funds 23,239 23,605 60,398 60,250
Reserves 128,124 117,009 90,965 80,364
TOTAL NET WORTH 151,363 140,614 151,363 140,614
This is trial version
www.adultpdf.com
Financial Analysis _________________________________________________________________________________
22 __________________________________________ Auditor-General’s Report to Parliament 2010 Volume Three
ASSETS
Total Assets have increased from $206 billion in 2005-06 to $277 billion in 2009-10, an increase of
34.5 per cent over five years.
-
20.0
40.0
60.0
80.0
100.0
120.0
140.0
Land and Buildings
Plant and
Equipment
Infrastructure
Systems
Financial Assets at
Fair Value
$b
Trend in Total Assets
2006
2007
2008
2009
2010
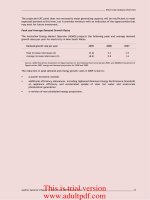
Property, Plant and Equipment
Property, Plant and Equipment represents the State’s physical assets of land and buildings, plant
and equipment and infrastructure systems.
These assets are used to provide or support service delivery. Over the last five years the State has
invested $58.3 billion in these assets, which on average represents an investment of $11.7 billion
per annum.
-
2.0
4.0
6.0
8.0
10.0
12.0
14.0
16.0
18.0
2006
2007
2008
2009
2010
$b
Additions and Revaluations
Additions
Revaluations
Additions to property, plant and equipment totalled $16.4 billion during 2009-10. These were
funded, in part, by National Partnership Payments of $5.0 billion from the Australian Government.
This is trial version
www.adultpdf.com
________________________________________________________________________________ Financial Analysis
Auditor-General’s Report to Parliament 2010 Volume Three __________________________________________ 23
Revaluations of existing assets included:
NSW Land and Housing Corporation’s revaluation of its residential property portfolio,
including residential land held for redevelopment upwards by $2.9 billion
Country Energy’s revaluation of its electricity system assets upwards by $1.2 billion.
LIABILITIES
Total liabilities have increased by 13.8 per cent in the past twelve months from $110 billion to
$125 billion. This was largely due to increased borrowings and actuarial movements in the State’s
Defined Benefit Superannuation obligations and increases in other provisions.
50.0
49.6
59.3
54.8
44.0
46.0
48.0
50.0
52.0
54.0
56.0
58.0
60.0
62.0
Borrowings
Provisions
$b
Borrowings and Provisions
2009
2010
Borrowings
Domestic and foreign borrowings increased by $9.3 billion during 2009-10. This was primarily driven
by an increase in the borrowings of New South Wales Government agencies, managed by the New
South Wales Treasury Corporation (T-Corp), to fund infrastructure programs. The 2010-11 Budget
Papers forecast $62.2 billion of capital spending over the four years to June 2014. The remainder of
the Australian Government's economic stimulus and nation building grants is included in the
projected $16.6 billion investment in infrastructure for 2010-11. TCorp expects its loans to clients
to increase by $18.0 billion over the four years.
Superannuation Provisions
Included in the movement in provisions is an increase of $3.5 billion in the unfunded
superannuation liabilities of the Total State Sector. The State has the following liabilities:
Scheme Unfunded
Liability
2010
$m
Unfunded
Liability
2009
$m
State Superannuation – Pooled Fund 33,015 29,664
Parliamentary Contributory Superannuation Scheme 269 231
Judges’ Pension Scheme 660 605
Energy Industries Superannuation Scheme 586 503
TOTAL 34,530 31,003
Increases in unfunded superannuation liabilities are primarily due to a decrease in the discount rate
from 5.59 per cent to 5.17 per cent.
This is trial version
www.adultpdf.com
This is trial version
www.adultpdf.com
Auditor-General’s Report to Parliament 2010 Volume Three __________________________________________ 25
Major Capital Projects
The Government publishes its capital infrastructure plans for the current and forward estimates
periods in Budget Paper 4: Infrastructure Statement. In the 2009-10 Infrastructure Statement the
Treasurer announced:
‘Over the four years to 2012-13, New South Wales will undertake a record infrastructure
investment program, the largest in the State’s history, worth around $62.9 billion. In 2009-10,
Total State infrastructure investment is budgeted at $18.0 billion.’
I have reviewed the status of major capital projects as set out in the Infrastructure Statement for
2009-10. Attention was focused on projects with anticipated costs exceeding $30.0 million or more
over the life of the project. I noted that most projects were on track to meet their original
completion date. However, a number of projects have experienced delays:
Agency Project Cost and Description Reasons for delays and/or cost overruns
Department of
Environment,
Climate Change
and Water
$90.3m
Riverbank
Extension of the Program was approved in the
River Red Gum Cabinet Minutes
NSW Police
$74.2m
Upgrade of Core Operating Policing
System
There has been a major delay in the
negotiation of the fixed price contract
Department of
Health
$50.7m
ICT Human Resource Information
System
A combination of additional work to build
common integration deliverables required by
other ICT programs and the complexity of
testing Health awards
Department of
Health
$115m
ICT Patient and Clinical Systems
Phase 2
Delay was caused by Health Services’ inability
to provide resources to implement the
Program
Department of
Health
$67.8m
Local Initiatives 2009-10
Delays were due to higher pre-tender
estimates and latent conditions
Department of
Justice and
Attorney
General
$52.8m
Silverwater Women's Correctional
Centre Staged Development
Increased costs due to security measures
within an operational maximum security
correctional centre and escalation costs
This is trial version
www.adultpdf.com