AUDITOR-GENERAL’S REPORT FINANCIAL AUDITS Volume Four 2008_part2 pptx
Bạn đang xem bản rút gọn của tài liệu. Xem và tải ngay bản đầy đủ của tài liệu tại đây (106.45 KB, 16 trang )
Auditor-General’s Report to Parliament 2008 Volume Four __________________________________________ 11
Department of Education and Training
AUDIT OPINION
The audits of the Department and its controlled entities’ financial reports for the year ended
30 June 2008 resulted in unqualified Independent Auditor’s Reports.
Unless otherwise stated, the following commentary relates to the parent entity.
PERFORMANCE INFORMATION
The New South Wales State Plan provides the overall direction for further improvement and is a
major influence on the Department’s priorities for 2008. Priorities include:
increasing levels of attainment for all students, including increasing the number of students
exceeding the national benchmarks in literacy and numeracy
more students completing Year 12 or recognised vocational training
closing the performance gap between Aboriginal students and all students, at schools and at
the New South Wales Technical and Further Education Commission (TAFE NSW).
Literacy and Numeracy
The State Plan commits the Government to raising students’ literacy and numeracy levels and
improving the outcomes they achieve at school. Achievements in reading and numeracy underpin
the ability of all students to learn effectively in most school subjects. The Department has a
continued focus on improving the literacy and numeracy of New South Wales public school students
and has developed an extensive range of programs for this purpose.
The Audit Office conducted an examination of the Department’s processes to improve literacy and
numeracy. We recommended a series of measures to assist the Department:
sharpen its focus on those individual students at risk,
more effectively target its limited resources and support the needs of individuals, and
more rigorously review its programs and the performance of low achieving schools.
For further information regarding the report, refer to
www.audit.nsw.gov.au/publications/reports/performance/performance_reports.htm
.
Year 12 Retention Rates
In 2007, the Department put in place a range of strategies designed to encourage more students to
complete Year 12. The Department advised us that these initiatives will start to impact positively
on apparent retention rates in 2012 when the 2007 Year 7 cohort are due to reach Year 12. Over
the past five years the apparent retention rates from Years 7 to 12 have remained relatively stable,
with only minor fluctuations from year to year. In 2007, the overall retention rate decreased
slightly by 0.6 per cent to 64.5 per cent. However, the rates for Aboriginal students, geographically
isolated students and students from low socio-economic status backgrounds all improved. The large
annual fluctuations in retention rates for students from non-English speaking backgrounds are
largely a consequence of the movement of these students in and out of the government school
system.
This is trial version
www.adultpdf.com
Department of Education and Training ______________________________________________________________
12 ___________________________________________Auditor-General’s Report to Parliament 2008 Volume Four
Retention Rates from Years 7 to 12 for Government Schools
Year ended 31 December 2003 2004 2005 2006 2007
% % % % %
All students 65.0 65.8 65.8 65.1 64.5
Aboriginal students 29.2 29.9 29.4 28.7 30.9
Students from language backgrounds
other than English 104.6 108.2 109.5 105.4 101.8
Students from low socio-economic
status backgrounds
55.0 56.4 55.5 52.9 53.2
Geographically isolated students 48.8 43.7 45.6 41.3 48.6
Source: DET Statistical Compendium 2007.
Notes:
Retention rates are ‘apparent’ as they do not track individual students through their secondary schooling.
Retention rates for students from low socio-economic status backgrounds and geographically isolated students are
based on participating schools in 2007.
Year 12 retention rates can exceed more than 100 per cent due to a number of factors including migration of
students from interstate and overseas.
Retention rates for full-time students by State (2003-2007) for Years 7/8 to 12
Years NSW VIC QLD SA WA TAS NT ACT National
2007 64.5 73.9 71.1 64.0 63.1 63.3 69.4 96.6 68.3
2006 65.1 72.6 71.6 61.9 65.1 63.2 72.3 103.2 68.5
2005 65.8 74.0 73.0 61.7 65.4 65.5 70.5 99.6 69.4
2004 65.8 74.4 75.3 58.0 65.9 70.7 72.0 100.5 69.8
2003 65.0 74.9 76.1 56.8 64.8 74.5 69.0 101.0 69.6
Source: DET Statistical Compendium 2007.
Notes:
Retention rates are ‘apparent’ as they do not track individual students through their secondary schooling.
Care should be exercised in the interpretation of apparent retention rates as the method of calculation does not
take into account a range of factors including:
Differing enrolment policies across jurisdictions (which contribute to different age-grade structures).
Students enrolled in Year 12 on a part-time basis or repeating a year.
Movements of students between States and between school sectors.
Impact of full-fee paying overseas students.
Varying enrolment patterns in which students choose to complete their secondary schooling at TAFE NSW.
Apparent retention rates can exceed more than 100 per cent due to a number of factors including migration of
students from interstate and overseas.
New South Wales retained its ranking of fifth amongst all States and Territories but is still below
the national average.
The Achievement Gap for Aboriginal Students
Literacy and numeracy targets set under the New South Wales State Plan for Aboriginal students are
to eliminate the gap between Aboriginal students and all students by 2016.
This is trial version
www.adultpdf.com
______________________________________________________________ Department of Education and Training
Auditor-General’s Report to Parliament 2008 Volume Four __________________________________________ 13
The comparison of Year 3 and Year 5 Aboriginal students’ basic skills test (BST) results for numeracy
and literacy against all student peers show significant gaps. From 2003 to 2007, BST results for
Year 5 Aboriginal students have shown a gradual improvement, reducing the gap from 13.3 per cent
to 11.8 per cent for numeracy. However, for literacy, the gap increased from 13.3 per cent to
14.4 per cent. The gap for Year 3 literacy has reduced from 19.3 per cent to 17.8 per cent while
the gap for Year 3 numeracy increased slightly from 13.4 per cent to 13.7 per cent.
In 2007, there were 7,115 students (6,663 in 2006) who were recognised on the HSC Distinguished
Achievers List, of which 0.4 per cent (0.2 per cent) were Aboriginal students.
The Department has made it a priority to allocate funding of $65.0 million over four years to
improve the academic achievements of Aboriginal students, by designing specialised teaching
programs in order to reduce the gap. The Department advised us that of the $13.0 million allocated
in 2007-08, $9.5 million was spent.
Government Schools
NSW
2005-06
NSW
2006-07
National
2006-07
NSW Ranking
amongst all
States and
Territories (d)
NSW Ranking
Previous
Year (d)
Recurrent Expenditure ($) per
student on Government
Schools (a)
Primary
10,195 10,643 10,938 7 7
Secondary 12,823 13,329 13,315 4 5
Overall
11,279 11,756 11,874 7 6
Student to Teaching Staff
Ratios – Government
Schools (b)
Primary
16.2 16.2 15.7 1 2
Secondary 12.4 12.5 12.3 4 5
Overall
14.4 14.4 14.2 2 3
Full–Time Student Enrolment –
Government Schools as a
percentage of all schools (c)
Primary
70.0 69.8 70.2 5 5
Secondary
62.4 62.4 61.3 4 4
Overall
66.7 66.5 66.4 5 5
(a) Source: Ministerial Council of Education, Employment Training and Youth Affairs – National Report on Schooling in
Australia, 2007. Incorporates both salaries and non-salary costs. Includes actual or notional payroll tax and notional
eight per cent user cost of capital.
(b) Source: Australian Bureau of Statistics, Schools Australia 2007 (Table 26).
(c) Sources: Australian Bureau of Statistics, Schools Australia 2007 (Table 2-1, 2-2 & 2-2a).
(d) The rankings range from one to eight (highest to lowest).
Note: Care should be taken when comparing different jurisdictions as areas of non-comparability continue to exist e.g.
there can be large differences between city and country staff ratios within different jurisdictions.
New South Wales’ expenditure per student was higher than the national average for secondary
schools in 2006-07. Expenditure per primary student in New South Wales increased from $10,195 in
2005-06 to $10,643 in 2006-07. At this level it has fallen below the national average of $10,938 and
has the second lowest expenditure per primary school student. The primary and secondary student
to teacher ratios remained higher than the national average. The overall ratio of 14.4 remained
higher than the New South Wales private sector ratio of 13.8 students per teacher.
This is trial version
www.adultpdf.com
Department of Education and Training ______________________________________________________________
14 ___________________________________________Auditor-General’s Report to Parliament 2008 Volume Four
In comparison with other jurisdictions, New South Wales continues to be ranked fifth in attracting
student enrolments to government schools.
The proportion of all students enrolling in government schools has been declining for the past
ten years. The most significant decline has been in secondary schools, falling from 66.9 per cent in
1998 to 62.4 per cent in 2007. Overall, the reduction has been 4.5 per cent. The movement of
students between sectors is now starting to stabilise. The chart below illustrates the decline over
the last decade.
NSW Government Schools - Proportion of Full Time Enrolments
54
57
60
63
66
69
72
75
1998 1999 2000 2001 2002 2003 2004 2005 2006 2007
Year
%
Primary Secondary Total
Source: Australian Bureau of Statistics, Schools Australia 2007 (Table 7)
Workers’ Compensation Claims
2006* 2007* 2008*
Workers’ compensation premium (S’000) 151,125 126,120 128,679
Total number of claims ** 10,762 12,376 13,699
Total number of claims incurring cost 5,782 6,008 6,048
Number of working days lost 36,621 43,721 43,231
Number of stress claims incurring cost 849 949 829
Number of working days lost due to stress claims 14,294 19,816 16,733
Source: DET Statistics.
* Figures represent data in respect of the year in which the incident occurred. Therefore the total days lost are higher for
the earlier years due to the passage of more time.
** The data for 2006 and 2007 includes incident notification only claims. This data has not been recorded in previous years
and therefore is not comparable to past years.
The workers’ compensation insurance premium increased slightly in 2007-08 while the total number
of claims incurring costs rose 0.7 per cent. The premiums paid for the financial year 2007-08
exceeded the benchmark set by the Treasury Managed Fund by $19.4 million. The Department had
to fund the excess.
Under the ‘Safe Working and Learning Strategy’, the Department specified targets to be met by
June 2008. These included a 20 per cent reduction in workplace injuries, 15 per cent reduction in
the average cost of claims and 20 per cent reduction in the duration of workplace injuries.
This is trial version
www.adultpdf.com
______________________________________________________________ Department of Education and Training
Auditor-General’s Report to Parliament 2008 Volume Four __________________________________________ 15
A comparison between the 2004-05 figures (base data) and the 2006-07 figures indicate that the
Department has achieved reductions, however they did not meet the specified targets. The
workplace injuries reported have experienced an eight per cent increase in the frequency of claims
incurring a cost. The average cost of claims returns a 14 per cent reduction and the average time
lost due to workplace injury has reduced by 15 per cent.
OTHER INFORMATION
Department
We identified some minor opportunities for improvement and reported them to management.
Schools
For the school financial year ended 30 November 2007, we audited financial transactions at
57 primary schools, 11 high schools, two hospital schools, one special purpose school and one
central school (K-12).
We identified opportunities for schools to improve their internal controls and general compliance
with Departmental guidelines. We have written to the relevant school Principals about these
matters. Many of our findings were similar to those of the previous year. The Department has
advised us that they communicate common findings to all schools and direct them to take
corrective action.
Connected Classrooms Program (CCP)
The CCP consists of three components with a total investment of $158 million over four years. The
Interactive Classroom Project (ICP) at a cost of $66.0 million, will equip every New South Wales
public school with an interactive whiteboard, data projector, control computer, network device
and video conferencing components. The Learning Tools Project, costing $29.0 million, will upgrade
student email, individual online working space for all students and teachers and online access to
student reports for parents. The Network Bandwidth Enhancement Project, at a cost of
$63.0 million for network upgrades, will increase bandwidth speed and secure browsing and content
filtering to better enable interactive learning environments.
At 30 June 2008, the Department had installed 200 Interactive Classrooms and upgraded schools
with additional bandwith. Costs to date are reflected in the table below:
Year ended 30 June 2008
$’000
Interactive Classrooms Project 6,046
Learning Tools Project 2,224
Network Bandwidth Enhancement Project
8,918
Total
17,188
Public Private Partnership Projects for New Schools
In December 2005, the Department finalised a $177 million contract to privately finance an
additional ten New South Wales government schools. The 30 year contract is to design, finance,
construct and provide certain operational services. These schools are located in the western,
north-western and south-western sectors of Sydney as well as the Hunter and Central Coast regions.
The schools will be built on Department land and leased to the service provider, who will sublease
the site back to the Department.
This is trial version
www.adultpdf.com
Department of Education and Training ______________________________________________________________
16 ___________________________________________Auditor-General’s Report to Parliament 2008 Volume Four
Seven schools under this project, Ashtonfield Public School, Halinda Special School, Tullimbar
Public School, Ropes Crossing Public School, John Palmer Public School, Denison College of
Secondary Education (Kelso High Campus) and Warnervale Public School have been completed to
date. As at June 2008, the Department has recognised $68.0 million as assets with a corresponding
liability. A further three schools, Rouse Hill High School, Elderslie Public School and Middleton
Grange Public School, are to be completed in early 2009. This will result in a further recognition of
about $37.2 million of assets with a corresponding liability.
Under the agreement, the Department will pay the contractor $10.7 million per annum
CPI indexed, which includes the repayment of the finance lease liability, financing costs and regular
service costs for all ten schools.
We understand that Kariong Mountains High School was included as a variation to the Public Private
Partnership contract in October 2008 and the new school is anticipated to be completed by
February 2010.
The Department has advised us that savings in the order of 23 per cent over traditional Department
delivery methods of individual tenders and contracts were achieved. We will continue to monitor
the progress of the projects.
School Facilities and Building Maintenance
Last year we reported that the Department’s maintenance plans for school buildings had been
hampered by significant maintenance backlogs. As a result of the additional funding of
$30.0 million in 2007-08, the Department has completed a program of works which reduced the
estimated current maintenance backlog to $50.8 million ($82.6 million in 2006-07). This
maintenance backlog should be considered in the context of the estimated replacement value of
school buildings of $17.9 billion.
Total school maintenance expenditure increased from $241 million in 2006-07 to $246 million in
2007-08. The additional maintenance backlog funding ($30.0 million) for periodic maintenance and
urgent repairs to schools has remained constant compared to the prior year.
The Department provides advice to The Treasury, as part of the State Budget process, on its Total
Asset Management Plan and funding requirements for the provision of education facilities. The
Department uses proceeds from the sale of surplus parts of school sites to improve facilities. In
2007-08 the Department received $1.0 million from such sales compared to a predicted income of
$6.0 million.
Planned Computer Systems Replacement
In 2006, we reported that the Department’s Learning Management and Business Reform (LMBR)
program will replace its finance, payroll and human resources systems and the school management
system over the next four years. Phase 1 implementation costs are estimated at $153 million. The
project incorporates all state government schools, the Department’s regional and state office
locations and TAFE NSW institutes.
A contract was signed in March 2008 and work has commenced on Phase 1 of the program. The
initial stage, due to be completed in February 2009, involves defining the finance, human resources
and payroll business requirements of the Department and preparing the design for an integrated
finance and HR/payroll system for the Department.
Once the design of the new system is approved and accepted by the Department, a series of staged
development and implementation activities will occur into 2010-11.
A Program Steering Committee has been established and is the peak governance body for the
program.
This is trial version
www.adultpdf.com
______________________________________________________________ Department of Education and Training
Auditor-General’s Report to Parliament 2008 Volume Four __________________________________________ 17
A Risk Management methodology and approach has been developed and implemented. The program
reports on major risks to the Department’s Executive and to the Audit and Risk Management
Committee.
Expenditure in the financial year 2007-08 was $20.7 million. We will continue to review its
implementation and monitor its progress.
Leave Recording
The Department introduced an online leave system called eLAPS (Electronic Leave Application
Processing System) in 2004-05 to improve leave recording. In the past, delays in recording leave
taken have resulted in salary overpayments that were difficult to recover.
As at 30 June 2008, 33.5 per cent (19.6 per cent in 2007) of all leave applications received from
teachers and 29.5 per cent (18.6 per cent) from school administrative and support staff have been
submitted electronically through eLAPS. However a large number of leave applications are still
recorded on the manual system.
Our testing of teacher leave records found 28 instances (13 instances) of leave not recorded in the
Leave Management System.
The Department continues to promote eLAPS in schools by developing programs to educate and
train users. A report on eLAPS usage by schools has been developed and provided to Regional
Directors to enable them to develop strategies to increase eLAPS usage in their regions. We will
continue to monitor usage of the system.
FINANCIAL INFORMATION
Abridged Consolidated Operating Statement
Year ended 30 June Consolidated Parent
2008 2007 2008 2007
$’000 $’000 $’000 $’000
Employee related 7,611,466 7,213,992 6,714,706 6,343,274
Operating expenses 1,648,682 1,601,354 1,346,025 1,304,652
Depreciation and amortisation 391,931 344,972 316,231 250,320
Grants and subsidies 209,712 189,587 239,379 218,762
Other expenses 4,741 7,914 4,741 7,914
TOTAL EXPENSES 9,866,532 9,357,819 8,621,082 8,124,922
TOTAL REVENUE 870,508 754,361 849,946 759,820
Other (losses)/gains (8,977) 19,055 (7,271) 22,695
NET COST OF SERVICES 9,005,001 8,584,403 7,778,407 7,342,407
Less Government contributions
9,123,593 8,753,457 7,879,508 7,514,922
SURPLUS 118,592 169,054 101,101 172,515
This is trial version
www.adultpdf.com
Department of Education and Training ______________________________________________________________
18 ___________________________________________Auditor-General’s Report to Parliament 2008 Volume Four
Employee related expenses represent 77.9 per cent (78.1 per cent) of total expenditure of the
Department. The $370 million increase is primarily due to a three per cent salary increase to
teachers in January 2008 and a four per cent salary increase to administrative staff effective
July 2007.
The increase in total revenue of $90.0 million is primarily due to a $32.0 million increase in school
and community revenue and external receipts, a one-off insurance recovery of $23.0 million, and a
rise in overseas student fees of $8.0 million.
Abridged Consolidated Balance Sheet
At 30 June Consolidated Parent
2008 2007 2008 2007
$’000 $’000 $’000 $’000
Current assets 730,049 701,063 577,133 572,857
Non-current assets 16,751,106 16,579,540 13,772,121 13,616,822
TOTAL ASSETS 17,481,155 17,280,603 14,349,254 14,189,679
Current liabilities 616,847 597,637 472,493 475,403
Non-current liabilities 156,261 107,725 155,575 107,038
TOTAL LIABILITIES 773,108 705,362 628,068 582,441
NET ASSETS 16,708,047 16,575,241 13,721,186 13,607,238
Surplus Properties
At 30 June 2008, the value of surplus properties was $68.7 million. Under the New South Wales
Government’s Total Asset Management policy, the Department, as part of its 2008-09 asset
strategy, developed a three year site disposal plan for surplus vacant sites.
In addition to disposal of these sites the Asset Management Directorate continues to work with
Regions to identify surplus school sites for disposal.
For the financial year 2007-08, 24 school properties, that were surplus to the Department’s needs
and held for sale, were sold for $26.6 million ($109 million).
This is trial version
www.adultpdf.com
______________________________________________________________ Department of Education and Training
Auditor-General’s Report to Parliament 2008 Volume Four __________________________________________ 19
Abridged Program Information
The table below details the Department’s consolidated net cost of services by program.
Program Description 2008 2007
Revenue Expenses Net Cost of
Services*
Net Cost of
Services*
$’000 $’000 $’000 $’000
Pre-school education services in
government schools 2,598 27,865 25,267 24,676
Primary education services in
government schools 245,394 4,151,137 3,903,678 3,720,581
Secondary education services in
government schools 260,396 3,847,279
3,595,875 3,346,313
Non-government schools assistance 11,223
11,223 9,276
TAFE education services 310,768 1,610,173 1,301,455 1,332,855
Grants for education and training
services 9,642 186,295
176,653 160,336
NSW Adult Migrant English Service
(AMES) 41,706 32,560 (9,146) (8,322)
A.C.N. 093 230 374 Pty Limited
(Formerly TAFE Global Pty Ltd) 4
(4) (1,312)
Total all programs 870,508 9,866,532
9,005,001 8,584,403
* Includes gain/(loss) on sale of non-current assets.
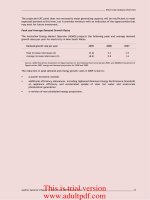
Cost of Providing Government School Education
Using departmental statistics of government school enrolments and relevant program costs, some
broad trends of cost per student for primary and secondary education over the past four years
were:
Year ended 30 June 2005 2006 2007 2008
Actual enrolments(a):
Primary students 436,551 434,366 431,618 430,885
Secondary students 305,027 306,049 307,018 307,260
Total 741,578 740,415 738,636 738,145
Program costs(b):
Primary $m 3,434 3,541 3,721 3,904
Secondary $m 3,125 3,270 3,346 3,597
Total $m 6,559 6,811 7,067 7,501
(a) DET Census date. The 2008 figures are estimated figures derived from the NSW Budget papers 2007-08 as actual
enrolment figures were not available at the time of the preparation of this Report.
(b) Program costs are net cost of services for government primary and secondary schools excluding transfer payments.
Program costs used in the calculation of cost per student included non-cash items, leave and superannuation
liabilities assumed by the Crown Entity.
This is trial version
www.adultpdf.com
Department of Education and Training ______________________________________________________________
20 ___________________________________________Auditor-General’s Report to Parliament 2008 Volume Four
Cost of Funding Non-Government School Education by the Department
In 2007–08, the New South Wales Government provided funding to 936 non-government schools
(929 in 2006-07). Funding is mainly in the form of a per capita allowance and an interest subsidy
scheme. Under the Education Act 1990, schools must register to be eligible for State funding
assistance. Using departmental statistics of non-government school enrolments and relevant
program costs, some broad trends of funding per student were:
Year ended 30 June 2005 2006 2007 2008
Average enrolments(a):
Primary Students 184,598 185,642 186,005 186,537
Secondary Students
179,063 181,232 182,676 183,399
Total
363,661 366,874 368,681 369,936
Program costs(b):
Primary $m
268.7 286.5 303.0 322.6
Secondary $m 363.0 372.2 390.4 407.9
Total $m
631.7 658.7 693.4 730.5
Funding per student:
Primary $ 1,455 1,543 1,629 1,729
Secondary $
2,027 2,054 2,137 2,224
Average $ 1,737 1,795 1,881 1,975
(a) Average enrolments represent those non-government enrolments that qualified and received State recurrent funding.
This does not include full fee paying overseas students.
(b) Program costs used in calculating cost per student included per capita grants, interest rate subsidies.
Average enrolments increased by 1.7 per cent over the last four years and the costs of funding
per student increased by 13.7 per cent during the same period.
DEPARTMENT ACTIVITIES
The Department coordinates the delivery of education and training services in New South Wales
from pre-school to tertiary. It is responsible for providing school education, vocational education
and training and has certain regulatory and service responsibilities to private schools, private
providers of education and training and universities.
For further information regarding the activities of the Department, refer to www.det.nsw.edu.au
.
CONTROLLED ENTITIES
New South Wales Technical and Further Education Commission (TAFE NSW)
Separate comments on TAFE NSW and its controlled entities TAFE NSW Commission Division and
A.C.N. 093 230 374 Pty Limited (formerly TAFE Global Pty Ltd) are included elsewhere in this
Report.
This is trial version
www.adultpdf.com
______________________________________________________________ Department of Education and Training
Auditor-General’s Report to Parliament 2008 Volume Four __________________________________________ 21
NSW Adult Migrant English Service (AMES)
AMES provides English language learning opportunities for adult migrants and job seekers. The
Commonwealth Government primarily funds AMES.
For further information on the Service, refer to
www.ames.edu.au.
FINANCIAL INFORMATION
Year ended 30 June 2008 2007
$’000 $’000
Revenue 44,600 40,290
Employee related expenses 16,674 14,843
Other expenses 22,328 18,991
Surplus 5,598 6,456
Net assets (at 30 June) 22,475 16,877
Fees for services rendered increased by $3.6 million as a result of increased demand for AMES
services.
This is trial version
www.adultpdf.com
22 ___________________________________________Auditor-General’s Report to Parliament 2008 Volume Four
New South Wales Technical and Further
Education Commission
AUDIT OPINION
The audits of the Commission and its controlled entities’ financial reports for the year ended
30 June 2008 resulted in unqualified Independent Auditor’s Reports, except for A.C.N. 093 230 374
Pty Limited (formerly TAFE Global Pty Ltd) (refer to controlled entities comments on page 27).
Unless otherwise stated, the following commentary relates to the parent entity.
PERFORMANCE INFORMATION
Size and Scope of the Commission in New South Wales
The Commission is the largest vocational education and training (VET) provider in Australia.
Year ended 30 June 2005 2006 2007 2005-2007
Change %
Total enrolments 513,070 500,410 497,747 (3.0)
Annual student hours (ASH) (’000) 107,932 108,785 108,509 0.5
Net cost of services * ($’000) 1,158,463 1,212,107 1,204,231 4.0
ASH per enrolment 210 217 218 3.8
Net cost of services per enrolment ($)
2,258 2,422 2,419 7.1
Net cost of services per ASH ($) 10.73 11.14 11.10 3.4
* Net cost of services is for the financial year ended 30 June whereas enrolments and student hours are for the
calendar year.
Enrolments for 2007 of 497,747 were at their lowest level for three years while annual student
hours of 109 million and net cost of services per enrolment were at similar levels to that of 2006.
The Commission has advised us that this trend reflects a change in the student profile, with an
increasing number of students undertaking higher level qualifications and full time study.
In 2008, the Commission applied a nine per cent increase in TAFE NSW fees and introduced a
$50 concession fee for some recipients of a Commonwealth benefit or allowance who, in previous
years, were exempted from the payment of fees.
Although enrolments and student hours for 2008 are not available until mid 2009, year to date
statistics provided by the Commission indicate an increase in enrolment numbers, while fee
exemptions and concessions in 2008 are at a similar level to fee exemptions in 2007.
The Commission has advised that a major cause of the overall enrolment increase was from a new
contract with the Commonwealth Department of Health and Ageing under which funding is received
to provide community service courses.
This is trial version
www.adultpdf.com
_________________________________________ New South Wales Technical and Further Education Commission
Auditor-General’s Report to Parliament 2008 Volume Four __________________________________________ 23
New South Wales VET Cost per Student Hour
Government expenditure per student hour has decreased by 12.1 per cent since 2003.
Year ended 30 June 2003 2004 2005 2006 2007
Government recurrent
expenditure* ($m) 1,413 1,392 1,375 1,370 1,343
Student hours (m) 101.0 97.9 106.7 105.8 109.6
Expenditure per student hour
($/hour)
14.0 14.2 12.9 12.9 12.3
Change in expenditure per
student hour since 2003 (%)
1.4 (7.8) (7.8) (12.1)
Source: National Centre for Vocational Education Research, 2003-07 Australian vocational education and training
statistics – financial information. Unpublished data from NCVER. The costs noted in the table above have been
adjusted to 2007 dollars to exclude the effect of inflation.
* Government Recurrent Expenditure is made up of:
- TAFE NSW (approx 83 per cent of total), VET programs within NSW DET, agricultural colleges and
- NSW Adult Migrant English Service.
OTHER INFORMATION
No major control issues were identified. We identified some minor opportunities for the
Commission to improve internal controls and we have reported these to management.
Maintenance Backlog
TAFE NSW Institutes are given an overall budget by the Commission. The Institutes determine a
maintenance budget based on service priorities. In accordance with the government’s policy of
total asset management, the Commission is developing a new methodology for future condition
assessments. This uses new software to identify and prioritise maintenance works by matching data
collected with maintenance work programs. It is anticipated that the new condition assessments
will be completed by the end of 2008. At 30 June 2008, maintenance backlog totalled $27.7 million
($25.6 million in 2006-07). This backlog should be considered in the context of the estimated
replacement value of TAFE NSW buildings of $4.0 billion.
Workers’ Compensation Claims
Year Ended 30 June 2006* 2007* 2008
Number of claims incurring cost 636 639 699
Number of incidents reported – claims and
notifications** 824 1,019 1,217
Number of stress claims incurring cost 73 82 101
Estimated cost for all workers compensation claims
($m) 8.9 8.5 9.1
Estimated cost for stress claims ($m) 2.9 2.2 3.6
Days lost - all injuries 16,579 14,269 6,993
Days lost - stress claims 6,566 4,263 2,707
* Figures for prior years include data accumulated to date. Therefore the total days lost and costs are higher for the
earlier years due to the passage of more time.
** Includes workers compensation claims incurring a cost and incidents reported as a notification only with a nil cost.
This is trial version
www.adultpdf.com
New South Wales Technical and Further Education Commission _________________________________________
24 ___________________________________________Auditor-General’s Report to Parliament 2008 Volume Four
In 2007-08, the Commission had 16,231 full time equivalent employees and there were 101 stress
claims made, 23.1 per cent more than in 2006-07. The average cost per stress claim in 2007-08 was
$35,947 ($27,138) compared to $13,015 ($13,297) for all types of injuries.
The Commission has advised that, while the number of all compensation claims incurring costs has
increased by 9.4 per cent since 2006-07, there has been a seven per cent reduction in the average
cost of the claims. This is mainly due to a reduction in the duration of average time lost, from 21 to
19 days. The Commission attributes these reductions to the successful implementation of programs
and initiatives under its safe working and learning strategy which targets improvements in return to
work and claims management outcomes.
Workers’ Compensation Premiums Benchmark
Year ended 30 June 2006 2007 2008 2009
Equivalent full time employees
(EFT)*** 16,271 16,037 16,231 16,231
Premium cost ($m) 18.0 18.2 16.8 16.2
Benchmark* ($m) 14.0 14.8 14.5 15.0
Excess** ($m) 4.0 3.4 2.3 1.2
* Benchmark paid by The Treasury.
** Excess paid by TAFE NSW.
*** EFT numbers as specified in the Commission’s Workers Compensation Declarations.
The insurer sets a benchmark for agencies that determines the level of The Treasury funding. If an
agency’s premiums exceed the benchmark, the agency needs to fund the excess. This is an
encouragement for agencies to actively manage their workers’ compensation costs and minimise
workplace injuries.
The Commission has completed the final year of implementation of programs and initiatives under
its ‘Safe Working and Learning’ strategy which was aimed at improving systems to provide greater
safety, and control the escalating costs of workers’ compensation premiums. The Commission has
advised that there has been a 70 per cent reduction in the short fall payable by the Commission
over the last four premium renewal periods as a result of improved claims management. This has
also led to a 3.5 per cent reduction in the deposit premium for the 2008-09 period.
Overtime
Overtime costs increased only marginally (0.3 per cent) in 2007-08.
Year ended 30 June 2005 2006 2007 2008
Overtime ($m) 25.2 27.3 29.3 29.4
Salaries ($m) 860.6 951.3 987.1 1,002.1
Overtime as % of salary
2.9 2.9 3.0 3.0
This is trial version
www.adultpdf.com
_________________________________________ New South Wales Technical and Further Education Commission
Auditor-General’s Report to Parliament 2008 Volume Four __________________________________________ 25
As shown in the table below, 156 (152) non-teaching TAFE NSW employees earn 20 per cent or more
of their gross salary in overtime.
Overtime to Base Salary % Number of Non-Teaching Employees
2007 2008
70 – 100 1
60 – 70 2
50 – 60 5 5
40 – 50 18 18
30 – 40 47 45
20 – 30 80 87
10 – 20 178 169
0> - 10 1,865 1,854
Nil 3,405 3,461
Total 5,600 5,640
For six employees overtime was more than 50 per cent of their base salary compared to seven in
the prior year. Overtime worked by non-teaching staff is paid at penalty rates, which is a relatively
expensive way of obtaining more resources.
Employee Annual
Overtime
$
Base
Salary
$
Annual
Gross
$
Overtime to
Base Salary
%
Employee 1 28,491 38,143 66,634 74.7
Employee 2 22,426 38,143 60,569 58.8
Employee 3 23,681 40,689 64,370 58.2
Employee 4 21,684 38,143 58,827 56.9
Employee 5 19,834 37,756 57,590 52.5
Employee 6 19,948 38,143 58,091 52.3
The Commission has previously advised that high levels of overtime may be paid because:
the cost of some overtime has been built into the budget for commercial activities
of industrial action and other circumstances beyond the control of the Commission
TAFE NSW operating hours are from 6.00am to 10.00pm, Monday to Saturday, therefore some
overtime is unavoidable.
This is trial version
www.adultpdf.com
New South Wales Technical and Further Education Commission _________________________________________
26 ___________________________________________Auditor-General’s Report to Parliament 2008 Volume Four
FINANCIAL INFORMATION
Abridged Consolidated Operating Statement
Year ended 30 June Consolidated Parent
2008 2007 2008 2007
$’000 $’000 $’000 $’000
Employee related 901,141 872,456
Personnel services 330,845 314,409 1,188,636 1,142,159
Other operating expenses 303,384 303,327 303,384 301,503
Depreciation and amortisation 75,675 94,626 75,675 94,611
TOTAL EXPENSES 1,611,045 1,584,818 1,567,695 1,538,273
TOTAL REVENUE 380,560 341,304 380,556 337,646
Other losses 1,706 3,642 1,706 3,604
NET COST OF SERVICES 1,232,191 1,247,156 1,188,845 1,204,231
Government contributions 1,244,084 1,238,535 1,200,734 1,195,599
SURPLUS/(DEFICIT) FOR THE YEAR 11,893 (8,621) 11,889 (8,632)
The increase in revenue followed a nine per cent increase in TAFE NSW fees and a new major
contract with the Commonwealth referred to previously.
The fall in depreciation expense largely relates to longer lives assigned to the Commission’s
buildings following the 2007 revaluation.
Abridged Consolidated Balance Sheet
At 30 June Consolidated Parent
2008 2007 2008 2007
$’000 $’000 $’000 $’000
Current assets 166,353 151,223 166,111 150,563
Non-current assets 2,978,932 2,962,650 2,978,932 2,962,984
TOTAL ASSETS 3,145,285 3,113,873 3,145,043 3,113,547
Current liabilities 180,210 160,761 180,943 161,336
Non-current liabilities 687 687
TOTAL LIABILITIES 180,897 161,448 180,943 161,336
NET ASSETS 2,964,388 2,952,425 2,964,100 2,952,211
This is trial version
www.adultpdf.com