AUDITOR-GENERAL’S REPORT FINANCIAL AUDITS Volume Nine 2009_part2 doc
Bạn đang xem bản rút gọn của tài liệu. Xem và tải ngay bản đầy đủ của tài liệu tại đây (148.21 KB, 11 trang )
This is trial version
www.adultpdf.com
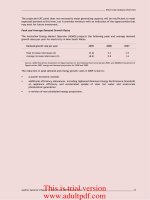
Auditor-General’s Report to Parliament 2009 Volume Nine ___________________________________________ 7
Department of Education and Training
AUDIT OPINION
The audits of the Department and its controlled entities’ financial reports for the year ended
30 June 2009 resulted in unqualified Independent Auditor’s Reports.
Unless otherwise stated, the following commentary relates to the parent entity.
PERFORMANCE INFORMATION
The New South Wales State Plan provides the overall direction for improvements in performance
and significantly influenced the Department’s priorities for 2009. Its priorities included:
increasing levels of attainment for all students, including increasing the percentage of
students exceeding the national benchmarks in reading and numeracy
more students completing Year 12 or recognised vocational training
closing the performance gap between Aboriginal students and all students, at schools and at
the New South Wales Technical and Further Education Commission (TAFE NSW)
increasing the proportion of population aged 15-64 participating in vocational education and
training.
The Department measures whether it is achieving its priority outcomes by using performance
indicators, such as:
literacy and numeracy
year 12 retention rates
achievement gap for Aboriginal students
government school enrolments.
Literacy and Numeracy
Prior to 2008, the various states and territories had different ways of assessing student progress in
literacy and numeracy. All Australian schools now use the National Assessment Program – Literacy
and Numeracy (NAPLAN) to assess the literacy and numeracy learning of students at Years 3, 5, 7
and 9. Students participate in NAPLAN tests in May of each year and 2009 is the second year of
testing.
This is trial version
www.adultpdf.com
Department of Education and Training ______________________________________________________________
8 ____________________________________________ Auditor-General’s Report to Parliament 2009 Volume Nine
The table below details the 2009 NAPLAN summary results of the percentage of students at or
above the national minimum standard:
NSW National
Years Trend
2009
%
2008
%
2009
Ranking
2009
%
2008
%
Reading
Year 3
95.6 95.1 1 93.8 92.1
Year 5
93.6 93.5 3 91.7 91.0
Year 7
94.8 95.4 3 93.9 94.2
Year 9
93.5 94.4 3 92.2 92.9
Writing
Year 3
97.1 97.5 1 95.6 95.4
Year 5
94.9 95.1 1 92.8 92.6
Year 7
93.7 93.5 1 92.5 91.8
Year 9
89.0 88.9 3 87.7 87.2
Spelling
Year 3
94.9 96.1 1 92.2 92.5
Year 5
94.6 94.5 1 92.4 91.7
Year 7
94.6 94.2 1 92.9 92.5
Year 9
91.6 92.2 1 89.7 89.8
Punctuation and Grammar
Year 3
94.9 95.2
2 92.5 91.7
Year 5
93.7 93.9 3 92.0 91.9
Year 7
92.5 93.4 3 92.0 91.6
Year 9
91.0 91.4 3 90.3 89.9
Numeracy
Year 3
95.6 96.9 1 94.0 95.0
Year 5
95.5 94.4 2 94.2 92.7
Year 7
95.1 96.0 3 94.8 95.4
Year 9
95.4 94.7 2 94.9 93.6
Source: Ministerial Council for Education, Early Childhood Develop and Youth Affairs (MCEECDYA) – National Assessment
Program – Literacy and Numeracy Summary Report 2009 (unaudited).
Notes:
Key: Trending upwards, Trending downwards, ~ No trend
The rankings range from one to eight (highest to lowest).
The results of the 2009 national tests indicate that New South Wales students:
performed consistently better than the national average
performed better in the early years than in the later years in most domains
had fewer performing below the national minimum standard.
This is trial version
www.adultpdf.com
______________________________________________________________ Department of Education and Training
Auditor-General’s Report to Parliament 2009 Volume Nine ___________________________________________ 9
The Department advised us that it spent $174 million ($116 million in 2007-08) on the literacy and
numeracy plan in 2008-09 and an additional $968 million will be spent over the next four years to
further improve student literacy and numeracy levels.
Retention Rates from Years 7 to 12 for Government Schools
Year ended 31 December 2008 2007 2006 2005 2004
%
%
%
% %
All students 64.6 64.5 65.1 65.8 65.8
Aboriginal students 32.2 30.9 28.7 29.4 29.9
Students from language backgrounds
other than English 106.0 101.8 105.4 109.5 108.2
Students from low socio-economic
status backgrounds 54.5 53.2 52.9 55.5 56.4
Geographically isolated students 41.1 48.6 41.3 45.6 43.7
Source: DET Statistical Compendium 2008 (unaudited).
Notes:
Retention rates are ‘apparent’ as they do not track individual students through their secondary schooling.
Retention rates for students from low socio-economic status backgrounds and geographically isolated students for
2002 to 2007 and for 2008 are based on participating schools in 2007 and 2008 respectively.
Year 12 retention rates can exceed more than 100 per cent due to a number of factors including migration of
students from interstate and overseas
Care should be exercised in interpreting changes in apparent retention rates for Aboriginal students and students
from geographically isolated areas due to the small numbers involved.
Over the past five years the retention rates from Years 7 to 12 have remained relatively stable with
only minor fluctuations from year to year, retention rate for geographically isolated students are at
a five year low. In 2008 the Department continued a range of strategies designed to encourage
more students to complete Year 12. It expects that the initiatives will start to impact positively on
retention rates in 2012 when the 2007 Year 7 students are due to reach Year 12.
Retention Rates of Full-time Students for Government Schools by State (2004-2008) for Years
7/8 to 12
Years
NSW
%
Vic
%
Qld
%
SA
%
WA
%
Tas
%
NT
%
ACT
%
National
%
2008 64.6 71.9 70.3 64.7 68.2 61.3 67.6 95.9 68.3
2007 64.5 73.9 71.1 64.0 63.1 63.3 69.4 96.6 68.3
2006 65.1 72.6 71.6 61.9 65.1 63.2 72.3 103.2 68.5
2005 65.8 74.0 73.0 61.7 65.4 65.5 70.5 99.6 69.4
2004 65.8 74.4 75.3 58.0 65.9 76.0 72.0 100.5 69.9
Source: DET Statistical Compendium 2008 (unaudited).
Notes:
Retention rates are ‘apparent’ as they do not track individual students through their secondary schooling.
Care should be exercised in the interpretation of apparent retention rates as the method of calculation does not
take into account a range of factors including:
Differing enrolment policies across jurisdictions (which contribute to different age-grade structures)
Students enrolled in Year 12 on a part-time basis or repeating a year
Movements of students between States and between school sectors
Impact of full-fee paying overseas students
Varying enrolment patterns in which students choose to complete their secondary schooling at TAFE NSW.
Apparent retention rates can exceed more than 100 per cent due to a number of factors including migration of
students from interstate and overseas.
This is trial version
www.adultpdf.com
Department of Education and Training ______________________________________________________________
10 ___________________________________________ Auditor-General’s Report to Parliament 2009 Volume Nine
Although retention rates in New South Wales remained stable in 2008, they fell below the national
average. The State’s ranking relative to other States and Territories fell from fifth to seventh.
Full-time Participation Rates for 15 to 24 Year Olds
Years 2008
%
2007
%
2006
%
2005
%
2004
%
NSW 83.4 82.4 81.8 82.3 82.3
National 83.9 83.6 82.8 82.2 81.7
Source: Australian Bureau of Statistics, Survey of Education and Work, 2004-2008 (unaudited).
Notes: Full-time participation is defined as participation in full-time education or training or full-time work, or a
combination of both part-time education or training and part-time work.
The Survey of Education and Work estimates the proportion of 15 to 24 year olds participating in
full-time education or training, full-time work, or a combination of part-time education or training
and part-time work. Overall, New South Wales ranked fourth relative to other States and
Territories. However, when the level of uncertainty associated with these estimates is taken into
account, it is likely that only the Australian Capital Territory had a statistically significant higher
rate of full-time participation than New South Wales.
The Department has implemented a number of measures to increase participation by youth at risk
to ensure they have access to education that leads to workforce participation. Under the Learn or
Earn initiative, 12,580 new vocational education and training places will be created between 2007
and 2010 in school and TAFE NSW based trade schools. These places will ensure young people up to
the age of 18, who do not complete Year 12 and have not yet got a job, will have a guaranteed
training place at TAFE NSW. The employment of 400 new apprentices every year over the next four
years by New South Wales Government agencies and utilities will also increase participation for
those in the 15 to 19 age group.
The Achievement Gap for Aboriginal Students
Reading and numeracy targets set under the New South Wales State Plan for Aboriginal students are
to halve the gaps in minimum and proficient standards that existed in 2008 between Aboriginal
students and all students by 2020.
This is trial version
www.adultpdf.com
______________________________________________________________ Department of Education and Training
Auditor-General’s Report to Parliament 2009 Volume Nine __________________________________________ 11
The table below details the 2008 NAPLAN Summary Results of the percentage of Aboriginal students
against all student peers at or above the national minimum standard and the achievement gap
between them:
All students Aboriginal students
Achievement
Years
NSW
2008
%
NSW
Ranking
National
2008
%
NSW
2008
%
NSW
Ranking
National
2008
%
Gap
%
Reading
Year 3 95.1 2 92.1 83.5 4 68.3 11.6
Year 5 93.5 3 91.0 77.6 4 63.4 15.9
Year 7 95.4 3 94.2 82.4 4 71.9 13.0
Year 9 94.4 3 92.9 82.3 3 70.7 12.1
Writing
Year 3 97.5 1 95.4 90.9 3 78.8 6.6
Year 5 95.1 1 92.5 81.7 4 69.7 13.4
Year 7 93.5 1 91.8 76.9 4 67.9 16.6
Year 9 88.9 2 87.2 67.7 4 59.7 21.2
Spelling
Year 3 96.1 1 92.5 86.1 2 69.2 10.0
Year 5 94.5 1 91.7 82.1 3 69.7 12.4
Year 7 94.2 2 92.5 82.0 3 71.8 12.2
Year 9 92.2 2 89.8 78.4 3 67.8 13.8
Punctuation and
Grammar
Year 3 95.2 2 91.7 82.2 3 65.3 13.0
Year 5 93.9 3 91.9 77.6 4 64.1 16.3
Year 7 93.4 3 91.6 75.0 4 62.7 18.4
Year 9 91.4 3 89.9 71.2 3 60.7 20.2
Numeracy
Year 3 96.9 1 95.0 88.6 3 78.6 8.3
Year 5 94.4 3 92.7 78.9 4 69.2 15.5
Year 7 96.0 3 95.4 84.5 4 78.6 11.5
Year 9 94.7 3 93.6 80.3 3 72.5 14.4
Source: DET Statistical Compendium 2008 (Sourced from Ministerial Council on Education, Employment, Training and
Youth Affairs (MCEETYA) – 2008 National Assessment Program: Literacy and Numeracy Achievement in Reading,
Writing and Numeracy) (unaudited).
Notes:
At the time of preparing this Report the 2009 NAPLAN results by indigenous status are not available on the MCEETYA
website
The rankings range from one to eight (highest to lowest).
The results of the 2008 national tests for New South Wales Aboriginal students indicated that:
they performed consistently better than the national average for Aboriginal students
the comparison against all students show significant gaps
the gaps against all students is less in the early years than in the later years.
This is trial version
www.adultpdf.com
Department of Education and Training ______________________________________________________________
12 ___________________________________________ Auditor-General’s Report to Parliament 2009 Volume Nine
The Department has allocated funding of $65.0 million over four years to improve the academic
achievements of Aboriginal students, by designing specialised teaching programs in order to reduce
the gap. The Department advised us that of the $10.7 million allocated in 2008-09 ($13.0 million in
2007-08), $8.4 million was spent ($9.5 million).
Government Schools
New South Wales’ expenditure per student was lower than the national average for both primary
and secondary schools in 2007-08.
At 30 June NSW
2007-08
NSW
2006-07
National
2007-08
NSW Ranking
amongst all
States and
Territories (d)
NSW Ranking
Previous
Year (d)
Recurrent Expenditure ($) per
student on Government
Schools (a)
Primary
11,148 10,643 11,557 7 7
Secondary
13,977 13,329 14,306 4 4
Overall 12,324 11,756 12,639 7 7
Student to Teaching Staff
Ratios – Government
Schools (b)
Primary
15.9 16.2 15.6 1 1
Secondary
12.4 12.5 12.3 5 4
Overall 14.3 14.4 14.1 2 2
Full–Time Student Enrolment –
Government Schools as a
percentage of all schools (c)
Primary
69.6 69.8 69.7 5 5
Secondary 62.0 62.4 60.8 4 4
Overall
66.3 66.5 65.9 4 5
(a) Source: Ministerial Council on Education, Employment, Training and Youth Affairs – National Report on Schooling in
Australia, 2008. Incorporates both salaries and non-salary costs. Includes actual or notional payroll tax and notional
eight per cent user cost of capital (unaudited).
(b) Source: Australian Bureau of Statistics, Schools Australia 2008 (Table 23).
(c) Source: Australian Bureau of Statistics, Schools Australia 2008 (Table 7).
(d) The rankings range from one to eight (highest to lowest).
Note: Care should be taken when comparing different jurisdictions as areas of non-comparability continue to exist e.g.
there can be large differences between city and country staff ratios within different jurisdictions.
Student to teacher ratios for New South Wales were marginally higher than the national average.
The overall ratio of 14.3 was higher than the New South Wales private sector ratio of 13.7 students
per teacher.
This is trial version
www.adultpdf.com
______________________________________________________________ Department of Education and Training
Auditor-General’s Report to Parliament 2009 Volume Nine __________________________________________ 13
The proportion of all students enrolling in government schools has been declining for the past
ten years. The most significant decline has been in secondary schools, falling from 66.9 per cent in
1998 to 62 per cent in 2008. The movement of students between sectors now seems to be
stabilising. The chart below illustrates the decline over the last decade.
56
58
60
62
64
66
68
70
72
74
76
1998 1999 2000 2001 2002 2003 2004 2005 2006 2007 2008
%
Year
NSW Government School-Proportion of Full Time Enrolments
Primary Secondary Total
Source: Australian Bureau of Statistics, Schools Australia 2008 (Table 7) (unaudited).
Workers’ Compensation Claims
2009 2008 2007
Workers’ compensation premium (S’000) 116,152 123,866 128,679
Total number of claims incurring cost 5,698 6,048 6,008
Number of working days lost 34,304 43,231 43,721
Number of stress claims incurring cost 725 829 949
Number of working days lost due to stress claims 9,234 16,733 19,816
Source: DET Statistics (unaudited).
Workers compensation claims incurring cost reported by the Department reduced by 5.8 per cent in
2008-09. As a result of improved performance workers’ compensation premiums have decreased.
A number of targeted programs and initiatives have been implemented under the Departments
‘Safe Working and Learning’ strategy to improve both claims and injury management outcomes.
These initiatives have had success, with the total number of days lost due to workplace injury
decreasing by 8,927 days (20.6 per cent) in 2008-09 when compared to 2007-08.
Further reductions are anticipated in the frequency, severity and cost of workers’ compensation
claims with the continued roll out of programs under the Department’s safety strategy.
This is trial version
www.adultpdf.com
Department of Education and Training ______________________________________________________________
14 ___________________________________________ Auditor-General’s Report to Parliament 2009 Volume Nine
OTHER INFORMATION
Department
We identified some opportunities for improvement to the Department’s accounting and internal
control procedures, mainly in the areas of property, plant and equipment recording and payroll.
These have been reported to management.
Schools
For the school financial year ended 30 November 2008, we audited financial transactions at
62 primary schools and 10 high schools.
We identified opportunities for schools to improve their internal controls and general compliance
with Departmental guidelines, which we reported to school Principals. Many of our findings were
similar to those of the previous year. The Department has advised that they communicate common
findings to all schools and direct them to take corrective action.
Connected Classrooms Program (CCP)
The CCP consists of three components with a total investment of $158 million over four years.
The Interactive Classroom Project (ICP) will equip every New South Wales public school
with an interactive whiteboard, data projector, control computer, network device and
video conferencing components.
The Learning Tools Project will upgrade student email, individual online working space for
all students and teachers and online access to student reports for parents.
The Network Bandwidth Enhancement Project, for network upgrades, will increase
bandwidth speed and secure browsing and content filtering to better enable interactive
learning environments.
Year ended 30 June Total 2009 Total
Budget
Over
4 Years
Actual Costs to
Date
$’000
$’000 $’000
Interactive Classrooms Project 65,297 28,477 34,523
Learning Tools Project
28,904 9,142 11,366
Network Bandwidth Enhancement Project
63,686 17,036 25,954
Total 157,887 54,655 71,843
Source: DET Statistics (unaudited).
At 30 June 2009, the Department had installed 1,003 (200 in 2007-08) Interactive Classrooms and
upgraded 1,628 schools sites with bandwidth. The student email service has been upgraded and 1.2
million students across New South Wales public schools now have access to an improved email
service, Google’s G-mail.
Digital Education Revolution (DER)
The DER program is funded through the Commonwealth Government’s National Secondary School
Computer Fund to provide all secondary students with a 1:1 computer ratio by December 2011. The
funding agreements to date amount to $264 million with further funding of $179 million to be made
available over five years.
This is trial version
www.adultpdf.com
______________________________________________________________ Department of Education and Training
Auditor-General’s Report to Parliament 2009 Volume Nine __________________________________________ 15
The Department aims to achieve this ratio by providing a wireless enabled laptop computer to all
Years 9 to 12 students for their individual use.
Contracts awarded to date include:
$150 million to supply approximately 220,000 student laptops
$70.0 million for wireless network access, and
on-costs of $189 million to cover agreed additional expenditure. The on-costs agreement
includes funding for wireless connectivity, professional learning and curriculum support and
the employment of over 400 Technology Support Officers, mostly school based.
Total expenditure on the DER program to 30 June 2009 was $11.9 million. The delivery of student
laptops commenced in August 2009.
Building Education Revolution (BER)
The BER is a $16.2 billion investment by the Commonwealth Government to improve the quality of
facilities in Australian schools and generate jobs in the construction industry.
State Government
Schools
Funding
$m
Non-
Government
Schools
Funding
$m
Total BER
Funding
$m
Total BER
Funding
%
NSW 3,475 1,579 5,054 31.2
Vic 2,583 1,247 3,830 23.7
Qld 2,141 961 3,102 19.2
WA 1,277 551 1,828 11.3
SA 959 433 1,392 8.6
Tas 332 114 446 2.8
ACT 153 93 246 1.5
NT 208 65 273 1.7
Total 11,128 5,043 16,171 100.0
Source: DET Statistics (unaudited).
The BER comprises three programs, which include projects to be completed by 2011.
Program – Year ended 30 June Funding
2009
$m
Funding
2010
$m
Funding
2011
$m
Total
Funding
$m
Primary Schools for the 21
st
Century
98.4 1,647.5 1,283.9 3,029.8
National School Pride 88.4 203.4 291.8
Science and Language Centres
for 21
st
Century Secondary
Schools 153.1 153.1
Total 186.8 2,004.0 1,283.9 3,474.7
Source: DET Statistics (unaudited).
This is trial version
www.adultpdf.com
Department of Education and Training ______________________________________________________________
16 ___________________________________________ Auditor-General’s Report to Parliament 2009 Volume Nine
Primary Schools for the 21
st
Century
This program is to build or upgrade large scale infrastructure such as libraries, halls and classrooms
in public primary schools in New South Wales.
The breakdown of approved funding and payments to 30 June 2009 by region is detailed below:
Region Number of Schools Approved Project
Funding
$’000
Payments to
30 June 2009
$’000
Hunter/Central Coast 242 436,554 2,613
Illawarra & South East 188 300,014 2,776
New England 106 99,337 7,210
North Coast 233 283,515 23,725
Northern Sydney 127 307,346 1,789
Riverina 162 173,074 1,457
South Western Sydney 206 453,753 2,148
Sydney 172 357,004 764
Western NSW 162 177,007 1,526
Western Sydney 186 395,746 2,309
Total 1,782 2,983,350 46,317
Source: DET Statistics (unaudited).
A managing contractor has been allocated to each region to ensure the timely and professional
delivery of projects within the BER guidelines. All managing contractors were appointed following a
competitive tender.
National School Pride
This program is providing funding of up to $200,000 for primary, secondary and central schools to
refurbish and renew existing infrastructure and undertake minor building works. Over $287 million
will be spent on around 2,180 public schools. The projects under this program must be completed
by 1 February 2010.
Science and Language Centres for 21
st
Century Secondary Schools
This program provides funding to build new or refurbished science laboratories and language
learning centres in secondary schools across New South Wales. It is estimated that around
$151 million will be spent on 118 projects in New South Wales. The completion date for these
projects is 30 June 2010.
Governance
The volume of projects and the tight timeframes create risks in ensuring value for money is
received from funds expended. These risks were recognised by the Government, which has set up
the following governance arrangements:
a New South Wales Nation Building and Jobs Plan Taskforce has been established to plan and
oversee the Nation Building program and advise offices in education and housing. The
taskforce reports directly to the Premier and coordinates the reporting of the delivery of the
BER program to the Commonwealth. A probity plan was established by the taskforce to
ensure the probity risks associated with the delivery requirements are appropriately managed
and monitored. A probity auditor has been appointed to the taskforce.
This is trial version
www.adultpdf.com