A Component Unit of the State of Montana Consolidated Statements of Net Assets_part2 pot
Bạn đang xem bản rút gọn của tài liệu. Xem và tải ngay bản đầy đủ của tài liệu tại đây (346.17 KB, 10 trang )
THE UNIVERSITY OF MONTANA
THE UNIVERSITY OF MONTANA - MISSOULA
THE UNIVERSITY OF MONTANA - WESTERN
THE UNIVERSITY OF MONTANA - HELENA COLLEGE OF TECHNOLOGY
MONTANA TECH OF THE UNIVERSITY OF MONTANA
MANAGEMENT’S DISCUSSION AND ANALYSIS
FISCAL YEAR ENDED JUNE 30, 2008
OVERVIEW
The University of Montana (University) is comprised of four campuses: The University of Montana -
Missoula; The University of Montana - Western; The University of Montana - Helena College of
Technology; and Montana Tech of The University of Montana. This discussion addresses the
consolidated financial statements for the four campuses, and included are three basic statements: the
Statement of Net Assets; the Statement of Revenues, Expenses, and Changes in Net Assets; and the
Statement of Cash Flows.
The discussion and analysis which follows provides a comparative overview of the University’s
financial position and operating results for the fiscal years ended June 30, 2008, 2007, and 2006 and
should be read in conjunction with the fiscal year 2008 financial statements.
FINANCIAL HIGHLIGHTS
The financial highlights for fiscal year 2008 were
:
¾ In accordance with the College Affordability Plan (CAP), announced by the Governor in
September of 2006, and approved by the 2007 Session of the Montana Legislature, tuition
was held at levels in effect for 2007 for all the Campuses of The University of Montana for
in-state students.
¾ Investment earnings decreased by $5.3 million as compared to the prior year. The decrease
can be attributed to the following factors: 1) The fair value of endowed equity investments
decreased by $2.3 million, 2) the yield on investments declined due to lower interest rates in
the market place, and 3) about $12 million from bond proceeds was utilized in new
construction.
¾ Long term obligations and advances from primary government decreased by $5.4 million.
The University issued new long-term debt totaling $343,000.
¾ Net assets of The University increased by $10.8 million as a primary result of capital grants
& gifts related to the addition of new facilities construction.
The financial highlights for fiscal year 2007 were
:
¾ Tuition rate increases for the year ended June 30, 2007 were 7% for the Western campus 8%
for the Missoula campus, 10% for the Montana Tech campus, and 4% for all of our Colleges
of Technology. The total tuition revenue increase for all four campuses, net of scholarship
allowances, for the 2007 fiscal year was nearly $8.0 million.
A-3
This is trial version
www.adultpdf.com
¾ Investment earnings increased by $2.8 million over the prior year. The significant increase
can be attributed primarily to a $1.7 million increase in fair value of pooled equity
investments. Higher federal funds rates achieved in the prior years were sustained through
FY 07, which helped ensure that earnings on interest bearing investments would stay at the
same level as in the prior year or increase. An additional factor contributing to the increase in
investment earnings was the continued investment of approximately $16.6 million of Series J
bond proceeds, which were held in various interest bearing investments during the year.
¾ Long term obligations and advances from primary government decreased by $6.6 million.
Significantly, no additional long term debt was issued by the University in FY 07.
¾ Net assets of the University increased by $24.1 million attributed primarily to capital grants
and gifts of $5.6 million related to the Donaldson Building addition on the Helena campus
and an increase in investment earnings.
¾ Considerable attention was given during FY 04 to a deficit experienced by the UM Athletics
Department at the Missoula campus. A plan was put in place to eliminate the accumulated
deficit in the Athletics Department within five years. During FY 07, Athletics continued to
exceed the targets established by the plan and eliminated the $192,626 deficit remaining at
June 30, 2006, two years earlier than planned.
USING THE FINANCIAL STATEMENTS
The University’s financial statements consist of the following three statements: Statement of Net
Assets, Statement of Revenues, Expenses and Changes in Net Assets, and Statement of Cash Flows.
A discussion of each of the individual statements follows. Some key points to be aware of regarding
the statements are:
¾ These are consolidated financial statements representing the University’s four campuses.
¾ The financial statements are prepared using the accrual basis of accounting, which means
revenues are reported when earned, and expenses are reported when incurred.
¾ Assets and liabilities presented in the financial statements are generally measured at current
value, although capital assets are stated at historical cost less accumulated depreciation.
¾ Capital assets are classified as depreciable and non-depreciable. Depreciation is treated as an
operating expense.
¾ Assets and liabilities are treated as current (Due within one year) or as non-current (Due in
more than one year), and are presented in the Statement of Net Assets in order of liquidity.
¾ Revenues and expenses are classified as operating or non-operating. “Operating” is defined
as resulting from transactions involving exchanges of goods or services for payment, and
directly related to supplying the basic service while “non-operating” is defined as resulting
from transactions not derived from the basic operation of the enterprise. We show a
substantial operating loss on the Statement of Revenues, Expenses, and Changes in Net
Assets primarily because GASB requires that General Operating Fund expenses be reported
as operating, while the State Appropriation - which is General Operating Fund revenue - must
be reported as non-operating.
A-4
This is trial version
www.adultpdf.com
¾ Tuition and fees are reported net of any scholarships or fellowships that were applied directly
to a student’s account. The reason for “netting” these is to keep the University financial
statements from “double counting” this revenue and expense.
STATEMENT OF NET ASSETS
The Statement of Net Assets reflects the financial position of the University at the end of the fiscal year.
The changes in net assets that occur over time indicate improvements or deterioration in the
University’s financial position. A summary of the Statement of Net Assets follows:
For the years ended June 30,
(stated in millions)
2008 2007 2006
Description
Total current assets $ 79.78 $ 109.54 $ 106.40
Total non-current assets 349.31 301.75 283.88
Total assets
$ 429.09 $ 411.29 $ 390.28
Total current liabilities $ 51.80 $ 47.30 $ 44.49
Total non-current liabilities 172.10 169.59 175.54
Total liabilities
223.90 216.89 220.03
Invested in Capital Assets, Net of Related
Debt 153.83 134.28 119.58
Restricted:
Nonexpendable 19.29 21.07 17.83
Expendable 6.12 5.50 5.54
Unrestricted 25.95 33.55 27.30
Total net assets
205.19 194.40 170.25
Total liabilities and net assets
$ 429.09 $ 411.29 $ 390.28
Events or developments that occurred which had a significant impact on the Statement of Net Assets
included:
Events or developments which occurred during 2008:
¾ Current assets decreased by $29.8 million due primarily from additions to capital assets from
cash reserves of approximately $11.8 million plus, net investment of about $18 million in
longer-term investments.
¾ Non–Current assets increased by about $47.6 million due primarily to additions to capital
assets of $26 million net of an increase to accumulated depreciation of $16.7 million. An
increase in long-term investments of $18 million also contributed to the increase in non-
current assets. The remaining $3.6 million increase is a combination of various factors
including premium purchases on long-term investments, market fluctuations, and
reinvestment of interest earnings.
¾ Non-current liabilities increased primarily as a result of recording other post employment
benefits totaling $7.4 million as required by GASB 45, Accounting and Financial Reporting
by Employers for Postemployment Benefits Other Than Pensions.
A-5
This is trial version
www.adultpdf.com
¾ Net assets of the University increased by $10.8 million due primarily to the increase in the
investment in capital assets, net of the increase in non-current liabilties related to GASB 45.
Events or developments which occurred during 2007:
¾ Noncurrent assets increased by $17.9 million primarily from additions to capital assets of
$30.0 million net of an increase to accumulated depreciation of $15.8 million. A $1.7 million
increase in the fair value of long term investments also contributed to the increase in
noncurrent assets.
¾ Noncurrent liabilities decreased by $5.9 million due primarily to principal payments of $6.4
million on outstanding revenue bonds payable, notes payable and advances from primary
government. The University did not issue any additional long term debt during FY 07.
¾ Net assets increased by $24.1 million due in part to a $5.6 million of state funding related to
the Donaldson Building addition on the Helena campus. In addition, investments increased
by $3.6 million, which included a $1.6 million federal endowment.
STATEMENT OF REVENUES, EXPENSES, AND CHANGES IN NET ASSETS
The Statement of Revenues, Expenses, and Changes in Net Assets present the results of the
University’s operational activities for the fiscal year, categorizing them as either operating or non-
operating items. Consistent with the accrual method of accounting, the current year’s revenues and
expenses are recognized when they were earned or incurred, regardless of when cash was received or
paid.
A summary of the Statement of Revenues, Expenses and Changes in Net Assets follows:
For the years ended June 30,
(stated in millions)
2008 2007 2006*
Description
Operating revenues $ 251.08 $ 244.49 $ 230.15
Operating expenses 335.25 310.45 294.79
Operating loss (84.17) (65.96) (64.64)
Non-operating revenues (expenses) 83.92 80.21 76.91
Income before other revenues (.25) 14.25 12.27
Other revenues 11.04 9.90 4.09
Net increase in net assets 10.79 24.15 16.36
Net assets, beginning of year, as adjusted 194.40 170.25 153.89
Net assets, end of year $ 205.19 $ 194.40 $ 170.25
*Restated
A-6
This is trial version
www.adultpdf.com
The following provides a comparative analysis of revenues and expenses for the years ended June 30,
2008, 2007, and 2006:
For the years ended June 30,
(stated in millions)
2008
2007* 2006*
REVENUES Amount Percent Amount Percent Amount Percent
Tuition and fees, net $ 104.32 29.5% $ 99.15 29.0% $ 91.17 28.6%
Federal grants and contracts 64.62 18.3% 63.92 18.7% 64.65 20.3%
State & local grants/contracts 9.63 2.7% 9.20 2.7% 8.91 2.8%
Nongovernmental grants/contracts 8.16 2.3% 6.57 1.9% 4.99 1.6%
Facilities and administrative cost
allowances 10.60 3.0% 10.46 3.1% 9.79 3.1%
Sales/services of educational
departments 13.82 3.9% 14.14 4.1% 12.35 3.9%
Auxiliary enterprise charges 36.24 10.3% 34.33 10.0% 32.76 10.3%
State appropriations 73.53 20.8% 63.45 18.6% 62.07 19.5%
Investment income 2.69 0.8% 8.03 2.3% 5.18 1.6%
Private gifts 13.50 3.8% 14.66 4.3% 15.58 4.9%
Capital grants and gifts 10.82 3.1% 8.15 2.4% 3.06 0.9%
All other sources combined 5.51 1.5% 9.98 2.9% 8.01 2.5%
$ 353.44 100.0% $ 342.04 100.0% $ 318.52 100.0%
EXPENSES Amount Percent Amount Percent Amount Percent
Compensation and benefits $ 212.76 62.1% $ 201.17 63.3% $ 189.61 62.8%
Other postemployment benefits 7.35 2.1% - - - -
Other operating expenses 80.55 23.6% 76.08 23.9% 73.79 24.4%
Scholarships and fellowships 17.77 5.2% 16.36 5.2% 14.68 4.9%
Depreciation and amortization 16.81 4.9% 16.84 5.3% 16.71 5.5%
Interest expense 7.42 2.1% 7.44 2.3% 7.37 2.4%
$ 342.66 100.0% $ 317.89 100.0% $ 302.16 100.0%
* Restated
Comments about specific revenue and expense items are:
Events or developments which occurred during 2008 include:
¾ Tuition and fees increased approximately $3.2 million, with about $1.4 million due to higher
enrollments, and the remaining increase of about $1.8 million due to higher tuition rates for
out-of-state students.
¾ Grants and contracts from state, local and private funding sources, and facilities and
administrative cost allowances, increased by about $875 thousand. Funding for research
from federal sources continues to be difficult to obtain because of the federal governments’
war efforts. As a result, funding from this source increased only slightly by about $704
thousand in FY 08.
A-7
This is trial version
www.adultpdf.com
¾ Capital grants and gifts amounted to $10,817,000 during the year and were as follows:
Project Amount Campus
Upgrade Steam Distribution System $ 3,285,000 Missoula
Law School Expansion 2,242,000 Missoula
Donaldson Building 2,238,000 HCOT
Journalism Building 514,000 Missoula
HVAC Projects 1,362,000 Missoula
Cell Block Renovation 512,000 Missoula
Other Renewal and Replacement Projects 664,000 Various
Total $ 10,817,000
¾ Operating expenses increased by approximately $24.8 million due primarily to increases in
salaries and benefits, other post employment benefits, and utility and supply costs, of $11.6
million, $7.4 million, and $4.4 million, respectively. Salary increases in FY08 for classified
staff and faculty were 3.6 and 3.0%, respectively. Employer contributions for employee
benefits including health insurance, increased by approximately 8.3% over FY 07.
Events or developments which occurred during 2007 include:
¾ Tuition and fees increased by almost $8.0 million, with approximately $6.4 million of the
increase attributable to higher tuition rates, and the remainder to higher enrollments in FY 07.
¾ Grants and contract revenue from state, local and private funding sources, and facilities and
administrative cost allowances, increased by over $2.2 million. Funding for research from
federal sources continues to be difficult to obtain because of the federal government’s war
efforts. As a result, funding from this source declined by almost $734 thousand in FY 07.
¾ Sales and service revenue increased by almost $1.8 million over FY 06, with approximately
$1.0 million of the increase attributable to additional intercollegiate athletics event ticket
sales and game guarantees, and additional special event ticket sales. An increase in
educational department sales and service revenue accounts for most of the remaining
increase.
¾ Investment earnings increased by over $2.8 million due largely to a $1.7 million fair value
increase in pooled equity investments. The investment earnings were also positively impacted
by the investment of over $17.1 million of unexpended bond proceeds in various interest
bearing investments throughout the year, as well as continued higher yields on the State’s
Short Term Investment Pool (STIP). STIP rates averaged 4.25% in 2006 and 5.35% in 2007.
¾ Capital grants and gifts increased by approximately $5.1 million due primarily to $5.6 million
of State funding received for the Donaldson Building addition on the Helena campus.
¾ Operating expenses increased by approximately $15.7 million due primarily to increases in
salaries and benefits, and supplies and other services of approximately $11.6 million and $1.9
million, respectively. Salary increases in FY 07 for classified staff and faculty were 3.6% and
3.0%, respectively. Employer contributions for employee benefits including health
insurance, increased by approximately 10% over FY 06.
A-8
This is trial version
www.adultpdf.com
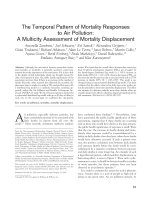
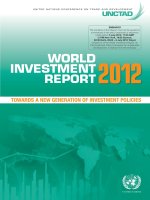
Tuition & Fees
$104.32
Grant & Contract
Activity $93.01
State
Appropriations
$73.53
Auxiliary Services
$36.24
Private Gifts $13.50
Sales & Services of
Educational
Departments
$13.82
All other sources
$5.51
Capital Grants &
Contracts
$10.82
Investment Income
$2.69
FY 2008
Revenues by Source = $353.44 Million
($ in Millions)
$7.37
$10.91
$14.68
$16.71
$19.88
$20.25
$20.49
$22.74
$33.50
$46.93
$88.70
$7.44
$11.92
$16.36
$16.84
$21.64
$22.05
$22.62
$24.41
$35.80
$47.92
$90.89
$7.42
$12.82
$17.77
$16.81
$26.56
$23.89
$27.16
$26.37
$38.78
$49.45
$95.63
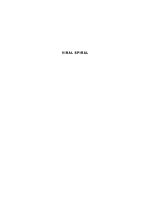
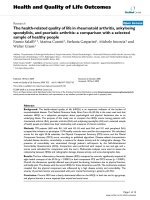
- 10 20 30 40 50 60 70 80 90 100 110
Interest
Public Service
Scholarships
Depreciation
Operat. & Maint. of
Plant
Student Services
Academic Support
Institutional Support
Auxiliary Enterprises
Research
Instruction
(Stated in Millions)
Expenses by Function/Purpose
2008
2007
2006
A-9
This is trial version
www.adultpdf.com
STATEMENT OF CASH FLOWS
The Statement of Cash Flows provides information about the University’s sources and uses of cash
during the fiscal year. This statement aids in assessing the University’s ability to meet obligations and
commitments as they become due, its ability to generate future cash flows, and its needs for external
financing. As required by GASB, the statement is presented using the “Direct Method”, which focuses
on those transactions that either provided or used cash during the fiscal year.
Specific events or cash transactions in FY 08 which were notable included:
¾ Cash flows from operating revenues increased by approximately $3.9 million over FY 07,
due primarily to an increase in cash flows from tuition and fees, and auxiliary enterprise
charges service activities totaling $4.4 million. This increase in cash flows was offset by an
increase in operating expenses of $11.0 million due largely to an increase in payments for
salaries and benefits of $8.4 million and $3.3 million for operating expenses.
¾ The University purchase $22.0 million of intermediate term investments and additional Trust
Fund Bond Pool shares in FY 08, accounting for most of the $24.2 million increase in cash
used in investing activities.
¾ Overall, $45.1 million in cash was used in capital and related financing activities, or an
increase of $8.7 million in comparison to FY 07. The University issued $343 thousand of
long term debt in FY 08 to finance current or future acquisitions of capital assets. In FY 08,
$31.5 million was paid for construction and acquisition of capital assets. An additional $14.1
million of cash was used to make debt service payments on long term obligations, including,
$6.6 million of principal paid.
Specific events or cash transactions in FY 07 which were notable included:
¾ Cash flows from operating revenues increased by approximately $11.6 million over FY 06,
due primarily to an increase in cash flows from tuition and fees, auxiliary enterprise charges,
and sales and service activities totaling $10.9 million. This increase in cash flows was offset
by an increase in operating expenses of $9.8 million due largely to an increase in payments
for salaries and benefits of $7.9 million.
¾ Cash provided by investing activities declined by $2.8 million over the prior year due
primarily to an overall decrease in the purchase and sale of investments.
For years ended June 30,
(stated in millions)
2008 2007 2006
CASH FLOW CATEGORY
Cash Provided by (Used for):
Operating Activities $ (58.40) $ (47.39) $ (49.19)
Non-capital Financial Activities 88.96 80.13 80.66
Capital and Related Financial Activities (18.03) (36.44) (13.85)
Investing Activities (45.13) 6.12 8.98
Net (Decrease) Increase in Cash (32.60) 2.42 26.60
Cash and Cash Equivalents, beginning of year 87.05 84.63 58.03
Cash and Cash Equivalents, end of year $ 54.45 $ 87.05 $ 84.63
A-10
This is trial version
www.adultpdf.com
¾ Overall, $36.4 million in cash was used in capital and related financing activities, or an
increase of $22.6 million in comparison to FY 06. The University did not issue additional
long term debt in FY 07 to finance current or future acquisitions of capital assets. In FY 07,
$22.8 million was paid for construction and acquisition of capital assets. An additional $13.8
million of cash was used to make debt service payments on long term obligations, including,
$6.4 million of principal paid.
DISCUSSION OF SIGNIFICANT PENDING ECONOMIC AND FINANCIAL ISSUES
The issues we view as significant pending economic or financial issues for the four campuses of the
University are:
¾ As of June 30, 2008, there were a number of major construction projects that have been
completed, under construction or being planned. The following is a summary of estimated
costs, the projects and the status as of June 30
th
, 2008.
Project Name
Estimated
Cost Campus Status
Skaggs Addition $14.2M Missoula Compete
Anderson Hall $13.8M Missoula Complete
Stadium Expansion $5.75M Missoula Complete
HHP Lab Addition $1.4M Missoula Complete
Math Elevator ADA $1.2M Missoula Complete
Old Journalism Renovation $600,000 Missoula Complete
Natural Sciences Windows $310,000 Missoula Complete
Tennis court Resurface $125,000 Missoula Complete
South Campus Master Plan $75,000 Missoula Complete
Law School Addition $14.7M Missoula Under Construction
Interdisciplinary Science $13.8M Missoula Under Construction
Steam Line Replacement $12.4M Missoula Under Construction
Education Addition $12M Missoula Under Construction
CLAPP HVAC $820,000 Missoula Under Construction
Health Science HVAC $565,000 Missoula Under Construction
Mansfield Library HVAC $440,000 Missoula Under Construction
Field Station Renovation $400,000 Missoula Under Construction
Fire Lanes LA/Journalism $210,000 Missoula Under Construction
Native American Center $10M Missoula Out to Bid
Missoula COT $500,000 Missoula Design Development ($32.5m)
Gilkey Education Addition $9.0M Missoula Planning
Alumni/Foundation Building TBD Missoula Planning
Art/Culture Museum TBD Missoula Planning
MBMG/Petroleum Building $20.5M MT Tech Under Construction
Main Hall Renovation $4.5M Western Under Construction
These projects are being funded from a variety of sources including, Series J bond proceeds,
private donations and state funding.
¾ The 2007 Session of the Montana Legislature approved a plan proposed by the Governor to
freeze tuition for Montana resident students during the two years of the 2009 biennium. The
Governor’s initiative is known as the College Affordability Plan (CAP). The CAP replaced
tuition revenue with general fund appropriation. The Governor’s plan is a welcome relief for
Montana students after an extended period of rising tuition. Nonresident student tuition and
mandatory fees are not frozen and can be increased during the biennium upon approval by the
Board of Regents.
A-11
This is trial version
www.adultpdf.com
¾ The 2007 Session of the Montana Legislature did not appropriate sufficient additional
funding to cover operation and maintenance costs associated with several new facilities on
the Missoula campus. A concern for the University is securing long term funding over the
long-term to cover these ongoing costs without adversely affecting academic programs or
administrative services.
¾ The number of new high school graduates in Montana is projected to decline by about 20%
over the next 10 years. The decline in high school graduates will present a new challenge for
the University. The University has developed and is implementing strategies to improve
access and enhance participation by new high school graduates from Montana to mitigate the
impact of potential enrollment declines. While tuition at the University is in the moderate
range when compared to other peer institutions, even a moderate level of tuition increase is
not affordable for many Montana families. To improve access and hopefully increase the
participation rate of a smaller pool of prospective in-state students, the University will
continue to refine such programs as Montana Partnering for Affordable College Tuition
(MPACT) to minimize debt burden as a barrier to participation. The University will also
continue to encourage more need-based assistance at the State level to help increase the
overall support provided to economically disadvantaged students. An initiative is currently
underway to develop and implement a responsive retention program to improve the retention
rate of freshman through sophomore students. During FY 2008, the University completed the
development of a comprehensive set of initiatives that are designed to improve the overall
student success rate.
¾ Other efforts by the University to mitigate declining resident enrollment include broadening
marketing efforts to attract more non-resident students, including foreign students. In
addition, the University has placed emphasis on graduate enrollments and research
involvement.
¾ The University continues to seek ways to improve the efficiency and effectiveness of its
operations through an on-going assessment of its business practices. It must pursue
initiatives to generate additional financial support, reduce operating costs, while improving
services to students.
A-12
This is trial version
www.adultpdf.com