Báo cáo hóa học: " Do quality of life, participation and environment of older adults differ according to level of activity?" pdf
Bạn đang xem bản rút gọn của tài liệu. Xem và tải ngay bản đầy đủ của tài liệu tại đây (289.52 KB, 11 trang )
BioMed Central
Page 1 of 11
(page number not for citation purposes)
Health and Quality of Life Outcomes
Open Access
Research
Do quality of life, participation and environment of older adults
differ according to level of activity?
Mélanie Levasseur*
1,2,3,4
, Johanne Desrosiers
1,2
and Denise St-Cyr Tribble
4,5
Address:
1
Research Centre on Aging, Health and Social Services Centre – University Institute of Geriatrics of Sherbrooke (CSSS-IUGS), Sherbrooke,
Québec, Canada,
2
Department of Rehabilitation, Faculty of Medicine and Health Sciences, Université de Sherbrooke, Sherbrooke, Québec,
Canada,
3
Groupe de recherche interdisciplinaire en santé (Interdisciplinary Research Group on Health), Université de Montréal, Montréal,
Québec, Canada,
4
University of Sherbrooke Affiliated Local Community Centre (CLSC component) of the CSSS-IUGS, Sherbrooke, Québec,
Canada and
5
School of Nursing, Faculty of Medicine and Health Sciences, Université de Sherbrooke, Sherbrooke, Québec, Canada
Email: Mélanie Levasseur* - ; Johanne Desrosiers - ; Denise St-Cyr
Tribble -
* Corresponding author
Abstract
Background: Activity limitation is one of the most frequent geriatric clinical syndromes that have
significant individual and societal impacts. People living with activity limitations might have fewer
opportunities to be satisfied with life or experience happiness, which can have a negative effect on
their quality of life. Participation and environment are also important modifiable variables that
influence community living and are targeted by health interventions. However, little is known about
how quality of life, participation and environment differ according to activity level. This study
examines if quality of life, participation (level and satisfaction) and perceived quality of the
environment (facilitators or obstacles in the physical or social environment) of community-dwelling
older adults differ according to level of activity.
Methods: A cross-sectional design was used with a convenience sample of 156 older adults (mean
age = 73.7; 76.9% women), living at home and having good cognitive functions, recruited according
to three levels of activity limitations (none, slight to moderate and moderate to severe). Quality of
life was estimated with the Quality of Life Index, participation with the Assessment of Life Habits
and environment with the Measure of the Quality of the Environment. Analysis of variance
(ANOVA) or Welch F-ratio indicated if the main variables differed according to activity level.
Results: Quality of life and satisfaction with participation were greater with a higher activity level
(p < 0.001). However, these differences were clinically significant only between participants without
activity limitations and those with moderate to severe activity limitations. When activity level was
more limited, participation level was further restricted (p < 0.001) and the physical environment
was perceived as having more obstacles (p < 0.001). No differences were observed for facilitators
in the physical and social environment or for obstacles in the social environment.
Conclusion: This study suggests that older adults' participation level and obstacles in the physical
environment differ according to level of activity. Quality of life and satisfaction with participation
also differ but only when activity level is sufficiently disrupted. The study suggests the importance
of looking beyond activity when helping older adults live in the community.
Published: 29 April 2008
Health and Quality of Life Outcomes 2008, 6:30 doi:10.1186/1477-7525-6-30
Received: 22 November 2007
Accepted: 29 April 2008
This article is available from: />© 2008 Levasseur et al; licensee BioMed Central Ltd.
This is an Open Access article distributed under the terms of the Creative Commons Attribution License ( />),
which permits unrestricted use, distribution, and reproduction in any medium, provided the original work is properly cited.
Health and Quality of Life Outcomes 2008, 6:30 />Page 2 of 11
(page number not for citation purposes)
Background
Aging of the population, reform of the health care system
and individual preferences increase the number of older
adults with a decline in functional independence who live
in the community. A decline in functional independence,
or activity limitations according to the terminology of the
International Classification of Functioning, Disability and
Health (ICF) [1], is one of the most frequent geriatric clin-
ical syndromes that have significant individual and soci-
etal impacts [2]. People living with activity limitations
might have fewer opportunities to be satisfied with life or
experience happiness, which can have a negative effect on
their quality of life (QOL) [3]. Quality of life may be
defined as the sum of cognitive and emotional reactions
that an individual experiences associated with his/her
achievements [4] in the context of his/her culture and val-
ues, taking into account his/her goals, expectations, stand-
ards, and concerns [5]. This definition has the advantage
of partially including one of the most cited QOL defini-
tions developed by the World Health Organization Qual-
ity of Life (WHOQOL) Group and has been modified to
address criticism about its lack of emphasis on the indi-
vidual's reactions. As improving or maintaining QOL is
the ultimate goal of health interventions [6-8], it is impor-
tant to have a better understanding of the QOL of older
adults with different activity levels.
Participation and environment are also important modi-
fiable variables influencing community living ([9] and
targeted by health interventions [10-13]. Like activity
level, they are components of the ICF. According to the
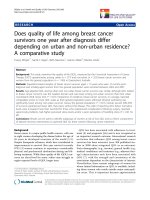
ICF (Figure 1), environmental factors include the physi-
cal, social and attitudinal environment in which people
live and conduct their lives [1]. Participation is the result
of interaction between the individual's health and contex-
tual factors that include both personal and environmental
factors. While activity is defined as an individual's ability
to perform a task or action, participation is defined as
involvement in a life situation [1] including accomplish-
ment of daily activities and social roles [9]. For example,
the capacity to walk 100 feet refers to activity whereas
walking in one's environment while doing daily activities
refers to participation. Satisfaction with participation is
closely related to personal goals and priorities [4] and
might better reflect an individual's perception of his/her
optimal participation level [14]. The concept of activity is
central to the ICF (Figure 1) and was traditionally consid-
ered one of the key outcomes in successful community liv-
ing [15]. However, little is known about how QOL,
participation and environment differ according to activity
level. Since it is increasingly recognized that body func-
tions and structures are more intrinsically linked to activ-
ity level, they were not considered in this study.
From a theoretical viewpoint, it is reasonable to assume
that QOL decreases with activity limitations [2]. However,
previous studies with older adults have produced incon-
sistent findings: some supported the importance of activ-
ity for QOL [2,16-23] while others showed limited
influence [16,24,25]. A narrow range of activity level of
participants or absence of comparison groups without
activity limitations as well as the lack of an underlying
conceptual model, however, limit the strength of the con-
clusions of most of these studies.
Furthermore, recent theory also shaped QOL studies.
According to response shift theory [26-28], the meaning
of one's QOL self-evaluation might change over time and
is not linear, allowing the person to maintain an equilib-
rium in his/her QOL assessment. Response shift is usually
initiated by a change in health that may affect the person's
activity level and can result in changes in his/her internal
standards, changes in the importance of values, or recon-
ceptualization of QOL [26-28]. With these changes, the
person might give less importance to some aspects such as
health and functioning and more to others like family or
spirituality. This new way to evaluate QOL might generate
the same global appreciation despite the presence of a
health problem. Therefore, studies on QOL should con-
sider response shift [26-28], which may threaten the valid-
ity of research assumptions and therefore the foundation
of self-reported QOL measures [29].
Previous studies and clinical interventions mostly targeted
activity level [15]. However, there is increasing evidence
that participation embraces the complexity of human
functioning better [1] and goes beyond activity level [30].
Participation has been shown to decrease in normal aging
[31], be more restricted by disabilities in old age [23] and
International Classification of Functioning, Disability and Health (ICF) modelFigure 1
International Classification of Functioning, Disability
and Health (ICF) model. Taken from: World Health
Organization (WHO) (2001). International Classification of
Functioning, Disability and Health. Geneva, Switzerland:
WHO.
Health and Quality of Life Outcomes 2008, 6:30 />Page 3 of 11
(page number not for citation purposes)
not be totally explained by activity level [30-32] Well-
adapted individuals might be satisfied with their partici-
pation level even if it is restricted [33,34].
Although the importance of environmental factors was
considered in the ICF, there is little evidence that supports
its inclusion [35,36]. There is a need for more knowledge
about how elderly people with disability perceive their
environmental factors to influence their participation
[37]. For individuals with activity limitations, support
from the social environment [38,39] and accessibility of
the physical environment [1,33,39-41] may be seen as
imperatives to help them live in the community [37,42].
However, results of previous studies are not consistent
regarding the beneficial effect of social support on activity
level [43], and little research has been done to document
whether the environment has an influence on the activity
level of older adults [43,44]. Individuals' perceptions of
both the physical and social environment might differ
according to their level of activity. Because of different life
experiences, some aspects of the environment are per-
ceived as a facilitator or an obstacle to their participation.
It is important to better understand the impact of environ-
mental factors. In fact, these factors can directly increase
the risk of activity limitations or exacerbate the negative
impact of other personal risk factors [45]. Interventions
targeting the environment may have a greater impact on
an individual's activity level than those targeting individ-
uals factors [46].
From this perspective, the present study aimed to explore,
based on the ICF, if QOL, participation and environment
of adults aged sixty and over differ according to their level
of activity.
Methods
Participants
This cross-sectional design involved 156 persons with dif-
ferent activity levels, aged 60 and over, and living in the
community. Eligibility criteria were: 1) good cognitive
functions (score on the Mini-Mental State Examination
[47] equal to or above the 25th percentile for age and
schooling [48]); 2) good understanding of French or Eng-
lish; and 3) a level of activity corresponding to one of the
three equal-sized groups created accordingly, as measured
by the Functional Autonomy Measurement System
(SMAF) [49]. The SMAF includes 29 functions covering 5
domains (number of items): activities of daily living (7),
mobility (6), communication (3), mental functions (5),
and instrumental activities of daily living (8). Each func-
tion is scored on a 5-point scale: 0 (independent), 0.5
(difficulty), 1 (needs supervision), 2 (needs help), 3
(dependent). The psychometric properties were studied
with older adults and are good: high intraclass correlation
coefficients (ICC) for test-retest (0.95) and interrater
(0.75) reliability and good discriminant validity [50]. For
the first group (G1), participants needed to have a score <
5, suggesting a good activity level; for the second group
(G2), a score between 5 and 19, indicating slight to mod-
erate activity limitations; and, for the third group (G3), a
score > 19, suggesting moderate to severe activity limita-
tions. These cut-off scores were used in other studies
[51,52], considered the potential measurement error of 5
points, and were discussed with the authors of the tool
and based on many years of clinical observations. At the
time of their recruitment, participants with activity limita-
tions were receiving services from a local community serv-
ice centre, geriatric day hospital or geriatric day centre, the
recruitment sites of the study. Participants without activity
limitations were recruited from a previous study on
healthy aging. People were excluded if they were termi-
nally ill or had moderate to severe language deficits. This
study was approved by the Research Ethics Committees of
the University Institute of Geriatrics of Sherbrooke and
the Eastern Townships Multivocational Institutions pro-
viding Home and Community Services.
Data collection procedures
All participants who were eligible, until the predeter-
mined sample size (n = 52 per group) was reached, signed
an informed consent form and were evaluated in about 90
minutes at their homes by one of the three occupational
therapists specifically trained to administer the question-
naires. The usual sociodemographic and clinical data (see
Table 1), mostly associated with the personal factors of
the ICF, were collected first. The International Classifica-
tion of Diseases (ICD-10) [53] was used to identify the
disease category that best represented the health condi-
tion of each participant. Comorbidity was measured with
the Charlson Index [54], which includes 30 conditions
rated on a four-level Likert scale. Three questionnaires
concerning the individual's perceptions were used to col-
lect data on the main variables: QOL, participation and
environment.
Measurement instruments
Quality of life was estimated with the Quality of Life Index
(QLI) [55], which is a generic satisfaction with life tool
that takes the individual's reactions into account [56]. It
includes 32 items related to four life domains (number of
items): Health and functioning (11), Socio-economic
(10), Psychological/spiritual (7) and Family (4). Each
item is evaluated by the participant on two 6-point Likert
scales ranging from 'very dissatisfied' (1) to 'very satisfied'
(6) or 'not important' (1) to 'very important' (6). The
importance scores allow weighting of the satisfaction
scores, reflecting both the individual's satisfaction and
importance of values. This importance score can be used
to partially assess response shift. The scale ranges from 0
to 30 for each domain and for the total score, with scores
Health and Quality of Life Outcomes 2008, 6:30 />Page 4 of 11
(page number not for citation purposes)
of 19 or less indicating poorer QOL (tool and details
about scoring available at [57]). The total score normal
range is 23.0 (SD = 4.0) and a difference of 2–3 points rep-
resents a change that is noticeable in practice, i.e. is clini-
cally meaningful [58]. The internal consistency of the QLI
is supported by several studies (Cronbach's alphas = 0.76
to 0.91) [21,25]. Good test-retest reliability (r = 0.81 to
0.87) and concurrent validity with one measure of life sat-
isfaction (r = 0.65 to 0.75) have also been demonstrated
[55].
The Assessment of Life Habits (Life-H) short 3.0 version
[59] is a questionnaire assessing level of accomplishment
in daily activities and social roles (participation), and sat-
isfaction with this accomplishment level (satisfaction
with participation). The Life-H 3.0 is composed of 69
Table 1: Characteristics of the participants (n = 52 per group)
Continuous variables G1 Mean (SD) G2 Mean (SD) G3 Mean (SD) p value
Functional independence (SMAF;/87) 1.4 (1.6)
a
10.2 (4.1)
b
29.0 (7.6) < 0.001
c
Age (years) 70.2 (7.0)
a
74.9 (8.4) 75.8 (7.6) < 0.001
d
Associated conditions (#) 0.8 (1.2)
a
1.5 (1.4)
b
3.3 (2.3) < 0.001
d
Categorical variables Frequency (%) Frequency (%) Frequency (%)
Gender (women) 40 (76.9)
a
28 (53.8) 26 (50) 0.01
e
Education (years):
- 1–6 4 (7.7) 14 (26.9) 14 (26.9) 0.28
d
- 7–11 27 (51.9) 23 (44.2) 23 (44.2)
- 12–14 18 (34.6) 8 (15.4) 9 (17.3)
- > 15 3 (5.7) 7 (13.5) 6 (11.6)
Residential status:
- Owner 29 (55.8)
f
24 (46.2) 16 (30.8) 0.04
e
- Tenant 22 (42.3) 22 (42.3) 20 (38.5)
- Other 1 (1.9) 6 (11.5) 16 (30.8)
Income (Can $):
- < 15,000 11 (21.2)
a
21 (40.4) 19 (36.5) 0.006
d
- 15,001- 25,000 9 (17.3) 13 (25.0) 14 (26.9)
- > 25,001 21 (40.4) 16 (30.8) 15 (28.8)
Missing Data 11 (21.2) 2 (3.8) 4 (7.7)
Classification of diseases (ICD-10):
- Diseases of the nervous system 1 (1.9)
a
5 (9.6)
b
22 (42.3) < 0.001
e
- Diseases of the circulatory system 26 (50.0) 17 (32.7) 7 (13.5)
- Injury, poisoning and certain other consequences of external causes (including hip
fracture)
1 (1.9) 12 (23.1) 9 (17.3)
- Diseases of the musculoskeletal system and connective tissue 7 (13.5) 12 (23.1) 8 (15.4)
- Other 17 (32.7) 6 (11.5) 6 (11.5)
Self-perceived health:
- Excellent 27 (51.9)
a
10 (19.2)
b
1 (1.9) < 0.001
c
- Good 21 (40.4) 25 (48.1) 16 (30.8)
- Fair 4 (7.7) 14 (26.9) 26 (50.0)
- Poor 0 (0) 3 (5.8) 9 (17.3)
Stability of self-perceived capacities (Yes) 52 (100.0)
a
39 (75.0) 42 (80.8) 0.001 e
Self-perceived mood (not depressed) 48 (92.3)
f
42 (80.8) 35 (67.3) 0.006
e
G1: SMAF < 5 G2: SMAF [5, 19] G3: SMAF > 19 ICD-10: International Classification of Diseases
a
: G1 differs significantly from the other two groups on these variables (p < 0.017).
b
: G2 differs significantly from G3 on these variables (p < 0.017).
c
: p value associated with ANOVA. A significant value (p < 0.05) indicates a difference between the three groups.
d
: p value associated with Welch F-ratio. A significant value (p < 0.05) indicates a difference between the three groups.
e
: χ
2
test
f
: G1 differs significantly only from G3 on these variables (p < 0.017).
Health and Quality of Life Outcomes 2008, 6:30 />Page 5 of 11
(page number not for citation purposes)
items divided into 12 domains of life. These domains
(number of items) are: nutrition (3), fitness (3), personal
care (7), communication (7), housing (8), mobility (5),
responsibilities (6), interpersonal relationships (7), com-
munity life (7), education (3), employment (7) and recre-
ation (6). The first six domains refer to daily activities
while the other six are associated with social roles. Partic-
ipation is based on the level of difficulty and assistance
used to carry out the activities or roles, and ranges from 0
(not accomplished) to 9 (accomplished without diffi-
culty). Normal range scores are 8.1 (SD = 0.5) for daily
activities and 8.2 (SD = 0.8) for social roles [30] and a
change of 0.5 is clinically significant [60]. Satisfaction
with each item is rated on a 5-point Likert scale ranging
from 1 (very dissatisfied) to 5 (very satisfied). Two scores
are reported for both level of and satisfaction with partic-
ipation: the mean subscore for daily activities and the
mean subscore for social roles. The psychometric proper-
ties of the level of participation scale, studied with older
adults, are good: high global ICC for test-retest (0.95) and
interrater (0.89) reliability for the total score [61] and
good construct validity [30].
The Measure of the Quality of the Environment (MQE)
version 2.0 [62] documented the self-perceived physical
and social environment, i.e., whether each environmental
item is perceived as a facilitator or an obstacle in the
accomplishment of daily activities and social roles. The
MQE comprises six domains which cover most aspects of
the environment (number of items): social support and
attitudes (14), income, labour and income security (15),
government and public services (27), equal opportunities
and political orientations (10), physical environment and
accessibility (38), and technology (5). Generally, the last
two domains refer to the physical environment (40 items)
while the rest refer to the social environment (69 items).
The person's perception is rated on a 7-point Likert scale
ranging from -3 (major obstacle) to 3 (major facilitator),
allowing weighting of the items. As Whiteneck and col-
leagues [35] indicated that insurmountable barriers which
are systematically avoided may not be reported per se, the
interviewer (occupational therapist) further questioned
the person when the rating might not have fully consid-
ered the reality. Two continuous scores, an "obstacle"
score and a "facilitator" score, are calculated by summing
the weighted items for both the physical and social envi-
ronments. The mean number of items perceived as facili-
tators or obstacles out of 40 (physical environment) or 69
(social environment) is also reported. A test-retest reliabil-
ity study showed moderate to high kappas for 57% of the
items [63].
Statistical analysis
Characteristics of the participants were described by
means and standard deviations or frequencies and per-
centages according to the type of variable (continuous or
categorical, respectively) and compared across the groups
with the chi square test (dichotomized categories) or anal-
ysis of variance (ANOVA). Chi square and t tests also com-
pared the sociodemographic characteristics of participants
with those who refused to participate. When homogeneity
of variance was not respected, the Welch F-ratio was calcu-
lated instead of ANOVA.
The mean score (out of 6) was calculated using the QLI
"satisfaction" and "importance" scores. ANOVA or Welch
F-ratio was then used to determine whether QLI satisfac-
tion and importance differed depending on the level of
activity. These tests also indicated if the main variables dif-
fered according to activity level. When statistical differ-
ences were identified, two-by-two tests (multiple
comparisons) were calculated to locate the differences,
with a p value of 0.017 (Bonferroni's correction).
Regression analyses were also performed to identify
whether QLI, Life-H and MQE differences between the
groups persisted when controlling for confounding varia-
bles. These confounding variables differed between the
groups and were associated with the corresponding main
variable.
Results
Fifty-two participants per activity level group were
recruited. A total of 198 people were contacted in order to
obtain the predetermined sample size. Those who refused
to participate (n = 42) were older and had less schooling
and a lower income than those who agreed. The sociode-
mographic characteristics of participants are presented
and compared in Table 1. Participants with no activity
limitations (G1) were younger and mostly female. Com-
pared to G1, fewer G3 participants lived in their own
home and more of them had a lower income as well as
perceived themselves as depressed.
Generally, the QLI scores were significantly lower with
more activity limitations, except for the "Family" domain
which also obtained the highest mean scores (Table 2).
The G3 "Health and functioning" domain was the only
QLI score below 19, indicating poorer QOL. The QLI total
score varies by nearly 2 points between each group. When
controlled for the confounding variables (income, resi-
dential status and self-perceived mood), the difference
between the groups' QLI total score persisted by 1.2 points
out of 30 between each group (p < 0.001). This difference
is clinically significant only between G1 and G3.
The participants' QLI satisfaction and importance scores
also decreased significantly across the groups for the total
score and each of the life domains, except the "Family"
domain (Table 3). The importance score of the "Psycho-
Health and Quality of Life Outcomes 2008, 6:30 />Page 6 of 11
(page number not for citation purposes)
logical/Spiritual" domain and the total score were also
similar in each group and high. "Health and functioning"
was the QLI domain that mainly differed between the
groups, especially for the satisfaction score, which appears
to be the only one that is clinically significant.
Level of participation also decreased between each group
for both daily activities and social roles, but the difference
was greater between G2 and G3 than between G1 and G2
(Table 2). Even after controlling for age, income and self-
perceived mood, the differences between each group per-
sisted, with scores decreasing by 1.3 (daily activities) or
1.5 (social roles) out of 9 (p < 0.001), and were clinically
significant.
Satisfaction with participation scores was also lower with
additional activity limitations between each group for
both daily activities and social roles (Table 2). Again,
compared to the difference between G1 and G2, the great-
est difference was found between the two groups with
activity limitations (G2 and G3). These differences per-
sisted after controlling for age and self-perceived mood,
decreasing by 0.3 (daily activities) or 0.2 (social roles)
points out of 5 (p < 0.001), and appear to be clinically sig-
nificant only between G1 and G3.
Generally, the environment was mainly perceived as a
facilitator in the accomplishment of daily activities and
social roles while obstacles in the environment were pri-
marily attributed to the physical environment (Table 2).
Between-group differences were observed for facilitators
in the physical environment as well as for obstacles in the
physical and social environment. However, after control-
ling for income and residential status, differences accord-
ing to level of activity persisted only for obstacles in the
physical environment (difference of 5.1 points for the
weighted items between each group (p < 0.001)).
Participants with activity limitations (G2 and G3) did not
differ in their perceived number of obstacles in the physi-
Table 2: Comparisons of scores on main variables by group (n = 52 per group)
Continuous variables G1 Mean (SD) G2 Mean (SD) G3 Mean (SD) p value
1. Quality of life (QLI;/30)
- Health and functioning 23.2 (2.7)
a
20.1 (4.0)
b
16.5 (3.8) < 0.001
c
- Socio-economic 23.1 (2.8)
a
21.2 (3.3) 20.3 (3.5) < 0.001
c
- Psychological/spiritual 23.4 (2.4)
d
22.8 (3.7) 21.6 (3.3) 0.009
e
- Family 23.6 (4.0) 23.7 (5.2) 23.2 (4.0) 0.83
c
Total score 23.3 (2.3)
a
21.5 (3.1)
b
19.6 (2.9) < 0.001
c
2. Participation (Life-H)
• Accomplishment scale (/9)
- Daily activities 8.3 (0.4)
a
7.3 (0.7)
b
5.4 (0.9) < 0.001
e
- Social roles 8.6 (0.6)
a
7.1 (1.4)
b
5.1 (1.1) < 0.001
e
• Satisfaction scale (/5)
- Daily activities 4.2 (0.3)
a
4.0 (0.4)
b
3.5 (0.4) < 0.001
c
- Social roles 4.2 (0.3)
a
4.0 (0.4)
b
3.6 (0.5) < 0.001
c
3. Environment (MQE)
• Facilitators
- Physical (# of items;/40) 21.3 (8.1)
f
25.3 (5.4)
b
22.3 (5.1) 0.003
e
Weighted number 50.8 (22.0) 56.5 (12.1)
b
49.2 (11.9) 0.009
e
- Social (# of items;/69) 29.6 (7.8) 32.3 (6.2) 30.4 (6.4) 0.13
c
Weighted number 67.3 (20.3) 68.8 (14.7) 66.6 (17.4) 0.77
e
• Obstacles
- Physical (# of items;/40) 6.8 (3.9)
a
9.0 (4.3) 10.9 (4.0) < 0.001
c
Weighted number 11.5 (8.3)
a
17.0 (10.1)
b
22.7 (10.6) < 0.001
e
- Social (# of items;/69) 1.4 (1.3) 2.3 (3.3) 2.5 (3.0) 0.03
e
Weighted number 2.3 (2.4)
d
4.5 (7.3) 4.8 (6.8) 0.009
e
G1: SMAF < 5 G2: SMAF [5, 19] G3: SMAF > 19
a
: G1 differs significantly from the other two groups on these variables (p < 0.017).
b
: G2 differs significantly from G3 on these variables (p < 0.017).
c
: p value associated with ANOVA. A significant value (p < 0.05) indicates a difference between the three groups.
d
: G1 differs significantly only from G3 on these variables (p < 0.017).
e
: p value associated with Welch F-ratio. A significant value (p < 0.05) indicates a difference between the three groups.
f
: G1 differs significantly only from G2 on this variable (p < 0.017).
QLI: Quality of Life Index (normal range = 23.0; SD = 4.0) Life-H: Assessment of Life Habits (normal range for daily activities = 8.1; SD = 0.5 and for
social roles = 8.2; SD = 0.8) MQE: Measure of the Quality of the Environment
Health and Quality of Life Outcomes 2008, 6:30 />Page 7 of 11
(page number not for citation purposes)
cal environment, but these obstacles, as measured by the
MQE, seemed to disrupt G3's participation more (Table
2). Group 1 and G3 participants did not differ in their per-
ceived number of obstacles in the social environment, but
these obstacles appeared to affect participation more in
G3 than G1. Finally, G2 participants perceived more facil-
itators in their physical environment than G1, but these
facilitators seem to not affect participation differently in
these two groups.
Discussion
The main objective of this study was to examine QOL,
participation and environment according to older adults'
level of activity. The results showed that QOL decreased
according to activity limitations, suggesting that a reduced
activity level is associated with decreased QOL. However,
QOL diminished only slightly across the groups, after
controlling for income, residential status and mood, and
were clinically significant only between participants with-
out activity limitations and those with moderate to severe
activity limitations. Moreover, except for the G3 "Health
and functioning" domain, QLI scores were not low
enough to qualify as poor QOL. These high QOL scores
suggest that participants modified their assessment of
their QOL, i.e. underwent a response shift [26-28]. Other
studies discovered that it is difficult to live with decreased
QOL [34], with many people living with significant and
persistent activity limitations reporting good or excellent
QOL [33,34,64]. As suggested by two qualitative studies
with adults having activity limitations [33,34], adaptation
appears to have more influence on QOL than activity lim-
itations by themselves. Finally, QOL of polio survivors
was found to be similar, regardless of the severity of symp-
toms, but lower than that of healthy people, mainly for
the health domain [65].
As expected, because of the activity level recruitment crite-
ria, the greatest differences between the groups was in QLI
satisfaction scores in the "Health and functioning"
domain. Also because of the activity level recruitment cri-
teria, we expected to find a response shift. This could be
initiated by a change in internal standards (approximately
the same level of satisfaction on the QLI between groups)
or a change in values (a difference in the importance score
of the QLI between groups). In fact, based on the QLI
importance scores, between-group differences were small.
The change in internal standards or values proposed by
the response shift theory was therefore only partially sup-
ported by our data. However, response shift can also result
from reconceptualization of QOL [26-28], and this was
not taken into account in our study. In addition, the QOL
comparisons were not on the same individuals (longitudi-
nal), making response shift considerations only explora-
tory.
As expected and consistent with the ICF, level of participa-
tion decreased with increased activity limitations, as sup-
ported by other studies [30,66,67]. Furthermore, in a
study with people who had a stroke [32], age together
with level of impairment and disability explained a sub-
stantial part, 53%, of the variance in participation.
Another cross-sectional study, this time with people with
spinal cord injury, found [35], demonstrated that
restricted participation is best explained (20%) by more
limitations in activity. In our study, G1 participation
scores very similar to those obtained in a study on normal
aging [30] and G3 scores were similar to people who had
Table 3: Comparisons of satisfaction and importance scores of quality of life index by group (n = 52 per group)
Continuous variables (/6) G1 Mean (SD) G2 Mean (SD) G3 Mean (SD) p value
Health and functioning:
- Satisfaction 5.0 (0.5) 4.4 (0.8) 3.8 (0.8) < 0.001
a
- Importance 5.1 (0.5) 5.1 (0.5) 4.8 (0.6) 0.01
b
Socio-economic:
- Satisfaction 4.6 (0.5) 4.3 (0.6) 4.1 (0.6) < 0.001
b
- Importance 4.5 (0.4) 4.4 (0.4) 4.3 (0.6) 0.045
a
Psychological/spiritual:
- Satisfaction 5.1 (0.4) 4.9 (0.6) 4.7 (0.6) 0.003
a
- Importance 5.3 (0.4) 5.3 (0.5) 5.2 (0.7) 0.51
b
Family:
- Satisfaction 4.7 (0.9) 4.8 (1.1) 4.6 (0.9) 0.60
b
- Importance 5.4 (0.8) 5.6 (0.6) 5.4 (0.8) 0.48
b
Total score:
- Satisfaction 4.8 (0.4) 4.5 (0.6) 4.2 (0.6) < 0.001
b
- Importance 5.0 (0.3) 5.0 (0.3) 4.8 (0.5) 0.07
a
G1: SMAF < 5 G2: SMAF [5, 19] G3: SMAF > 19
a
: p value associated with Welch F-ratio. A significant value (p < 0.05) indicates a difference between the three groups.
b
: p value associated with ANOVA. A significant value (p < 0.05) indicates a difference between the three groups.
Health and Quality of Life Outcomes 2008, 6:30 />Page 8 of 11
(page number not for citation purposes)
a stroke [60]. However, as participation had been previ-
ously demonstrated to go beyond activity level [30], our
results highlight the importance of differentiating better
between the operationalization of activity and participa-
tion as proposed by the ICF.
To our knowledge, variations in satisfaction with partici-
pation according to older adults' activity level have not
been previously documented. Satisfaction with participa-
tion might represent older adults' adaptation and selec-
tion of activities that are most important to them. In the
present study, satisfaction with participation decreased
according to level of activity but was clinically significant
only between participants without activity limitations and
those with moderate to severe activity limitations. Like
QOL, satisfaction can be modified by a response shift. It is
not clear that a response shift occurred here in regard to
satisfaction with participation since neither the participa-
tion measurement tool nor the study design allowed full
consideration of the response shift.
Self-perceived depressed mood differs according to activ-
ity level, QOL and level of and satisfaction with participa-
tion. Older adults with depressed mood may do fewer
activities and restrict their participation, which in turn
may influence their QOL. However, this cross-sectional
study did not allow us to clarify if depressed mood causes
a lower activity level, restriction in participation or lower
QOL.
Even if theoretically the social and physical environment
can facilitate or impede participation, the role of environ-
mental factors in human functioning is not as simple. In
this study, perceived obstacles in the physical environ-
ment increased according to activity level and seem to
affect the participation of older adults having moderate to
severe activity limitations more than those with slight to
moderate limitations. Obviously, people having greater
difficulty walking and moving around find the physical
environment less user-friendly. In fact, two studies
showed that many people with disability feel estranged
and oppressed by facets of the built environment [68] and
that subjects with more activity limitations reported more
barriers [35]. An adaptive environment is a salient feature
for people with physical disabilities [69]. However, a
recent study with older adults showed that physical barri-
ers were not an important issue for participation because
of help from the social environment [37]. In addition,
perceived obstacles in the social environment increased
between G1 and G3. Social support and attitudes might
be seen as not or less helpful for people with activity lim-
itations. These people often have limited income and con-
siderable expenses associated with their health problem
[70] and might perceive public and government services
as less adapted to their specific needs. However, familiar-
ity and lifelong experience can also influence individuals'
perception of their environment.
Environments that present more barriers and fewer
resources might trigger a pattern of disuse and subsequent
reductions in activity level, speeding up the aging process
[39]. Older adults with activity limitations have been
known to experience an increased sensitivity to physical
barriers in the environment [38]. Another longitudinal
study with older adults showed that living in a deficient
environment was associated with an increased risk of
overall activity loss [44]. However, this populational
study focused on a small number of negative environmen-
tal characteristics and did not use a standardized instru-
ment to measure their participants' activity level. Finally,
as postulated in a study with people with spinal cord
injury [35], people facing barriers may, with added diffi-
culty, be able to overcome them (participation) but that
the experience of encountering barriers may reduce QOL.
Surprisingly, facilitators in the social environment were
not perceived differently by the groups. Rochette and col-
laborators [32] found that facilitators in the environment
are not associated with participation. Since the impor-
tance of social support for people with activity limitations
has been documented by many studies [24,25,33,64,71]
and community resources and services are usually not suf-
ficient, older adults with activity limitations might need
further help from their social environment. When desired
by the person, social support such as encouraging, sup-
portive family and friends would be extremely valuable in
counteracting obstacles and enhancing health and QOL
[72].
Increasing older adults' activity level or facilitators in their
environment and reducing obstacles in their environment
can mainly be achieved by proper coordination of health
services. Older adults' health programs and strategies tra-
ditionally target personal factors to the detriment of envi-
ronmental factors that favor health and activities [73].
Prevention programs and new government policies are
also necessary to increase facilitators and lessen obstacles
in the environment. For example, a prevention program
can increase social support or government policies can
favour implementing age-friendly cities advocated by the
World Health Organisation (WHO) to promote older
adults' participation. Environmental factors need to sup-
port and reinforce older adults' competence, facilitate
adaptation, and compensate for activity limitations [39].
Study limitations and strengths
This study was carried out with a convenience sample of
people having good cognitive functions and, for those
with activity limitations, receiving health or community
services that may positively influence their QOL, and
Health and Quality of Life Outcomes 2008, 6:30 />Page 9 of 11
(page number not for citation purposes)
might not be fully representative of older adults having
activity limitations and living in the community. The
comparison between the main variables was cross-sec-
tional but the sample size was sufficient (n = 52) to allow
detection of a standardized difference smaller than 0.4
between two means for a p value of 0.05 and power at
80% [74]. Finally, some items of the measurement tools
were similar and might partly explain some differences
between the groups, especially for participation level.
Nevertheless, this study is a first step in understanding var-
iations in QOL, participation and environment according
to the activity level of older adults. The strengths of the
study are the creation of groups based on activity level to
address the research objective, the underlying conceptual
model (ICF), the consideration of important modifiable
variables targeted by health interventions, and the rigor-
ous methodology including validated tools.
Conclusion
This study demonstrated that older adults' QOL and satis-
faction with participation vary according to activity level,
but mainly when the latter is sufficiently disrupted. Level
of participation and perceived obstacles in the environ-
ment also vary with level of activity. Finally, the study sug-
gests the importance of looking beyond activity measures
to help community-living older adults with activity limi-
tations.
List of abbreviations used
ANOVA: Analysis of variance; CIHR: Canadian Institutes
of Health Research; FRSQ: Fonds de la recherche en santé
du Québec; G1: First group, participants with a SMAF
score < 5, suggesting a good activity level; G2: Second
group, participants with a SMAF between 5 and 19, indi-
cating slight to moderate activity limitations; G3: Third
group, participants with a SMAF score > 19, suggesting
moderate to severe activity limitations; ICC: Intraclass cor-
relation coefficients; ICD-10: International Classification
of Diseases; ICF: International Classification of Function-
ing, Disability and Health; Life-H: Assessment of Life
Habits; MQE: Measure of the Quality of the Environment;
SMAF: Functional Autonomy Measurement System; QLI:
Quality of Life Index; QOL: Quality of life.
Competing interests
The authors declare that they have no competing interests.
Authors' contributions
ML conceived the study, participated in the data collec-
tion, coordinated the study, performed the statistical anal-
ysis and drafted the manuscript. JD and DST participated
in the design and helped to draft the manuscript. All
authors read and approved the final manuscript.
Acknowledgements
The project was partially funded by the Quebec Rehabilitation Research
Network of the Fonds de la recherche en santé du Québec (FRSQ). At the
time of the study, Mélanie Levasseur received a FRSQ scholarship and
Johanne Desrosiers was a Canadian Institutes of Health Research (CIHR)
Research Fellow. Mélanie Levasseur is now a FRSQ postdoctoral trainee
and Johanne Desrosiers a National Researcher of the FRSQ. The authors
wish to thank the people who participated in the study as well as Annick
Bourget, MSc, OT, and Sabrina Fournier, OT, who contributed to subject
recruitment and data collection.
References
1. WHO: International Classification of Functioning, Disability and Health
WHO: Geneva, Switzerland; 2001.
2. Asakawa T, Koyano W, Ando T, Shibata H: Effects of functional
decline on quality of life among the Japanese elderly. Int J
Aging Hum Dev 2000, 50:319-328.
3. Bränholm IB, Eklund M, Fugl-Meyer KS, Fugl-Meyer AR: On work
and life satisfaction. J Rehabil Sci 1991, 4:29-34.
4. Calman KC: Quality of life in cancer patients – an hypothesis.
J Med Ethics 1984, 10:124-127.
5. WHOQOL Group: World Health Organization Quality of Life
Assessment: position paper from the World Health Organi-
zation. Soc Sci Med 1995, 41:1403-9.
6. Day H, Jankey SG: Lessons from the literature: toward a holis-
tic model of quality of life. In Quality of life health promotion and
rehabilitation Edited by: Renwick R, Brown I, Nagler M. Thousand
Oaks, California: Sage Publications; 1996:39-50.
7. Hammell K: Spinal cord injury; quality of life; OT: is there a
connection? Br J Occup Ther 1995, 58(4):151-157.
8. Pain K, Dunn M, Anderson G, Darrah J, Kratochvil M: Quality of life:
what does it mean in rehabilitation? J Rehabil 1998, 64:5-11.
9. Fougeyrollas P, Noreau L, Bergeron H, Cloutier R, Dion SA, St-Michel
G: Social consequences of long term impairments and disa-
bilities: conceptual approach and assessment of handicap. Int
J Rehabil Res 1998, 21:127-141.
10. Law M, Cooper B, Strong S, Stewart D, Rigby P, Letts L: The person-
environment-occupational model: a transactive approach to
occupational performance. Can J Occup Ther 1996, 63:9-23.
11. Letts L, Law M, Rigby P, Cooper B, Stewart D, Strong S: Person-
Environment assessment in occupational therapy. Am J Occup
Ther 1994, 48:608-618.
12. Rowles GD:
Beyond performance: being in place as a compo-
nent of occupational therapy. Am J Occup Ther 1991, 45:265-271.
13. Wilcock AA: Reflections on doing, being and becoming. Can J
Occup Ther 1998, 65:248-257.
14. Rochette A, Korner-Bitensky N, Levasseur M: 'Optimal' participa-
tion: a reflective look. Disabil Rehabil 2006, 28:1231-1235.
15. Desrosiers J, Rochette A, Noreau L, Bravo G, Hébert R, Boutin C:
Comparison of two functional independence scales with a
participation measure in post-stroke rehabilitation. Arch Ger-
ontol Geriatr 2003, 37:157-172.
16. Bowling A, Gabriel Z, Dykes J, Dowding LM, Evans O, Fleissig A, Ban-
ister D, Sutton S: Let's ask them: a national survey of defini-
tions of quality of life and its enhancement among people
aged 65 and over. Int J Aging Hum Dev 2003, 56:269-306.
17. Lau A, Chi I, McKenna K: Self-perceived quality of life of Chinese
elderly people in Hong Kong. Occup Ther Int 1998, 5:118-139.
18. Mayo NE, Wood-Dauphinee S, Côté R, Durcan L, Carlton J: Activ-
ity, participation, and quality of life 6 months poststroke.
Arch Phys Med Rehabil 2002, 83:1035-1042.
19. Prince MJ, Harwood RH, Blizard RA, Thomas A, Mann AH: Impair-
ment, disability and handicap as risk factors for depression in
old age. The Gospel Oak Project V. Psychol Med 1997,
27:311-321.
20. Richard L, Laforest S, Dufresne F, Sapinski JP: The quality of life of
older adults living in an urban environment: professional and
lay perspectives. Can J Aging 2005, 24:19-30.
21. Robinson-Smith G, Johnston MV, Allen J: Self-care self-efficacy,
quality of life, and depression after stroke. Arch Phys Med Reha-
bil 2000, 81:460-464.
Health and Quality of Life Outcomes 2008, 6:30 />Page 10 of 11
(page number not for citation purposes)
22. Smith NR, Kielhofner G, Watts JH: The relationships between
volition, activity pattern, and life satisfaction in the elderly.
Am J Occup Ther 1986, 40:278-283.
23. van Campen C, Iedema J: Are persons with physical disabilities
who participate in society healthier and happier? Structural
equation modelling of objective participation and subjective
well-being. Qual Life Res 2007, 16:635-645.
24. Kim P, Warren S, Madill H, Hadley M: Quality of life of stroke sur-
vivors. Qual Life Res 1999, 8:293-301.
25. King RB: Quality of life after stroke. Stroke 1996, 27:1467-1472.
26. Sprangers MA, Schwartz CE: Integrating response shift into
health-related quality of life research: a theoretical model.
Soc Sci Med 1999, 48:1507-1515.
27. Schwartz CE, Sprangers MA: Methodological approaches for
assessing response shift in longitudinal health-related qual-
ity-of-life research. Soc Sci Med 1999, 48:1531-1548.
28. Schwartz CE, Andresen EM, Nosek MA, Krahn GL: Response shift
theory: important implications for measuring quality of life
in people with disability. Arch Phys Med Rehabil 2007, 88:529-536.
29. Tate DG, Kalpakjian CZ, Forchheimer MB: Quality of life issues in
individuals with spinal cord injury. Arch Phys Med Rehabil 2002,
83:S18-S25.
30. Desrosiers J, Noreau L, Robichaud L, Fougeyrollas P, Rochette A, Vis-
cogliosi C: Validity of the Assessment of Life Habits in older
adults. J Rehabil Med 2004, 36:177-182.
31. Sorensen LV, Axelsen U, Avlund K: Social participation and func-
tional ability from age 75 to age 80. Scand J Occup Ther 2002,
9:71-78.
32. Rochette A, Desrosiers J, Noreau L: Association between per-
sonal and environmental factors and the occurrence of hand-
icap situations following a stroke. Disabil Rehabil 2001,
23:559-569.
33. Albrecht GL, Devlieger PJ: The disability paradox: High quality
of life against all odds.
Soc Sci Med 1999, 48:977-988.
34. Viemero V, Krause C: Quality of life in individuals with physical
disabilities. Psychother Psychosom 1998, 67:317-322.
35. Whiteneck G, Meade MA, Dijkers M, Tate DG, Bushnik T, Forchhe-
imer MB: Environmental factors and their role in participation
and life satisfaction after spinal cord injury. Arch Phys Med Reha-
bil 2004, 85:1793-1803.
36. Whiteneck G: Conceptual models of disability: past, present,
& future. In Workshop on disability in America: A new look Edited by:
Field MJ, Jette AM, Martin L. Washington, DC, National Academies
Press; 2006:50-66.
37. Vik K, Lilja M, Nygard L: The influence of the environment on
participation subsequent to rehabilitation as experienced by
elderly people in Norway. Scand J Occup Ther 2007, 14:86-95.
38. Carp FM: Neighborhood Quality Perception and Measure-
ment. In Housing an aging society: Issues, alternatives, and policy Edited
by: Newcomer RJ, Lawton P, Byerts TO. New York, Van Nostrand
Reinhold Company; 1986:127-140.
39. Glass TA, Balfour JL: Neighborhoods, aging, and functional lim-
itations. In Neighborhoods and health Edited by: Kawachi I, Berkman
LF. New York, Oxford University Press; 2003:303-334.
40. Richards JS, Bombardier CH, Tate D, Dijkers M, Gordon W, Shew-
chuk R, DeVivo MJ: Access to the environment and life satisfac-
tion after spinal cord injury. Arch Phys Med Rehabil 1999,
80:1501-1506.
41. Verbrugge LM, Rennert C, Madans JH: The great efficacy of per-
sonal and equipment assistance in reducing disability. Am J
Public Health 1997, 87:384-392.
42. Horowitz BP: Occupational therapy home assessments: sup-
porting community living through client-centered practice.
Occup Ther Ment Health 2002, 18:1-17.
43. Stuck AE, Walthert JM, Nikolaus T, Bula CJ, Hohmann C, Beck JC:
Risk factors for functional status decline in community-living
elderly people: a systematic literature review. Soc Sci Med
1999,
48:445-469.
44. Balfour JL, Kaplan GA: Neighborhood environment and loss of
physical function in older adults: evidence from the Alameda
County Study. Am J Epidemiol 2002, 155(6):507-515.
45. Verbrugge LM, Jette AM: The disablement process. Soc Sci Med
1994, 38:1-14.
46. Lawton M: Environment and Aging 1980 edition. Monterey, California,
Brooks/Cole .
47. Folstein MF, Folstein SE, McHugh PR: "Mini-mental state". A
practical method for grading the cognitive state of patients
for the clinician. J Psychiatr Res 1975, 12:189-198.
48. Bravo G, Hébert R: Age- and education-specific reference val-
ues for the Mini-Mental and modified Mini-Mental State
Examinations derived from a non-demented elderly popula-
tion. Int J Geriatr Psychiatry 1997, 12:1008-1018.
49. Hébert R, Carrier R, Bilodeau A: The Functional Autonomy
Measurement System (SMAF): description and validation of
an instrument for the measurement of handicaps. Age Ageing
1988, 17:293-302.
50. Desrosiers J, Bravo G, Hébert R, Dubuc N: Reliability of the
revised functional autonomy measurement system (SMAF)
for epidemiological research. Age Ageing 1995, 24:402-406.
51. Levasseur M, Desrosiers J, Noreau L: Is social participation asso-
ciated with quality of life of older adults with physical disabil-
ities? Disabil Rehabil 2004, 26:1206-1213.
52. Levasseur M, Desrosiers J, Noreau L: Relationships between envi-
ronment and quality of life of older adults with physical disa-
bilities. Phys Occup Ther Geriatr 2004, 22:37-53.
53. International Statistical Classification of Diseases and
Related Health Problems (10th Revision) [http://
www.who.int/classifications/apps/icd/icd10online]. World Health
Organisation
54. Charlson ME, Pompei P, Ales KL, MacKenzie CR: A new method of
classifying prognostic comorbidity in longitudinal studies:
development and validation. J Chronic Dis 1987, 40:373-383.
55. Ferrans CE, Powers MJ: Quality of life index: development and
psychometric properties. Adv Nurs Sci 1985, 8:15-24.
56. Dijkers MP: Individualization in quality of life measurement:
Instruments and approaches. Arch Phys Med Rehabil 2003, 84(4
Suppl 2):S3-S14.
57. Ferrans & Powers: Quality of Life Index [ />orgs/qli/]
58. Bliley AV, Ferrans CE: Quality of life after coronary angioplasty.
Heart Lung 1993, 22:193-199.
59. Fougeyrollas P, Noreau L: Assessment of Life Habits, General Short Form
(Life-H 3.0) Lac St-Charles, Quebec, Canada, International Network
on the Disability Creation Process; Canadian Society for the Interna-
tional Classification of Impairments, Disabilities and Handicaps; 1998.
60. Desrosiers J, Rochette A, Noreau L, Bourbonnais D, Bravo G, Bour-
get A: Long-term changes in participation after stroke. Top
Stroke Rehabil 2006, 13:86-96.
61. Noreau L, Desrosiers J, Robichaud L, Fougeyrollas P, Rochette A, Vis-
cogliosi C: Measuring social participation: Reliability of the
LIFE-H in older adults with disabilities. Disabil Rehabil 2004,
26:346-352.
62. Fougeyrollas P, Noreau L, St-Michel G, Boschen K: Measure of the
quality of the environment, Version 2.0 Lac St-Charles, Québec, Canada,
International Network of the Disability Creation Process; Canadian
Society for the International Classification of Impairments, Disabilities
and Handicaps; 1999.
63. Boschen K, Noreau L, Fougeyrollas P: Reliability studies of the Measure
of the Quality of the Environment (MEQ) Québec, 1er congrès du réseau
provincial de recherche en adaptation-réadaptation; 1998.
64. Blixen CE, Kippes C: Depression, social support, and quality of
life in older adults with osteoarthritis. mage J Nurs Sch 1999,
31:221-226.
65. Kemp BJ, Adams BM, Campbell ML: Depression and life satisfac-
tion in aging polio survivors versus age-matched controls:
relation to postpolio syndrome, family functioning, and atti-
tude toward disability. Disabil Rehabil 1997, 78:187-192.
66. De Haan R, Horn J, Limburg M, Meulen J Van Der, Bossuyt P: A com-
parison of five stroke scales with measures of disability,
handicap, and quality of life. Stroke 1993, 24:1178-1181.
67. Wilkie R, Peat G, Thomas E, Croft P: Factors associated with par-
ticipation restriction in community-dwelling adults aged 50
years and over. Qual Life Res 2007, 16:1147-1156.
68. Imrie R, Kumar M: Focusing on disability and access in the built
environment. Disabil Soc 1998, 13:357-374.
69. Pierce C, Richards J, Gordon W, Tate D: Life satisfaction follow-
ing spinal cord injury and the WHO model of functioning and
disability. SCI Psych Proc 1999, 12:124-127.
70. Dijkers M: Measuring quality of life. In Assessing medical rehabilita-
tion practices: the promise of outcomes research Edited by: Fuhrer MJ.
Baltimore, Maryland, Brookes Publishing Co; 1997:153-179.
Publish with BioMed Central and every
scientist can read your work free of charge
"BioMed Central will be the most significant development for
disseminating the results of biomedical research in our lifetime."
Sir Paul Nurse, Cancer Research UK
Your research papers will be:
available free of charge to the entire biomedical community
peer reviewed and published immediately upon acceptance
cited in PubMed and archived on PubMed Central
yours — you keep the copyright
Submit your manuscript here:
/>BioMedcentral
Health and Quality of Life Outcomes 2008, 6:30 />Page 11 of 11
(page number not for citation purposes)
71. Maguire GH: An exploratory study of the relationship of val-
ued activities to the life satisfaction of elderly persons. Occup
Ther J Res 1983, 3:164-172.
72. Tate DG, Roller S, Riley B: Quality of life for women with phys-
ical disabilities. Phys Med Rehabil Clin N Am 2001, 12:23-37.
73. McKinlay JB: The New Public Health Approach to Improving
Physical Activity and Autonomy in Older Populations. In
Preparation for Aging Edited by: Heikkinen E, Kuusinen J, Ruoppila I.
New York, Plenum Press; 1995:87-103.
74. Machin D, Campbell MJ, Fayers PM, Pinol APY: Sample size tables for
clinical studies Berlin, Germany, Blakewell Science Ltd; 1997.