Báo cáo hóa học: " Reliability and construct validity of the Participation in Life Activities Scale for children and adolescents with asthma: an instrument evaluation study" docx
Bạn đang xem bản rút gọn của tài liệu. Xem và tải ngay bản đầy đủ của tài liệu tại đây (304.8 KB, 10 trang )
BioMed Central
Page 1 of 10
(page number not for citation purposes)
Health and Quality of Life Outcomes
Open Access
Research
Reliability and construct validity of the Participation in Life
Activities Scale for children and adolescents with asthma: an
instrument evaluation study
Eileen K Kintner* and Alla Sikorskii
Address: Michigan State University College of Nursing, East Lansing, MI, USA
Email: Eileen K Kintner* - ; Alla Sikorskii -
* Corresponding author
Abstract
Background: The purpose of this study was to evaluate the reliability and construct validity of the
Participation in Life Activities Scale, an instrument designed to measure older school-age child and
early adolescent level of involvement in chosen pursuits.
Methods: A cross-sectional design was used. The convenience sample consisted of 313 school-
age children and early adolescents with asthma, ages 9–15 years. The self-report summative scale
of interest is a 3-indicator survey. Higher scores are reflective of higher levels of participation.
Internal consistency reliability and construct validity for the entire sample and sub groups of the
sample were evaluated.
Results: The instrument was deemed sound for the entire sample as well as sub groups based on
sex, race, age, socioeconomic status, and severity of illness. Cronbach's alpha coefficient for
internal consistency reliability for the entire sample was .74. Exploratory factor analysis indicated
a single component solution (loadings .79–.85) accounting for 66% of the explained variance.
Construct validity was established by testing the posed relationship between participation in life
activities scores and severity of illness. Confirmatory factor analysis revealed a good fit between
the data and specified model, χ
2
(10, n = 302) = 8.074, p = .62.
Conclusion: This instrument could be used (a) in clinical settings to diagnose restricted
participation in desired activities, guide decision-making about treatment plans to increase
participation, and motivate behavioral change in the management of asthma; and (b) in research
settings to explore factors influencing and consequences of restricted and unrestricted
participation, and as an outcome measure to evaluate the effectiveness of programs designed to
foster child and early adolescent management of asthma.
Background
Adolescents interviewed during a phenomenology study
shared that participation in self-selected life activities was
their primary motivator for behavioral change in coming
to accept asthma as a chronic condition requiring ongoing
monitoring and management [1]. Findings of the qualita-
tive study defined participation in life activities as one's
level of unrestricted involvement in chosen pursuits such
as sports, clubs, interests, and hobbies [1-4]. The Partici-
Published: 4 June 2008
Health and Quality of Life Outcomes 2008, 6:43 doi:10.1186/1477-7525-6-43
Received: 2 August 2007
Accepted: 4 June 2008
This article is available from: />© 2008 Kintner and Sikorskii; licensee BioMed Central Ltd.
This is an Open Access article distributed under the terms of the Creative Commons Attribution License ( />),
which permits unrestricted use, distribution, and reproduction in any medium, provided the original work is properly cited.
Health and Quality of Life Outcomes 2008, 6:43 />Page 2 of 10
(page number not for citation purposes)
pation in Life Activities Scale (PLA) [5] was developed to
measure the concept.
Indicators for this concept were isolated from themes and
statements extracted from the interviews to distinguish
participation in life activities from other related concepts
such as quality of life outcomes and domains of activity
limitations. The indicators addressed levels of (a) plan-
ning for participation in activities due to asthma, (b)
interference with participation, and (c) prevention from
participation. The PLA uses five activities for each indica-
tor. Activities are allowed to change over time as children
grow and develop because the activities are not as impor-
tant as the level of planning or restriction from participa-
tion believed to motivate changes in self management.
A copy of the instrument is provided elsewhere [5] along
with details about the scale's development including the-
oretical foundations; evaluation of face and content valid-
ity; and preliminary cross-group comparison of scores
based on sex, race, socioeconomic groupings, and severity
of illness ratings. Face and content validity of the qualita-
tively-derived and theoretically-based instrument were
determined to be highly acceptable and relevant by lay
and expert reviewers. The PLA was deemed appropriate,
useful, and applicable for both males and females ranging
in age from 9–15 years of African American (Black) and
Non-Hispanic Caucasian American (White) origins and
from varying socioeconomic backgrounds [5].
Purpose
The purpose of this paper is to report on internal consist-
ency reliability and construct validity of the Participation
in Life Activities Scale (PLA) for older school-age children
and early adolescents diagnosed with asthma. After relia-
bility and validity are demonstrated, healthcare profes-
sionals and researchers will be able to diagnose restricted
participation in desired activities, explore factors influenc-
ing participation, examine consequences of participation,
and evaluate efficacy of interventions to increase partici-
pation. Older school-age children and early adolescents
will hereafter be referred to as children.
Review of demographic and condition severity/control
considerations
When examining reliability and validity of the PLA, sex/
gender, race, age, and socioeconomic status should be
considered. Preliminary cross-group comparisons indi-
cated significant difference in PLA scores between males
and females, and lowest to highest socioeconomic groups
[5]. More research is needed to explore similarities and
differences in scores based on race between Black and
White Americans.
Demographic considerations
Asthma-related health statistics indicate that children,
ages 9–14 years, experience increase morbidity and mor-
tality over all other age groups, as do females over males,
members of Black over White American groups, and fam-
ilies of lower socioeconomic groups over middle or upper
groups [6-10]. Therefore, health disparities based on sex/
gender, race, age, and socioeconomic status, which may
influence participation in life activities, must be taken
into account when selecting, developing, and evaluating
instruments used for assessment purposes.
Condition severity/control considerations
Severity of asthma and level of symptom control greatly
impact level of participation in life activities [2-4] and
overall quality of life [11]. Due to stimuli exposure and
subsequent exacerbation of symptoms, children with
asthma are often restricted from participating in normal
everyday activities such as laughing with friends, swim-
ming in chlorinated pools, riding horses, playing with
pets, going to camp, eating certain foods, being indoor or
outdoor, exercising, and sleeping [11-17]. Without the use
of effective medical treatments and management tech-
niques to control symptoms, children may be limited by
the severity of their condition.
In preparation for instrument testing, severity of illness or
level of symptom control was hypothesized to be nega-
tively associated with participation in life activities. Sever-
ity of illness is defined as the relative difficulty, effort, or
struggle involved in controlling symptoms of one's
chronic condition. This concept was operationalized
through the use of the Severity of Illness Rating Scheme
[18].
In summary, the qualitatively-derived PLA scale, designed
to measure the adolescent identified outcome variable in
the process of coming to accept asthma as a chronic con-
dition is consistent with expert panel national guidelines
and outcome criteria for treatment and management of
childhood asthma [19]. Health statistics warrant examin-
ing psychometric properties of sub groups based on sex/
gender, race, age, socioeconomic status, and severity of ill-
ness. Literature supports the hypothesis that states severity
of illness is negatively associated with participation in life
activities.
Methods
Design
A cross-sectional design was used. Data from three studies
were combined to evaluate psychometric properties. The
studies were in full compliance with the Helsinki Declara-
tion and Health Insurance Portability and Accountability
Act (HIPAA) requirements. Prior to data collection,
human subjects' approvals were obtained through the
Health and Quality of Life Outcomes 2008, 6:43 />Page 3 of 10
(page number not for citation purposes)
University of Arizona Health Sciences Center Review
Board for subjects recruited primarily in Arizona (1995–
1996), the University of Michigan Health Sciences Institu-
tional Review Board for subjects recruited in Michigan
and Ohio (2001–2004), and Michigan State University
Biomedical Institutional Review Board for subjects
recruited in south-central Michigan (2005–2007). For all
studies, written consent from a parent or legal guardian
and assent from the child was obtained prior to data col-
lection.
Power analysis
In determining sample size for psychometric testing, the
number of items contained in the target instrument, sen-
sitivity of other instruments being used, and data analysis
techniques were considered. Based on equations provided
by Kim [20], 80% power for rejection of the proposed
confirmatory factor model using a Root-Mean-Square
Error of Approximation [21] of .05 and degrees of free-
dom required a minimum sample size of 214 subjects.
Sample
The convenience sample consisted of 313 children, ages
9–15 years (M = 11.53, SD = 1.62), who lived in northern
lower, south-eastern, and south-central Michigan (n = 14,
4.5%, n = 35, 11.1% and n = 153, 48.9%); southern Ari-
zona (n = 80, 25.6%); north-western Ohio (n = 27, 8.6%);
and central Oklahoma (n = 4, 1.3%).
In addition to 77 (24.6%) Black and 180 (57.5%) White
American participants, the following racial/ethnic groups
were represented: Asian American (n = 1), Latino/Mexi-
can/Hispanic American (n = 20), Middle Eastern Ameri-
can (n = 1), Mixed (n = 16), Native American (n = 8),
Other (n = 2), and Pacific Islander (n = 1) with other fam-
ilies (n = 7) not reporting.
Return rate
For the first two studies, of the 318 paper-and-pencil pack-
ets mailed, 219 (69%) were returned. For the third study,
of the 125 families approached, 107 were recruited, and
94 (88%) were enrolled and completed the surveys.
Data collection
Data were collected from children diagnosed with
asthma, ages 9–15 years, who were able to read and
understand English. Flyers advertising the studies were
offered to families through physicians' offices and
schools. Families interested in learning about the study
contacted the PI. After being informed of the purpose and
nature of the study, requirements and responsibilities of
subjects, and risks and benefits, families agreeing to par-
ticipate in the first two studies were mailed a question-
naire packet. For the third study, home visits were
scheduled for data to be collected using laptop computers.
All items were entered into a user-friendly data entry sys-
tem. The system was then audio-linked so that when par-
ticipants clicked on icons, items and response options
were read aloud in English.
Students completed the PLA. Parents/caregivers com-
pleted the General Health History Survey [2-4], and the
Severity of Illness Rating Scheme [18]. Families that
returned completed questionnaires were offered an award
of $5 for the first study, $10 for the second study, and $30
for the third study. For the first two studies, healthcare
providers who recruited eligible subjects were paid $5 per
family that returned completed questionnaires. For the
third study, school nurses were reimbursed for the time
they served as recruiters on the study.
Instruments
The Participation in Life Activities (PLA) scale is a 3-indi-
cator scale designed to measure level of unrestricted
involvement in chosen life activities [2-5]. Subjects are
asked to list their most favorite activities then answer three
activity-questions about each of them. Indicators meas-
ured by the activity-specific questions are cited below:
1. How much thinking about asthma is required when
planning for
participation in your favorite activities?
2. How much does asthma interfere with
participation in
your favorite activities?
3. How much does asthma prevent
participation in your
favorite activities?
Activity selection
Subjects may self-select anywhere from 1 to 5 or more
favorite activities. A list of activities categorized under fun
things to do as well as clubs, crafts, and sports is provided.
Subjects may choose from the list or select activities not
included on the list. Because participation in activities was
the prime motivator for behavioral change by adolescents
who were accepting of their asthma, having subjects select
their own activities is imperative. When children are not
vested in activities, then little will motivate the non-nor-
mative behavioral changes necessary for managing a
chronic condition. Although five spaces for activities are
provided on the survey form, the numbers and types of
activities are not as important as their motivating influ-
ences. Numbers and types of activities must also be
allowed to vary as children increase in complexity, differ-
entiation, and specialization; while increasing in hierar-
chical integration and organization [5]. The activities
serve as anchors for responding to three questions:
1. Do you need to think about asthma when planning to
participate in this activity?
Health and Quality of Life Outcomes 2008, 6:43 />Page 4 of 10
(page number not for citation purposes)
2. Does your asthma interfere with your participation in
this activity?
3. Does your asthma ever keep you from participating in
this activity?
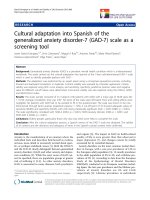
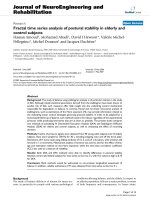
Scoring
Subjects receive 0 points for answering "YES" and 1 point
for answering "NO" to each of the activity-specific ques-
tions. Figure 1 offers an overview of scoring. Mean scores
are computed for each of the three indicators: planning
for participation, interference with participation, and pre-
vention from participation. Indicator scores can range
from 0–1 with higher scores reflective of less planning,
less interference, and less prevention or rather increased
participation. Since each indicator score is the mean
across five activities, the variables are considered approxi-
mately continuous. Computing the sum across all three
indicators completes scoring for the total scale. Total scale
scores have potential to range from 0–3 with higher scores
indicating greater participation in life activities.
Actual scores for all three indicators were in intervals rang-
ing from 0 to 1. The mean score of planning was .482 (SD
= .334), interference was .586 (SD = .320), and prevention
was .749 (SD = .313). Total PLA scores ranged from 0–3
(M = 1.816, SD = .785).
General Health History Survey is a 36-item survey com-
pleted by parents designed to collect demographic and
disease-related information [2-4]. Demographic informa-
tion reported here relates to sex/gender, race, age, and
socioeconomic status. Socioeconomic status was com-
puted using the Nam-Powers Socioeconomic Index Scores
(SEIS) by averaging parents' occupation and education
scores, and family income score [22]. SEIS scores have the
potential to range from 0–100. The SEIS has demon-
strated an extremely high degree of stability in status
scores with correlation coefficients of .97 over 10 years,
and .91 over 20 years [23]. The socioeconomic index
scores were grouped into two categories representing
lower to low middle (3–69) and upper middle to upper
(70–99) levels. Disease specific information reported here
includes a subjective measure of severity. Parents were
asked to classify if their child's asthma was mild, moder-
ate, or severe.
Severity of Illness Rating Scheme is a multidimensional, 4-
item instrument measuring severity of asthma tapping
both pathophysiological aspects and responses to the con-
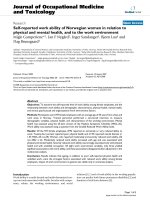
Scoring of the Participation in Life Activities Scale is completed by computing the mean scores for each of the three indicators before summing the indicator scoresFigure 1
Scoring of the Participation in Life Activities Scale is completed by computing the mean scores for each of the
three indicators before summing the indicator scores.
Indicator A = Planning for Participation
Compute Mean of Questions 1a, 2a, 3a, 4a, 5a
Scores Range: 0-1
+
Indicator B = Interference with Participation
Compute Mean of Questions 1b, 2b, 3b, 4b, 5b
Scores Range: 0 -1
Indicator C = Prevention from Participation
Compute Mean of Questions 1c, 2c, 3c, 4c, 5c
Scores Range: 0-1
+
Summing of Indicators A, B, and C
completes scoring for the PLA Scale
Total Scores Range: 0-3
Question 1a: Planning for Participation 1
Question 1b: Interference with Participation 1
Question 1c: Prevention from Participation 1
Question 2a: Planning for Participation 2
Question 2b: Interference with Participation 2
Question 2c: Prevention from Participation 2
Question 3a: Planning for Participation 3
Question 3b: Interference with Participation 3
Question 3c: Prevention from Participation 3
Question 4a: Planning for Participation 4
Question 4b: Interference with Participation 4
Question 4c: Prevention from Participation 4
Question 5a: Planning for Participation 5
Question 5b: Interference with Participation 5
Question 5c: Prevention from Participation 5
Health and Quality of Life Outcomes 2008, 6:43 />Page 5 of 10
(page number not for citation purposes)
dition. The scale uses amounts and types of medication
necessary to control symptoms in combination with fre-
quency of sleep and activity disturbance to form a summa-
tive composite score. Scores range from 4–12 with higher
scores indicating higher severity. Concurrent validity was
supported with significant correlations with parents' per-
ceptions of their children's health status, school attend-
ance records, and number of medical visits and
hospitalizations. Scores for this sample ranged from 4–12
(M = 6.01, SD = 1.81). With item-to-total correlations of
.39–.44, the standardized Cronbach's alpha reliability
coefficient for internal consistency for the combined sam-
ple was lower than anticipated at .66, possibly due to the
low item count.
Data analysis
Descriptive statistics were computed for all measures.
Internal consistency reliability was assessed using Cron-
bach's alpha coefficient and item-to-total correlations.
Because the PLA was developed for use in heterogeneous
populations, reliability and construct validity assessments
were conducted on the entire sample as well as sub groups
based on sex, race, age grouping, family's socioeconomic
status, and severity of illness.
Construct validity
Construct validity was evaluated using exploratory factor
analyses of the three continuous PLA item indicators for
the entire sample and sub groups. To obtain evidence of
concurrent validity, the Pearson's correlation coefficient
between PLA score and SIRS score was computed. Con-
firmatory factor analysis with 2 factors, PLA (defined by 3
continuous indicators), and SIRS (defined by 4 categori-
cal/ordinal indicators) and a path from SIRS to PLA was
carried out using weighted least squares method appropri-
ate for ordinal categorical indicators [24]. Root Mean
Square Error of Approximation (RMSEA) and Compara-
tive Fit Index (CFI) were assessed [25]. In addition, chi-
square test was used to evaluate model fit.
Internal consistency reliability analyses and exploratory
factor analyses were conducted in SPSS for Windows
14.0.2 [26]. Confirmatory factor analysis was imple-
mented using Mplus software [27].
Results
Internal consistency reliability
With strong corrected item-to-total correlations (r = .52–
.63), the standardized Cronbach's alpha reliability coeffi-
cient for internal consistency of the Participation in Life
Activity (PLA) Scale for this sample (N = 304) was .74.
Tables 1, 2, 3, 4, 5, 6 and 7 present scale item/indicator
summaries citing the number of subjects, corrected item-
to-total correlations, and alpha-if-item-deleted for the
combined sample as well as selected sub groups based on
sex/gender, race, age, socioeconomic status, and severity
of illness.
Construct validity
Exploratory factor analysis
The principal components extraction method from the
covariance matrix with no rotation was used for explora-
tory factor analyses. The eigenvalues and scree plot indi-
cated a single component solution (loadings .80, .85, and
.79 respectively) accounting for 66% of the explained var-
iance. Tables 1, 2, 3, 4, 5, 6 and 7 present an overall scale
summary citing Kaiser-Meyer-Olkin (KMO) Measures,
component loadings, and percent of variance explained
for the combined sample as well as selected sub groups
based on sex/gender, race, age, socioeconomic status, and
severity of illness.
Concurrent validity
Participation in life activities was negatively associated
with severity of illness (r = 24, p = .000).
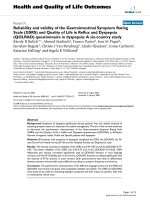
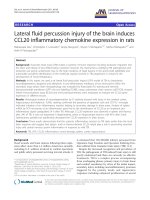
Confirmatory factor analysis
The model estimation terminated normally and resulted
in chi-square p-value of .62 for the test of model fit. The
values of RMSEA < .001 and CFI of 1.00 were also indica-
tive of good fit of the model. Factor loadings for each indi-
cator were significant, and presented in Figure 2. The
association between the two factors was significant as
reflected by the standardized coefficient of 39, p = < .001.
Table 1: Item Summary, Internal Consistency Reliability, and Results of Exploratory Factor Analysis for the Entire Sample (N = 304)
Internal Consistence Reliability Factor Analysis Principal Components
MSD Item to Total
Correlation
Scale Alpha & if Item
Deleted
KMO Sampling
Adequacy
Rescaled Factor
Loading (PC)
Rescaled Amount of
Variance Explained
PLA 1.816 .785 - .741 .670 - 65.8
Planning for .482 .334 .52 .716 - .797 -
Interference
with
.586 .320 .63 .583 - .846 -
Prevention
from
.749 .313 .56 .662 - .791 -
Health and Quality of Life Outcomes 2008, 6:43 />Page 6 of 10
(page number not for citation purposes)
Discussion
Psychometric evaluation of the qualitatively-derived and
theory-guided PLA scale for children and adolescents with
asthma demonstrated internal consistency reliability and
construct validity based on exploratory and confirmatory
factor analysis techniques for the combined sample as
well as sub samples represented by sex/gender, race, age,
socioeconomic status, and severity of illness. Preliminary
cross-group comparisons in PLA mean scores indicated
significant differences based on sex/gender and socioeco-
nomic group. Background literature suggested that health
disparities related to age, race, and severity of condition as
well as sex and socioeconomic status could impact scores
and should therefore be considered when evaluating the
instrument.
Overall reliability for this newly developed, 3-indicator
instrument was good. Corrected item-to-total corrections
for the entire scale as well as various sub groups were more
than adequate. Cronbach's alpha coefficient for internal
consistency reliability was higher for younger than older
children, females than males, Black than White Ameri-
cans, and children with reported more severe conditions
than those with less severe conditions, although not to a
degree that would engender barriers for use.
Exploratory and confirmatory factor analyses revealed
similar findings for construct validity with regard to com-
ponent and factor loadings. Percent variance explained
was higher for younger than older children, females than
males, Black than White Americans, and children with
reported more severe conditions than those with less
severe conditions. Reliability and validity based on
Table 2: Item Summary, Internal Consistency Reliability, and Results of Exploratory Factor Analysis for Females (n = 147) and Males (n
= 157)
Internal Consistence Reliability Factor Analysis Principal Components
MSD Item to Total
Correlation
Scale Alpha & if Item
Deleted
KMO Sampling
Adequacy
Rescaled Factor
Loading (PC)
Rescaled Amount of
Variance Explained
Females PLA 1.707 .817 - .770 .691 - 68.4
Planning for .478 .337 .58 .718 - .824 -
Interference
with
.551 .333 .65 .641 - .858 -
Prevention
from
.678 .317 .59 .707 - .798 -
Males PLA 1.919 .742 - .711 .653 - 63.2
Planning for .486 .332 .46 .701 - .796 -
Interference
with
.618 .306 .59 .534 - .826 -
Prevention
from
.815 .295 .53 .615 - .762 -
Table 3: Item Summary, Internal Consistency Reliability, and Results of Exploratory Factor Analysis for Black Americans (n = 69) and
White Americans (n = 177)
Internal Consistence Reliability Factor Analysis Principal Components
MSD Item to Total
Correlation
Scale Alpha & if Item
Deleted
KMO Sampling
Adequacy
Rescaled Factor
Loading (PC)
Rescaled Amount of
Variance Explained
Black PLA 1.737 .914 - .823 .704 - 73.8
Planning for .491 .362 .62 .814 - .828 -
Interference
with
.549 .336 .72 .716 - .867 -
Prevention
from
.696 .366 .70 .730 - .883 -
White PLA 1.929 .716 - .685 .646 - 60.7
Planning for .495 .334 .49 .601 - .851 -
Interference
with
.636 .301 .57 .497 - .818 -
Prevention
from
.798 .277 .44 .658 - .665 -
Health and Quality of Life Outcomes 2008, 6:43 />Page 7 of 10
(page number not for citation purposes)
exploratory factor analysis did not appear to vary between
groups based on socioeconomic status. Concurrent valid-
ity was supported by associations between participation
in life activities and severity of illness with statistically sig-
nificant correlation and path coefficients.
Psychometric and clinimetric evaluation using test-retest
and pre- to post-test assessment techniques are needed to
provide information about stability and change in scores
over time. Having a parent or caregiver complete the same
form would offer an indication of inter-rater reliability for
equivalence. Comparisons of contrasting groups and
investigations of associations with measures of related
constructs could offer additional support for validity. For
example, comparing scores for children classified with
mild intermittent verses severe persistent disease, and
comparing scores and psychometric evaluation of this
instrument with the activity limitation and physical func-
tioning items of the Pediatric Asthma Quality of Life
Questionnaire (PAQLQ) [28] and Pediatric Quality of Life
Inventory™ Generic Core Scales & Asthma Module (Ped-
sQL™) [29] could be enlightening.
Adolescents with asthma identified unrestricted participa-
tion in life activities as their prime motivator for behavio-
ral change in coming to accept asthma as a chronic
condition requiring ongoing monitoring and manage-
ment. Evidence indicates that for this target age group,
support from healthcare professionals, parents, caregivers,
and best friends fosters participation in life activities [2,3]
and consequently, participation in life activities enriches
psychosocial outcomes such as self-perception of athletic
Table 4: Item Summary, Internal Consistency Reliability, and Results of Exploratory Factor Analysis for Students Ages 9–11 years (n =
162) and 12–15 years (n = 142)
Internal Consistence Reliability Factor Analysis Principal Components
MSD Item to Total
Correlation
Scale Alpha & if Item
Deleted
KMO Sampling
Adequacy
Rescaled Factor
Loading (PC)
Rescaled Amount of
Variance Explained
Ages 9–11 PLA 1.767 .802 - .768 .680 - 68.4
Planning for .475 .326 .57 .726 - .806 -
Interference
with
.570 .320 .66 .616 - .862 -
Prevention
from
.722 .324 .58 .716 - .810 -
Ages 12–15
PLA
1.872 .764 - .708 .655 - 62.8
Planning for .490 .344 .46 .699 - .796 -
Interference
with
.603 .320 .58 .542 - .823 -
Prevention
from
.779 .299 .54 .598 - .759 -
Table 5: Item Summary, Internal Consistency Reliability, and Results of Exploratory Factor Analysis for Socioeconomic Scores
reflective of Lower to Low middle (n = 170) and Upper middle to Upper (n = 133) levels
Internal Consistence Reliability Factor Analysis Principal Components
MSD Item to Total
Correlation
Scale Alpha & if Item
Deleted
KMO Sampling
Adequacy
Rescaled Factor
Loading (PC)
Rescaled Amount of
Variance Explained
Lower (3–69)
PLA
1.719 .816 - .739 .657 - 65.8
Planning for .439 .341 .473 .756 - .747 -
Interference
with
.560 .335 .605 .602 - .841 -
Prevention
from
.720 .331 .616 .589 - .843 -
Upper (70–99)
PLA
1.951 .718 - .721 .633 - 65.2
Planning for .541 .316 .554 .621 - .852 -
Interference
with
.621 .298 .640 .511 - .865 -
Prevention
from
.790 .282 .444 .743 - .672 -
Health and Quality of Life Outcomes 2008, 6:43 />Page 8 of 10
(page number not for citation purposes)
competence, physical appearance, social acceptance, and
global self-worth, as well as perceived social support from
classmates and schoolteachers [2,3].
Visual inspection of scores indicates that a large number
of the subjects who were more restricted in participation
selected physically challenging sports activities; whereas
subjects who scored higher in participation tended to
select more sedentary activities. From a lifespan develop-
ment perspective, exploring whether or not experiences
with asthma influence lifestyle choices is of particular
interest. We considered coding favorite activities by level
of exposure to potential stimuli as low, moderate, or high
risk for exacerbation of symptoms. However, coding activ-
ities is complicated when individuals report that reading
is a risk when exposed to news print or dusty books, going
to the mall is a risk due to strong scents or perfumes, talk-
ing on the phone is a risk when laughing with friends, and
sleeping at night is a risk without pillow and mattress pro-
tectors. Coding for levels of exposure to capture any one
individual's specific stimuli and risk of symptom exacer-
bation would be challenging, especially when not all
stimuli are known or clearly identified by children and
their caregivers.
The PLA could be used by health care professionals in
clinical settings to (a) diagnose restricted participation in
favorite activities, (b) guide decision-making about treat-
ment plans to increase participation, and (c) motivate
behavioral change in the ongoing monitoring and man-
agement of asthma. The instrument could also be used (a)
to explore factors influencing and consequences of
restricted and unrestricted participation and (b) as an out-
come measure to evaluate the effectiveness of theory-
guided, research-based programs designed to foster
Table 6: Item Summary, Internal Consistency Reliability, and Results of Exploratory Factor Analysis for Parent Perception of
Condition Severity as Mild (n = 137) and Moderate to Severe (n = 163)
Internal Consistence Reliability Factor Analysis Principal Components
MSD Item to Total
Correlation
Scale Alpha & if Item
Deleted
KMO Sampling
Adequacy
Rescaled Factor
Loading (PC)
Rescaled Amount of
Variance Explained
Mild PLA 1.974 .772 - .709 .663 - 62.6
Planning for .538 .354 .481 .674 - .824 -
Interference
with
.631 .329 .573 .546 - .824 -
Prevention
from
.804 .288 .523 .619 - .720 -
More Severe
PLA
1.694 .777 - .758 .672 - 67.5
Planning for .441 .310 .527 .740 - .762 -
Interference
with
.553 .310 .655 .597 - .855 -
Prevention
from
.670 .328 .538 .681 - .842 -
Table 7: Item Summary, Internal Consistency Reliability, and Results of Exploratory Factor Analysis for Severity of Illness Rating
Scores (SIRS) reflective of Mild (n = 150) and Moderate to Severe (n = 153)
Internal Consistence Reliability Factor Analysis Principal Components
MSD Item to Total
Correlation
Scale Alpha & if Item
Deleted
KMO Sampling
Adequacy
Rescaled Factor
Loading (PC)
Rescaled Amount of
Variance Explained
SIRS (4–5) PLA 1.989 .740 - .689 .660 - 60.7
Planning for .542 .349 .50 .598 - .858 -
Interference
with
.635 .317 .55 .529 - .811 -
Prevention
from
.812 .274 .47 .641 - .654 -
SIRS (6–12) PLA 1.653 .794 - .764 .658 - 68.0
Planning for .424 .310 .50 .781 - .728 -
Interference
with
.541 .315 .68 .589 - .871 -
Prevention
from
.688 .338 .62 .663 - .867 -
Health and Quality of Life Outcomes 2008, 6:43 />Page 9 of 10
(page number not for citation purposes)
school-age child and early adolescent self-management of
their asthma.
Conclusion
Findings of this study provide evidence of internal consist-
ency reliability and construct validity of the PLA as a
measure of one aspect of quality of life for children and
adolescents with asthma.
List of abbreviations
PLA: Participation in Life Activities Scale; HIPAA: Health
Insurance Portability and Accountability Act; SEIS: Nam-
Powers Socioeconomic Index Scores; KMO: Kaiser-Meyer-
Olkin Measure; CFI: Comparative Fit Index; RMSEA: Root-
Mean-Square Error of Approximation; PAQLQ: Pediatric
Asthma Quality of Life Questionnaire; PedsQL™: Pediatric
Quality of Life Inventory™ Generic Core Scales and
Asthma Module.
Competing interests
The authors declare that they have no competing interests.
Authors' contributions
EK conceived of the study, served as Principal Investigator
overseeing all aspects of all three studies conducted to
obtain data, and performed the statistical analyses using
SPSS for Windows to obtain descriptive data as well as
internal consistency reliability and exploratory factor
analysis estimates. AS performed the statistical analysis
using Mplus to evaluate fit of the data to the hypothesized
model. Both authors read and approved the final manu-
script. The authors are solely responsible for the content
contained in this article.
Acknowledgements
This research study was funded in part by grants from the National Insti-
tutes of Health (Individual National Research Service Award #1 F31
NR06898-01 and #1 R21 NR009517-01 Staying Healthy-Asthma Responsi-
ble & Prepared) and a Faculty Grant from the University of Michigan Office
for Vice President for Research. The author wishes to thank all individuals
involved in the recruitment of subjects, and all participants for their time
and effort in completing the questionnaire booklets.
References
1. Kintner EK: Adolescent process of coming to accept asthma:
a phenomenological study. Journal of Asthma 1997,
34(6):547-561.
2. Kintner EK: Testing of the school-aged child and adolescent
acceptance of asthma model. Ph.d.: THE UNIVERSITY OF ARI-
ZONA; 1996.
3. Kintner EK: Lack of relationship between acceptance and
knowledge of asthma in school-age children and early adoles-
cents. Journal for Specialists in Pediatric Nursing 2004, 9(1):5-14.
4. Kintner EK: Testing the Acceptance of Asthma Model with
children and adolescents. Western Journal of Nursing Research
2007, 29(4):410-431.
5. Kintner EK: Development and preliminary evaluation of the
Participation in Life Activities Scale for children and adoles-
cents with asthma: an instrument development study. Health
& Quality of Life Outcomes 2008, 6(37):.
6. Boudreaux ED, Emond SD, Clark S, Camargo CA: Race/ethnicity
and asthma among children presenting to the emergency
department: differences in disease severity and manage-
ment. Pediatrics 2003, 111(5 Pt 1):e615-621.
7. Gwynn RC: Risk factors for asthma in US adults: results from
the 2000 Behavioral Risk Factor Surveillance System. Journal
of Asthma 2004, 41(1):91-98.
8. Mannino DM, Homa DM, Akinbami LJ, Moorman JE, Gwynn C, Redd
SC: Surveillance for asthma–United States, 1980–1999. Morb
Mortal Wkly Rep Surveill Summ 2002, 51(1):1-13.
9. Mo F, Robinson C, Choi BC, Li FC: Analysis of prevalence, trig-
gers, risk factors and the related socio-economic effects of
childhood asthma in the Student Lung Health Survey
(SLHS) database, Canada 1996. Int J Adolesc Med Health 2003,
15(4):349-358.
10. Simon PA, Zeng Z, Wold CM, Haddock W, Fielding JE: Prevalence
of childhood asthma and associated morbidity in Los Ange-
les County: impacts of race/ethnicity and income. Journal of
Asthma 2003, 40(5):535-543.
11. Diette GB, Markson L, Skinner EA, Nguyen TT, Algatt-Bergstrom P,
Wu AW:
Nocturnal asthma in children affects school attend-
ance, school performance, and parents' work attendance.
Arch Pediatr Adolesc Med 2000, 154(9):923-928.
12. Bernard A, Carbonnelle S, Michel O, Higuet S, De Burbure C, Buchet
JP, Hermans C, Dumont X, Doyle I: Lung hyperpermeability and
asthma prevalence in schoolchildren: unexpected associa-
tions with the attendance at indoor chlorinated swimming
pools. Occup Environ Med 2003, 60(6):385-394.
13. Bloch JR: Camp nursing: can children with asthma safely
attend a regular outdoor day camp? Pediatr Nurs 2001,
27(5):463-468.
14. Caffarelli C, Deriu FM, Terzi V, Perrone F, De Angelis G, Atherton
DJ: Gastrointestinal symptoms in patients with asthma. Arch
Dis Child 2000, 82(2):131-135.
15. Dales RE, Cakmak S, Judek S, Dann T, Coates F, Brook JR, Burnett
RT: Influence of outdoor aeroallergens on hospitalization for
asthma in Canada. J Allergy Clin Immunol 2004, 113(2):303-306.
16. Leaderer BP, Belanger K, Triche E, Holford T, Gold DR, Kim Y,
Jankun T, Ren P, McSharry Je JE, Platts-Mills TA, Chapman MD,
Bracken MB: Dust mite, cockroach, cat, and dog allergen con-
The Confirmatory Factor Model for Participation in Life Activity Scale and Severity of Illness Rating Scheme indicates goodness of fit between the data and the specified modelFigure 2
The Confirmatory Factor Model for Participation in
Life Activity Scale and Severity of Illness Rating
Scheme indicates goodness of fit between the data
and the specified model.
Ȥ n p
p
Publish with BioMed Central and every
scientist can read your work free of charge
"BioMed Central will be the most significant development for
disseminating the results of biomedical research in our lifetime."
Sir Paul Nurse, Cancer Research UK
Your research papers will be:
available free of charge to the entire biomedical community
peer reviewed and published immediately upon acceptance
cited in PubMed and archived on PubMed Central
yours — you keep the copyright
Submit your manuscript here:
/>BioMedcentral
Health and Quality of Life Outcomes 2008, 6:43 />Page 10 of 10
(page number not for citation purposes)
centrations in homes of asthmatic children in the northeast-
ern United States: impact of socioeconomic factors and
population density. Environ Health Perspect 2002, 110(4):419-425.
17. Liangas G, Morton JR, Henry RL: Mirth-triggered asthma: is
laughter really the best medicine? Pediatr Pulmonol 2003,
36(2):107-112.
18. Kieckhefer GM: Testing self-perception of health theory to
predict health promotion and illness management behavior
in children with asthma. Journal of Pediatric Nursing 1987,
2(6):381-391.
19. National Institutes of Health; National Heart, Lung, and
Blood Institute Expert panel report 3: Guidelines for diagno-
sis and management of asthma [ />lines/asthma/asthgdln.htm]
20. Kim KH: The relation among fit indexes, power, and sample
size in structural equation modeling. Structural Equation Mode-
ling 2005, 12:368-390.
21. Steiger JJ, Shapiro A, Browne MW: On the multivariate asymp-
totic distribution of sequential chi-square tests. Psychometrika
1985, 50:253-264.
22. Nam CB, Powers MG: The socioeconomic approach to status
measurement. Houston, TX: Cap & Gown Press; 1983.
23. Miller DC: Handbook of research design and social measure-
ment. 5th edition. Newbury Park, CA: SAGE Publications, Inc; 1991.
24. Muthen B: A general structural equation model with dichoto-
mos, ordered categorical, and continuous latent variable
indicators. Psychometrica 1984, 49:115-132.
25. Bentler PM, Bonnett DG: EQS structural equations program
manual. Encino, CA: Multivariate Software; 1995.
26. SPSS: SPSS 14.0 for Windows. Chicago: SPSS Inc 2006.
27. Muthen LK, Muthen BO: Mplus User's Guide. 4th edition. Los
Angeles, CA: Muthen & Muthen; 2007.
28. Juniper EF, Guyatt GH, Feeny DH, Ferrie PJ, Griffith LE, Townsend M:
Measuring quality of life in children with asthma. Qual Life Res
1996, 5(1):35-46.
29. Varni JW, Burwinkle TM, Rapoff MA, Kamps JL, Olson N: The Ped-
sQL™ in pediatric asthma: Reliability and validity of the
Pediatric Quality of Life Inventory™ Generic Core Scales
and Asthma Module. Journal of Behavioral Medicine 2004,
27(3):297-318.