Báo cáo sinh học: "Mechanism-related circulating proteins as biomarkers for clinical outcome in patients with unresectable hepatocellular carcinoma receiving sunitinib" potx
Bạn đang xem bản rút gọn của tài liệu. Xem và tải ngay bản đầy đủ của tài liệu tại đây (723.09 KB, 14 trang )
RESEARCH Open Access
Mechanism-related circulating proteins as
biomarkers for clinical outcome in patients with
unresectable hepatocellular carcinoma receiving
sunitinib
Charles S Harmon
1*
, Samuel E DePrimo
1,9
, Eric Raymond
2
, Ann-Lii Cheng
3
, Eveline Boucher
4
, Jean-Yves Douillard
5
,
Ho Y Lim
6
, Jun S Kim
7
, Maria José Lechuga
8
, Silvana Lanzalone
8
, Xun Lin
1
and Sandrine Faivre
2
Abstract
Background: Several proteins that promote angiogenesis are overexpressed in hepatocellular carcinoma (HCC) and
have been implicated in disease pathogenesis. Sunitinib has antiangiogenic activity and is an oral multitargeted
inhibitor of vascular endothelial growth factor receptors (VEGFRs)-1, -2, and -3, platelet-derived growth factor
receptors (PDGFRs)-a and -b, stem-cell factor receptor (KIT), and other tyrosine kinases. In a phase II study of
sunitinib in advanced HCC, we evaluated the plasma pharmacodynamics of five proteins related to the mechanism
of action of sunitinib and explored potential correlations with clinical outcome.
Methods: Patients with advanced HCC received a starting dose of sunitinib 50 mg/day administered orally for
4 weeks on treatment, followed by 2 weeks off treatment. Plasma samples from 37 patients were obtained at
baseline and during treatment and were analyzed for vascular endothelial growth factor (VEGF)-A, VEGF-C, soluble
VEGFR-2 (sVEGFR-2), soluble VEGFR-3 (sVEGFR-3), and soluble KIT (sKIT).
Results: At the end of the first sunitinib treatment cycle, plasma VEGF-A levels were significantly in creased relative
to baseline, while levels of plasma VEGF-C, sVEGFR-2, sVEGFR-3, and sKIT were significantly decreased. Changes
from baseline in VEGF-A, sVEGFR-2, and sVEGFR-3, but not VEGF-C or sKIT, were partially or completely reversed
during the first 2-week off-treatment period. High levels of VEGF-C at baseline were significantly associated with
Response Evaluation Criteria in Solid Tumors (RECIST)-defined disease control, prolonged time to tumor progression
(TTP), and prolonged overall survival (OS). Baseline VEGF-C levels were an independent predictor of TTP by
multivariate analysis. Changes from baseline in VEGF-A and sKIT at cycle 1 day 14 or cycle 2 day 28, and change in
VEGF-C at the end of the first off-treatment period, were significantly associated with both TTP and OS, while
change in sVEGFR-2 at cycle 1 day 28 was an independent predictor of OS.
Conclusions: Baseline plasma VEGF-C levels predicted disease control (based on RECIST) and were positively
associated with both TTP and OS in this exploratory analysis, suggesting that this VEGF family member may have
utility in predicting clinical outcome in patients with HCC who receive sunitinib.
Trial registration: ClinicalTrials.gov: NCT00247676
* Correspondence:
1
Pfizer Oncology, La Jolla, CA, USA
Full list of author information is available at the end of the article
Harmon et al. Journal of Translational Medicine 2011, 9:120
/>© 2011 H armon et al; licensee BioMed Central Ltd. This is an Open Access articl e distributed under the terms of the Creative Commons
Attribution License (http://creativecom mons.org/licenses/by/2.0), which permits unrestricted use , distribution, and reproduction in
any medium, provided the original work is properl y cited.
Background
Hepatocellular carcinomas (HCCs) overexpress several
angiogenic proteins, including vascular endothelial
growth factor-A (VEGF-A) [1-3], VEGF-D [4], and pla-
telet-derived endothelial gr owth factor (PDGF) [2], as
well as expressing receptors to these ligands (comprising
VEGF receptors [VEGFRs]-1, -2 [5], and -3 [4]). Tumor
expression of VEGF-A increases progressively during
development of HCC from low-grade dysplastic nodules,
and VEGF-A expression correlates with microvessel
density during HCC development [6]. High serum levels
of VEGF-A [7] and basic fibroblast growth factor [8]
have been associated with poor clinical outcome in
HCC [8], and VEGF-A polymorphisms have been asso-
ciated with prognosis [9]. The hepatitis B virus X pro-
tein (HBx) is expressed in HBV-infected cells and
enhances VEGF-A expression by stabilizing the tran-
scription factor HIF-1a through inhibition of HIF-1a
binding to VHL [10]. These and other findings strongly
implicate angiogenesis in the pathophysiology of HCC
(reviewed in [5]).
The development of sorafenib has set a precedent for
the use of targeted antiangiogenic therapy in advanced
HCC [11,12]. Sunitinib, an oral multitargeted tyrosine
kinase inhibitor with antiangiogenic activity in vivo,has
been investigated in advanced HCC within several phase
II trials [13-15], and a phase III trial comparing sunitinib
with sorafenib has recently been halted due to futility and
an increased incidence of serious adverse events in the
sunitinib versus t he sorafenib arm. Sunitinib inhibits
VEGFRs-1, -2, and -3, PDGFRs -a and -b,stemcellfac-
tor receptor (KIT), glial cell line-derived neurotrophic
factor receptor (REarranged during Transfection; RET),
colony-stimulating factor 1 receptor (CSF-1R), and FMS-
like tyrosine kinase 3 (FLT3) [16-21]. The antiangiogenic
activity of sunitinib likely results from inhibition of
VEGFRs on endothelial cells and PDGFR-b on stroma l
cells.
Biomarkers of angiogenesis and tumor proliferation are
often used to demonstrate the pharmacodynamic effects
of therapeutic agents, but also h ave the potential to p lay
a role in predicting which patients are likely to benefit
from a particular treat ment. Soluble fo rms of proteins
involved in tumor-cell proliferation (e.g. soluble stem-cell
factor receptor [sKIT]) or tumor angiogenesis (such as
VEGF-A, VEGF-C, soluble VEGFR-2 [sVEGFR-2], and
soluble VEGFR-3 [sVEGFR-3]) can be rapidly and readily
measured in serum or plasma samples by highly specific
enzyme-linked immunosorbant assays (ELISAs). If suffi-
ciently sensitive and specific, associations between bio-
marker levels and clinical outcome could offer practical
benefits, both for refining clinical research and for clini-
cal decision-making.
A phase II study of sunitinib 50 mg/day on Schedule
4/2 (4 weeks on treatment, followed by 2 weeks off treat-
ment) in 37 patients with advanced HCC was recently
reported by Faivre et al. [14]. Although this trial did not
meet its primary endpoint based on Response Eval uation
Criteri a in Solid Tumo rs (RECIST), secondary endpoints
were indicative of clinical activity in this population.
Median time to tumor progression (TTP) and overall
survival (OS) we re 5.3 and 8.0 months, respectively. Dis-
ease control rate (partial response or stable disease > 3
months) was 37.8%. In the preliminary analyses pre-
viously reported by Faivre et al., patients with baseline
VEGF-C levels above the median achieved significantly
lon ger TTP and OS, as well as impro ved diseas e control,
compared with patients with low VEGF-C levels. This
trial also investigated potential correlations between clin-
ical outcome and other soluble proteins that are directly
related to the mechanism of action of sunitinib and are
associated with angiogenesis or tumor proliferation
(VEGF-A, sVEGFR-2, sVEGFR-3, and sKIT). Here we
report a detailed explora tory analysis of the pharmacody-
namics and predictive value of these sunitinib target-
related plasma proteins.
Patients and methods
Study design
This was a single-arm, open-label, multicenter p hase II
trial conducted in Europe and Asia (http://Clinicaltrials.
gov identifier: NCT00247676). The study design and
methods are reported in full in the primary publication
of efficacy and safety data from the study [14] and sum-
marized below.
Eligible patients were aged > 18 years with histologically
proven HCC not amenable to curative surgery and a life
expectancy of at least 3 months. Key inclusion criteria
were: measurable disease according to RECIST [22];
Child- Pugh A or B status; Eastern Cooperative Oncology
Group (ECOG) performance status of 0 or 1; and adequate
liver, renal, and hematologic function. A minimum of 4
weeks was required between local therapy and disease pro-
gression for patients with recurrent or progressive disease,
with resolution of all acute toxic effects of local treatment
to National Cancer Institute (NCI) Common Terminology
Criteria for Adve rse Events (CTCAE version 3.0) grade ≤
1 before study enrollment. Patients with previous systemic
therapy for HCC were excluded. All patients provided
written informed consent, and the study was conducted in
accordance with International Conference on Harmoniza-
tion Good Clinical Practice guidelines, the Declaration of
Helsinki (1996), and applicable local regulatory require-
ments and laws.
Patients received a starting dose of sunitinib 50 mg/day
administered orally on Schedule 4/2. Treatment continued
Harmon et al. Journal of Translational Medicine 2011, 9:120
/>Page 2 of 14
until disease progression, unacceptable toxicity or withdra-
wal of consent. The primary endpoint was objective
response rate; secondary objectives included evaluation of
TTP, OS, and safety, and exploration of soluble plasma
biomarkers. Tumor response or progr ession was assessed
using RECIS T. Changes in tumor density were evaluated
in post-hoc analyses [23]. Censoring for time-to-event
endpoints was based on RECIST guidelines [22].
Assessment of biomarkers
As specified in the protocol, plasma samples for analysis
of soluble proteins relevant to angiogenesis or tumor
proliferation were obtained prior to the first dose on
day 1, on day 14 and day 28 of cycle 1, on day 1 and
day 28 of cycle 2, and on day 28 of cycl e 5. The plasma
samples were stored at -70°C until required for analysis.
The length of storage time for the majority of samples
was within the supported stability data generated during
assay validation. For the samples assayed outside of their
established stability, additional storage stability was eval-
uated at a later date to cover the duration of sample
storage.
Sodium heparin plasma samples were assayed for
VEGF-A, VEGF-C, sVEGFR-2, sVEG FR-3, and sKIT
using validated, quantitative sandwich immunoassay
ELISA kits or kit components (R&D Systems, Minnea-
polis, MN). sVEGFR-2, sVEGFR-3, and sKIT were each
quantified with an ELISA that measured the extracellu-
lar (soluble) domain of these proteins [24]. All assays
were run under Good Laboratory Practice conditions,
and performance specifications of each ELISA were vali-
dated for their intended purpose. Assays were run
according to the manufacturer’s instructions, except in
the case of sVEGFR-3, where samples were diluted 1:10
rather than 1:100 to reduce the number of samples
below the limit of quantification.
Statistical analysis
VEGF-A, VEGF-C, sVEGFR-2, sVEG FR-3, and sKIT
were selected for evaluation based on their direct rele-
vance to sunitinib’s known molecular targets, on repro-
ducible plasma pharmacodynamics in sunitinib trials in
a number of tumor types, and on significant associations
with clinical outcome in a particular tumor type, e.g. an
association between sKIT reduction and OS in imatinib-
resistant gastrointestinal stromal tumor [24-31]. With
the exception of sKIT, each of these proteins has an
established or putative role in VEGF-related signaling
and angiogenic processes. The soluble protein analyses
described here therefore represent evaluations of indivi-
dual biomarker hypotheses and corrections for multiple
testing were not applied.
Biomarker data were summarized using descriptive
statistics. Soluble protein values that were missing at
time points prior to discontinuation were excluded from
the analysis. Levels of plasma proteins at baseline, and
ratios to baseline levels at indicated times, were assessed
for potential a ssociations with measures of clinical out-
come, including tumor response (RECIST), TTP, OS,
and tumor necrosis (density reduction). For the purpose
of assessing the significance of changes in plasma pro-
tein levels from those at base line, arithmeti c differences
(concentration at cycle X day Y - concentration at cy cle
1 day 1) were analyzed using the Wilcoxon signed-rank
test. Median time-to-event (TTP and OS) values were
esti mated using Kaplan-Meier curves, after stratification
by the medi an baseline plasma protein concentration or
by the median plasma protein ratio to baseline at each
time point. Potential correlations between soluble pro-
tein values and TTP or OS were analyzed using the Cox
proportional hazards model and the log-rank test. The
following applications were used for statistical analyses:
Excel 2003 (Microsoft) for descriptive statistics; Prism
5.01 (GraphPad Software Inc) for the Wilcoxon signed-
rank test, the Spearman rank correlation test, receiver
operating characteristic (ROC) analysis, Fisher’sexact
test, Kaplan-Meier estimation and the log-rank (Mantel-
Cox) test; and S-Plus 7.0 (Insightful) for univariate and
multivariate analysis using the Cox proportional hazards
model.
Results
Study population
Thirty-seven patients were enrolled and treate d in this
study. Baseline characteristics have been described in
full in the per-protocol report of this trial by Faivre and
colleagues [14]. The patient population was predomi-
nantly male (92%) with Child-Pugh class A liver func-
tion (84%), and all had ECOG performance status 0 or 1
(51% and 49%, respectively).
Changes in biomarker levels during sunitinib treatment
Plasma samples were obtained from all patients on study
(N = 37) at baseline and at regular time points until dis-
ease progression. For each soluble protein, there were
three missing values out of 157 possible data points
(1.91%), while no so luble protein values were missing at
baseline. At baseline, the median (range) concentration
of soluble proteins was: 54.9 (20.2-466.3) pg/mL for
VEGF-A, 822.2 (334.5-3,216.5) pg/mL for VEGF-C,
7,068 (4,572.5-13,667.5) pg/mL for sVEGFR-2, 48,700
(12,420-119,300) pg/mL for sVEGFR-3 and 41,960
(17,560-85,345) pg/mL for sKIT.
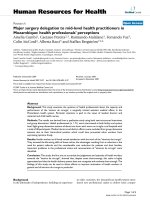
The median plasma level of each of the soluble pro-
teins studied changed in response to sunitinib dosing.
Significant changes from baseline in the median plasma
levels of soluble proteins VEGF-A and VEGF-C and
soluble recepto rs sVEGFR -2, sVEGFR-3, and sKIT were
Harmon et al. Journal of Translational Medicine 2011, 9:120
/>Page 3 of 14
observed at the end of the first 4 weeks of sunitinib
treatment (Figure 1). VEGF-A levels increased relative
to baseline at cycle 1 day 28, while levels of all other
proteins declined. The most marked changes were seen
in levels of VEGF-A, which increased by 193% above
baseline at cycle 1 day 28, and in sVEGFR-3, which
decreased by 78.1% at the same time point. Plasma
levels of sVEGFR-2 and sKIT decreased by 54.4% and
38.0%, respectively, at cycle 1 day 28. For VEGF-A,
sVEGFR-2, and sVEGFR-3, these chang es were partially
or completely reversed during the 2-week off-treatment
period, with levels returning to near baseline by the
start of cycle 2. In contrast, levels of VEGF-C and sKIT
declined progressively, w ith no return towards baseline
during the off-treatment period, before leveling off at
the end of cycle 2.
Patients with ≤ median levels of VEGF-C at baseline
had significantly lower median baseline VEGF-A (46.3
pg/mL) than patients with above-median baseline
VEGF-C (94.4 pg/mL; P = 0.0029), and baseline concen-
trations of VEGF-C and VEGF-A were moderately cor-
related by linear regression analysis (Spearman’sr=
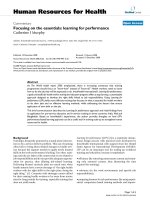
0.6098; P < 0.0001). In patients with ≤ median baseline
plasma VEGF-C levels, little or no change occurred in
plasma VEGF-C from baseline at any time on study,
whereas in patients with above-median VEGF-C at base-
line, a marked reduction in VEGF-C levels was observed
(Figure 2). Differences in VEGF-C ratios to baseline
were significant at all time points except cycle 1 day 14.
Low ( ≤ median) baseline VEGF-C levels were correlated
with elevated VEGF-A ratios to baseline at cycle 1 da y
14 (2.63 vs. 2.13, respectively; P = 0.0118), cycle 2 day 1
(1.27 vs. 0.86, respectively; P = 0.0163), and cycle 2 day
28 (5.12 vs. 1.43, respectively; P = 0.0014). No significant
differences were seen in changes from baseline for
sVEGFR-2, sVEGFR-3 or sKIT levels at any time point,
after stratification by median baseline VEGF-C.
Relationship between baseline biomarker levels and
tumor response
Based on RECIST a ssessment of tumor response (≥ 30 %
reduction in unidimensional tumor size), 1 patient
achieved a partial response (PR) and 13 had stable disease
(SD) for > 12 weeks, yielding a disease control rate (PR or
SD > 12 weeks) of 37.8% [14]. Thirteen patients (35.1%)
did not experience disease control (SD < 12 weeks or
progressive disease [PD]) and 10 patients were not evalu-
able. Analysis o f tumor response using the Choi criteria
(≥ 10% reduction in unidimensional tumor size or ≥ 15%
reduction in tumor density) [32] was performed in 26
patients, among whom 17 patients (65.4%) were respon-
ders and 9 were non-responders according to these cri-
teria. Table 1 and Additional File 1, Figure S1 show that
patients who experienced disease control by RECIST had
a significantly higher median baseline VEGF-C concen-
tration (1,416.5 pg/mL) than those without disease
control (741.5 pg/mL; P = 0.0027), with a trend
towards higher VEGF-C levels in Choi responders vs.
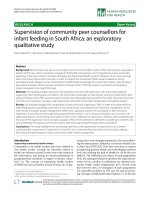
Figure 1 Plasma pharmacodynamics of soluble protein
biomarkers during treatment with sunitinib. (A) VEGF-A and
VEGF-C; (B) sKIT and sVEGFRs-2 and -3. C, cycle; D, day.
Figure 2 Plasma pharmacodynamics of VEGF-C in patients with
baseline VEGF-C levels above or below the median value of
822.2 pg/mL. C, cycle; D, day.
Harmon et al. Journal of Translational Medicine 2011, 9:120
/>Page 4 of 14
non-responders (P = 0.0662). For VEGF-A at baseline,
patients with and without disease control had median
baseline levels of 108.7 and 46.6 pg/mL, respect ively (P =
0.0332) and VEGF-A levels were also significantly ele-
vated in Choi responders (P = 0.0250). Baseline levels of
sVEGFR-2, sVEGFR-3, and sKIT did not differ signifi-
cantly when analyzed for disease control (RECIST) or by
Choi response.
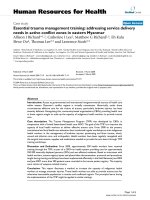
ROC analysis was performed on b aseline soluble pro-
tein levels as discriminators in predicting disease control
(PR or SD > 12 weeks) versus PD, as assessed by
RECIST (Figure 3). The soluble protein cut-point for
response discrimination was determined from the point
on the ROC curve having the minimum distance from
the point corresponding to sensitivity and specificity
values of 1.0. Contingency table analysis of data
obtained using the ROC curve-derived cut-points
revealed that baseline VEGF-C (cut-point: 942 pg/mL)
was the strongest predictor of disease control, with an
accuracy of 0.84 and relative risk of 4.71 (P = 0.0012),
followed by baseline VEGF-A (cut-point: 138 pg/mL)
with an accuracy of 0.72 and relative risk of 2.57 (P =
0.0078; Table 2). None of the soluble receptors
(sVEGFR -2, sVEGFR-3 or sKIT) were significant predic-
tors of disease control when analyzed at the ir ROC
curve-derived cut-points.
Table 1 Baseline soluble protein levels and ratios to baseline in patients stratified by clinical response (RECIST and
Choi criteria)
Soluble protein and time point RECIST Choi criteria
Disease control No disease control Rank sum
P-value
Responders Non-responders Rank sum
P-value
Median n Median n Median n Median n
VEGF-A
Baseline, pg/mL 108.7 14 46.6 13 0.0332* 92.7 17 51.9 9 0.0250*
C2D1:D1 0.861 14 1.132 8 0.0352* 0.861 14 1.105 6 0.0757
C2D28:D1 1.426 13 3.617 6 0.0874 1.639 12 3.63 3 0.5363
VEGF-C
Baseline, pg/mL 1,416.5 14 741.5 13 0.0027* 1058 17 774.8 9 0.0662
C1D28:D1 0.529 13 0.806 9 0.0708 0.595 15 1.121 7 0.0319*
C2D1:D1 0.596 14 0.947 8 0.0197* 0.5636 14 0.839 6 0.0256*
sVEGFR-3
C1D14:D1 0.352 14 0.622 12 0.031* 0.4857 17 0.613 9 0.4580
Disease control (RECIST) defined as complete or partial response or stable disease > 12 weeks; no disease control defined as stable disease < 12 weeks or
progressive disease.
*Significant at the 0.05 level.
C, cycle; D, day.
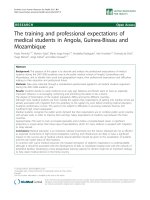
Figure 3 Receiver operating characteristic (ROC) curves for prediction of disease control (partial response [PR] or stable disease [SD] >
12 weeks) by baseline level of soluble protein. Arrows indicate ROC curve-derived cut-points.
Harmon et al. Journal of Translational Medicine 2011, 9:120
/>Page 5 of 14
Relationship between change from baseline in biomarker
levels and tumor response
Changes from baseline in levels of soluble proteins dur-
ing the first two cycles of treatment were also compared
between patients with and without disease control
(RECIST). For VEGF-C and VEGF-A, a significant dif-
ference in change from baseline between patients with
and without disease control was observed on cycle 2 day
1(P < 0.05; Table 1). A reduction from baseline in med-
ian levels o f each marker was seen in patients with dis-
ease control at this time point, compared with little
change in those without disease control. For sVEGFR-3,
the decrease from baseline was significantly greater in
patients with disease control at the earliest post-baseline
assessment (cycle 1 day 14; Table 1), but the dif ference
was not significant at l ater tim e points (data not
shown). Similar results were obtained when patients
were stratified by Choi response criteria, although only
the change in VEGF-C levels achieved statistical signifi-
cance (Table 1).
Relationship between biomarker levels and time-to-event
outcomes
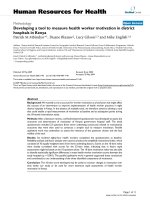
Table 3 shows median TTP and OS in patients stratified
by above- or below-median plasma concentration of
each biomarker at baseline. As previously reported [14],
median TTP and OS were significantly longer in
patients with above-median baseline levels of VEGF-C,
compared with those with below-median baseline values
(Kaplan-Meier curves of final TTP and OS datasets are
shown in Figure 4). No other significant associations
were seen between TTP or OS and baseline levels of
other biomarkers.
Also shown in Table 3 (and F igure 5) are ti me-to event
results for patients stratified by above- or below-median
ratio to baseline at post-baseline time points. Median
TTP was significantly longer in patients with ≤ median
ratio to baseline of VEGF-C at cycle 2 day 1 (P = 0.0347)
and cycle 5 day 28 (P = 0.0192). OS was also significantly
longer in patients with ≤ median ratio to baseline of
VEGF-C at cycle 1 day 28 (P = 0.0291) and cycle 2 day 1
(P = 0.0 452). For VEGF-A, a similar pattern was seen,
with significantly longer TTP in those with ≤ median
ratio to baseline in VEGF-A at cycle 1 day 14 (P =
0.0225) and at c ycle 2 day 28 (P = 0.0034), and signifi-
cantly longer OS at cycle 1 day 14 (P = 0.0142). Above/
below median ratio to baseline in soluble receptor levels
each showed significant associations with TTP or OS at
one or more time points (Table 3).
When soluble protein levels were analyzed as continu-
ous variables using the Cox pr oportional hazards model,
baseline VEGF-C was the only soluble protein significantly
associated with TTP by univariate analysis (HR = 0.413; P
= 0.0165) and showed a trend towards an association with
OS (HR = 0.683; P = 0.190; Table 4). sVEGFR-2 ratio to
baseline at cycle 1 day 28 was the only soluble protein sig-
nificantly associated with OS (HR = 0. 049; P = 0.0253).
These associations remained significant for baseline
VEGF-C (HR = 0.414; P = 0.037) and sVEGFR-2 ratio at
cycle 2 day 1 (HR = 0.0257; P = 0.0290) by multivariate
analysis of variables that were significant in univariate ana-
lyses (Table 5). In addition, ECOG performance status and
Child-Pugh class were significantly associated with OS in
multivariate analysis (Table 5). Notably, the proportion of
patients with Child-Pugh class B disease (n = 6) was much
smaller than those with class A disease (n = 31).
Relationship between biomarker levels and changes in
tumor density
Post-hoc analyses examined changes in tumor density
on computed tomography (CT) scans during sunitinib
treatment, as reported separately [23]. Twenty-six
patients were assessable for changes in tumor density.
For analysis of associations between protein biomarker
levels and tumor density change, subjects were stratified
into groups having tumo r density changes at the end of
cycle 1 that were above or below the median value of
-31.6%, with a negative value indicating a reduction in
tumor density compared with baseline (Additiona l File
1, Table S1). No significant associations were detected
between baseline soluble protein levels and tumor den-
sity change, although there were trends towards an asso-
ciatio n between greater reductions in tumor density and
high baseline levels of sVEGFR-3 or VEGF-C, and low
baseline levels of sKIT. At cycle 1 day 14, greater reduc-
tions in tumor density were significantly associated with
low sKIT ratios to baseline (P = 0.0191) and with high
sVEGFR-3 ratios to baseline (P = 0.0221).
Table 2 Contingency table analysis of baseline levels of
biomarkers and their value in predicting disease control
(complete or partial response, or stable disease > 12
weeks) vs. progressive disease with sunitinib treatment
VEGF-
A
VEGF-
C
sVEGFR-
2
sVEGFR-
3
sKIT
Area under ROC curve, % 77.3 87.0 53.9 55.8 51.3
ROC-derived cut-point
(pg/mL)
137.6 941.8 7,416 61,600 46,635
Fisher’s exact P-value 0.0078 0.0012 0.1107 0.090 0.6887
Relative risk 2.571 4.714 1.950 1.929 1.273
Sensitivity 0.500 0.857 0.643 0.429 0.500
Specificity 1.000 0.818 0.727 0.909 0.636
Accuracy 0.720 0.840 0.680 0.640 0.560
Positive predictive value 1.000 0.857 0.750 0.857 0.636
Negative predictive value 0.611 0.818 0.615 0.556 0.500
ROC, receiver operating characteristic.
Harmon et al. Journal of Translational Medicine 2011, 9:120
/>Page 6 of 14
Table 3 Median time to progression (TTP) and overall survival (OS) in patients stratified by above/below median
baseline, and by above/below median ratio to baseline, soluble protein level
Endpoint and soluble protein Median baseline
level, pg/mL
(N = 37)
Median time to event, weeks Log-rank
P-value
Hazard ratio
(95% CI)
Patients with
≤ median
baseline level
(n = 19)
Patients with
> median baseline level
(n = 18)
TTP
VEGF-A 54.9 21.0 34.0 0.0941 2.15 (0.88, 5.25)
VEGF-C 822.2 7.93 34.00 0.0096* 4.12 (1.41, 12.02)
sVEGFR-2 7068 11.71 34.00 0.1641 1.84 (0.78, 4.33)
OS
VEGF-C 822.2 18.57 45.00 0.0165* 2.53 (1.19, 5.41)
sVEGFR-3 48,700 57.00 24.64 0.0673 0.50 (0.24, 1.05)
Endpoint, soluble protein, and time point Median ratio to
baseline
Median time to event, weeks Log-rank
P-value
Hazard ratio
(95% CI)
Patients with
≤ median
ratio to
baseline
†
Patients with
> median ratio to baseline
†
TTP
VEGF-A
C1D14:D1 2.2269 34.0 11.7 0.0225* 0.30 (0.11, 0.84)
C2D1:D1 0.9153 42.9 32.4 0.1341 0.44 (0.15, 1.29)
C2D28:D1 2.0923 42.9 21.0 0.0034* 0.15 (0.04, 0.53)
VEGF-C
C2D1:D1 0.6596 32.43 11.71 0.0347* 0.29 (0.09, 0.92)
C5D28:D1 0.6385 48.43 34.07 0.0192* 0.16 (0.04, 0.74)
sVEGFR-3
C1D28:D1 0.2195 16.14 46.29 0.0028* 5.54 (1.80, 17.02)
sKIT
C1D14:D1 0.8221 34.14 16.14 0.0476* 0.33 (0.11, 0.99)
C2D28:D1 0.4067 22.00 42.86 0.1182 2.35 (0.80, 6.84)
OS
VEGF-A
C1D14:D1 2.2269 69.00 18.79 0.0142* 0.36 (0.16, 0.82)
C2D1:D1 0.9153 57.00 22.21 0.0862 0.45 (0.18, 1.12)
VEGF-C
C1D28:D1 0.7388 45.00 21.21 0.0291* 0.37 (0.15, 0.90)
C2D1:D1 0.6596 57.00 18.57 0.0452* 0.38 (0.15, 0.98)
sVEGFR-2
C1D28:D1 0.4558 20.50 71.21 0.0041* 3.96 (1.55, 10.12)
sKIT
C1D14:D1 0.8221 45.00 27.50 0.1356 0.55 (0.25, 1.21)
C2D28:D1 0.4067 40.79 73.43 0.0218* 0.37 (1.21, 11.48)
Only results where P ≤ 0.2 are shown.
*Significant at the 0.05 level.
†
Number of patients included in ≤ median and > media n stratification groups, respectively, at each time point: C1D14:D1: n = 17, n = 16; C1D28:D1: n = 14, n =
14; C2D1:D1: n = 13, n = 12; C2D28:D1: n = 10, n = 9; C5D28:D1: n = 6, n = 6.
C, cycle; D, day.
Harmon et al. Journal of Translational Medicine 2011, 9:120
/>Page 7 of 14
Discussion
Inthepresentstudywehaveinvestigatedtheplasma
pharmacodynamics of a number of sunitinib target-
related soluble proteins and investigated potential
relationships between these proteins and measures of
clinical outcome, as part of a phase II study of 37
patients with advanced, unresectable HCC [14]. Poten-
tially the most clinicallyusefulfindingfromthis
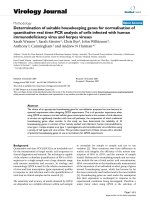
Figure 4 Final Kaplan-Meier estimate of time to progression (TTP) and overall survival (OS) in patients stratified by above/below
median baseline levels of VEGF-C.
Harmon et al. Journal of Translational Medicine 2011, 9:120
/>Page 8 of 14
exploratory analysis is the strong correlation between
high plasma concentrations of VEGF-C at baseline and
improved clinical outcome, as determined by objective
response (RECIST), TTP, and OS, with baseline VEGF-
C remaining an independent predictor of TTP by multi-
variate analysis. VEGF-C and VEGF-D are members of
the VEGF family of ligands that bind to and activate
VEGFR-3 [33]. M ature forms of these ligands also bind
Figure 5 Kaplan-Meier estimate of time to progression (TTP) and overall survival (OS) in patients stratified by above/below median
ratio to baseline levels of sKIT (A and B), sVEGF-A (C and D), and VEGF-C (E and F) at post-baseline time points. Graphs A, C, and E
show TTP and graphs B, D, and F show OS. C, cycle; D, day.
Harmon et al. Journal of Translational Medicine 2011, 9:120
/>Page 9 of 14
Table 4 Univariate analysis of time to progression (TTP) and overall survival (OS) using the Cox proportional hazard
model
n TTP analysis OS analysis
Hazard ratio (95% CI) Log-rank
P-value
Hazard ratio (95% CI) Log-rank P-value
Baseline characteristics
Age
†
37 0.984 (0.944-1.02) 0.429 0.996 (0.962-1.03) 0.819
Sex (male vs. female) 37
(34 vs. 3)
0.214
(0.028-1.64)
0.105 0.654
(0.155-2.76)
0.559
Number of disease sites
(1 vs. ≥ 2)
37
(18 vs. 19)
1.78
(0.754-4.18)
0.183 1.03
(0.501-2.11)
0.939
Cirrhosis (no vs. yes) 35
(23 vs. 12)
2.22
(0.907-5.41)
0.0743 2.23
(0.975-5.11)
0.0521
Portal vein thrombosis
(no vs. yes)
37
(18 vs. 19)
1.3
(0.549-3.1)
0.547 2.00
(0.938-4.27)
0.0682
Hepatitis B (no vs. yes) 32
(15 vs. 7)
1.74
(0.685-4.4)
0.240 1.07
(0.489-2.35)
0.864
Histological grade
(low or medium vs. high)
33
(22 vs. 11)
0.756
(0.276-2.07)
0.586 0.78
(0.337-1.81)
0.561
Child-Pugh class (A vs. B) 37
(31 vs. 6)
1.49
(0.428-5.18)
0.530 3.39
(1.34-8.61)
0.0065*
ECOG PS (0 vs. 1) 37
(19 vs. 18)
3.21
(1.19-8.63)
0.0157* 7.86
(2.78-22.2)
< 0.0001*
CLIP stage (≤ 2 vs. > 2) 27
(15 vs. 12)
1.57
(0.490-5.00)
0.445 1.23
(0.54-2.81)
0.62
Soluble proteins
Baseline VEGF-A (ng/mL)
†
37 0.041
(0.0006-3.00)
0.132 1.04
(0.056-19.4)
0.977
Baseline VEGF-C (ng/mL)
†
37 0.413
(0.196-0.869)
0.0165* 0.683
(0.384-1.21)
0.190
Baseline sVEGFR-2 (ng/mL)
†
37 0.887
(0.699-1.13)
0.325 0.969
(0.803-1.17)
0.746
Baseline sKIT (ng/mL)
†
37 0.996
(0.959-1.04)
0.853 0.997
(0.970-1.02)
0.804
sVEGFR-2 ratio to baseline at C1D28
†
28 0.216
(0.0084-5.54)
0.353 0.049
(0.0027-0.672)
0.0253*
Hazard ratio < 1 indicates that risk decrea ses with increasing value
*Significant at the 0.05 level
†
Analyzed as continuous variables
CLIP, Cancer of the Liver Italian Program; ECOG PS, Eastern Cooperative Oncology Group performance status
Table 5 Multivariate analysis of variables with significant relationships with clinical outcome in univariate analysis
using the Cox proportional hazard model
Variable n Hazard ratio (95% CI) Log-rank P-value
Time to progression 37
ECOG PS (0 vs. 1) 2.692 (0.987-7.34) 0.053
Baseline VEGF-C (ng/mL)
†
0.414 (0.181-0.95) 0.037*
Overall survival 28
Child-Pugh class (A vs. B) 4.053 (1.011-16.25) 0.0480*
ECOG PS (0 vs. 1) 4.875 (1.647-14.43) 0.0042*
sVEGFR-2 ratio to baseline at C1D28
†
0.0257 (0.0001-0.681) 0.0290*
Hazard ratio < 1 indicates that risk decrea ses with increasing value
*Significant at the 0.05 level
†
Analyzed as continuous variables
ECOG PS, Eastern Coo perative Oncology Group performance status
Harmon et al. Journal of Translational Medicine 2011, 9:120
/>Page 10 of 14
to VEGFR-2 [33], and in vivo angiogenic activity has
been demonstrated for VEGF-C in the mouse corneal
pocket assay [34]. The correlative findings for VEGF-C
presented here raise the possibility that the VEGF-C/
VEGFR-3 pathway may play a role in HCC disease pro-
gression, and that inhibition of this receptor may result
in improved clinical outcome in a subset of patients
with this disease, following treatment with sunitinib.
In support of the proposed role for the VEGFR-3
pathway in HCC progression, Thelen et al. [4] observed
high levels of tumor cell VEGF-D expression in biopsies
from HCC patients but not in specimens from cirrhotic
or normal livers. VEGFR-3 was expressed in both tumor
endothelium and lymphatics, suggesting that both
hemangiogenesis and lymphangiogenesis may be regu-
lated by this receptor in HCC [4]. Similar findings have
been reported for VEGFR-3 expression in a number of
other tumor types [35-38], and the biology of this recep-
tor no longer appears to be restricted to lymph vessel
production. When the human hepatoma cell line
SKHep1, which does not express VEGF-D, was stably
transfected with VEGF-D cDNA and then implanted
subcutaneously in mice, larger and more metastatic
tumors were for med compared wit h those from mock-
transfected cells [4]. Interestingly, co-expression of the
soluble VEGFR-3 domain in these cells blocked VEGF-
D-induced tumor growth and metastatic spread.
A relationship was seen in this study between circulat-
ing VEGF-C levels prior to sunitinib dosing and the
pharmacodynamics of VE GF-C and VEGF-A, but not of
the soluble receptors studied. Plasma VEGF-C levels
declined markedly at all t ime points in patients with
high VEGF-C concentrations at baseline, with little
change in patients with low baseline VEGF-C. This find-
ing is consistent with the positive associations between
clinical outcome and both elevated VEGF-C levels at
baseline and greater reductions in VEGF-C. In contrast,
sunitinib-induced increases in VEGF- A were reduced in
patients with high baseline VEGF-C at some time
points, suggesting an attenuated hypoxic response in
this patient subset.
This is the first report in any tumor type of an asso-
ciation between elevated plasma levels of VEGF-C at
baseline a nd improved clinical outcome following treat-
ment with sunitinib. In contrast to the present finding
for subjects with advanced HCC who had received no
prior systemic therapy, results from a phase II study of
sunitinib in patients with metastatic renal cell carcinoma
(RCC) indicated that relatively low (< median) levels of
VEGF-C at baseline were associated with achievement
of response (RECIST) and with longer progression-free
survival [39]. However, patients enrolled in this RCC
study had previously progressed on bevacizumab ther-
apy, raising the possibility that the observed biomarker
correlations reflected the development of resistance to
VEGF-A pathway inhibition, and no such association
was seen in a phase I/II study in which patients with
metastatic RCC were treated with sunitinib in combina-
tion with gefitinib [40]. It should be noted that RCC
and HCC are distinct diseases that respond differently
to sunitinib and that available correlative data for circu-
lating VEGF-C in both tumors are limited, indicating a
need for further research on this protein as a possible
predictive biomarker in these and other tumor types.
The present exploratory analysis also showed that
sunitin ib dosing significantly reduced plasma sKIT from
baseline levels, with no rebound during the off-treat-
ment period. Low sKIT ratios to baseline at cycle 1 day
14 were associated with prolonged TTP and reduced
tumor density, as well as with a trend towards pro-
longed OS. These findings support the association
between sKIT reduct ion and improved cli nical outcome
reported by Zhu et al . in a phase II study of sunitinib
in HCC [13], and suggest that inhibition of KIT signal-
ing may contribute to sunitinib antitumor activity. The
lack of early separation in the sKIT TTP and OS
Kaplan-Meier curves (Figures 5A and 5B, respectively)
suggests that two subsets of patients with a low sKIT
ratio might exist: one that has markedly prolonged TTP
and OS, and another subset with no difference. How-
ever, the relatively small samp le size and higher level of
censoring in the low sKIT group should be taken into
consideration.
In the study by Zhu et al.[13],patientswithHCC
were treated with sunit inib at a dose of 37.5 mg/day on
Schedule 4/2. T he pharmaco dynamics of VEG F-A,
sVEGFR-2, and sVEGFR-3 were similar to those seen in
the present analysi s, but levels of sKIT and VEGF-C did
not change significantl y from baseline over 4 cycl es of
sunitinib treatment, in contrast to the present findings.
Nonetheless, delayed t umor progression was associated
with an early (day 14) decrease in circulating sKIT, con-
sistent with the findings presented here. The possible
role of KIT (CD117) in HCC is unclear. A retrospective
study of archival tumor specimens from patients with
histologically confirmed HCC suggested that KIT is not
significantly overexpressed in this tumor type [41].
However, KIT blockade by imatinib mesylate inhibited
HCC development in mice with chronic liver injury, via
antiproliferative effects on KIT-ex pressing liver progeni-
tor cells [42].
A number of limitations apply to the biomarker inves-
tigation reported here. Statistical analyses were not
strongly powered, with plasma samples from 37 patients
at baseline and declining sample sizes over time due to
treatment discontinuations. Analysis of plasma proteins
in relation to objective response was further limited by
the proportion of patients (27.0%) not evaluable by
Harmon et al. Journal of Translational Medicine 2011, 9:120
/>Page 11 of 14
RECIST. As this was a single-arm sunitinib study, it was
not possible to determine whether biomarker associa-
tions with clinical outcome were predictive or prognos-
tic in nature (or perhaps both). Thus, high plasma
VEGF-C at baseline may represent a predictive factor
for patients with HCC treated with sunitinib, consistent
with potent inhibition of VEGFR-2 and -3 by this tyro-
sine kinase inhib itor. Alternatively, plasma VEGF-C may
repres ent a positive prognostic factor in HCC, indepen-
dent of treatment modality, as has been shown for the
absence of cirrhosis in some HCC studies (reviewed in
[43]). However, there are data to support high tumor
VEGF-C expression as a negative prognostic factor,
independent of other variables, in non-small cell lung
cancer [44], esophage al cancer [45], and gastric cancer
[46], while high pl asma levels of VEGF-C served as an
independent negative prognostic factor in colorectal
cancer [47]. These findings from correlative studies in
other tumor types suggest that the positive association
for plasma VEGF-C in HCC reported here may be pre-
dictive rather than prognostic in nature, but further
research is necessary to address this issue. The present
study was limited to a small group of ci rculating pro-
teins closely linked to known molec ular targets of suni-
tinib. However, other angiogenesis-related proteins, such
as basic f ibroblast growth fa ctor, as well as markers of
other processes with an important role in tumor biology,
such as inflammation [13], may have val ue in identifying
patients with HCC who have inherent or acquired resis-
tance to sunitinib therapy.
The findings reported here for selected plasma bio-
markers may have value in the design of future phase III
clinical trials using sunitinib in patients with HCC. In
particular, a patient selection strategy that includes base-
line VEGF-C concentrations above a speci fied value may
increase the likelihood of demonstrating clinical
improvement, and conversely may prevent unnecessary
drug exposure in patients unlikely to benefit. Data from
a phase III trial comparing sunitinib with sorafenib
(NCT00699374) will soon be presen ted showing no
advantage for sunitinib in an unselected patient popula-
tion. However, identification of a subset of patients with
HCC who benefit from sunitinib treatment remains an
important objective of biomarker research. Furthermore,
results from the present study may have relevance to
the prediction of efficacy in HCC trials of drugs with a
similar mechanism of action to sunitinib.
Conclusion
In conclusion, high plasma levels of VEGF-C at baseline
were strongly associated with improved clinical outcome
in patients with HCC who received sunitinib, and plasma
VEGF-C was an independent positive predictor of TTP
by multivariate analysis. A more complete assessment of
the potential clinical utility of these and other correlative
findings obtained in this exploratory phase II study will
require additional research.
Additional material
Additional file 1: Supplementary material. Contains Table S1 and
Figure S1 (caption and artwork).
Acknowledgements
We would like to thank all of the participating patients and their families, as
well as the investigators, research nurses, study coordinators, and operations
staff. This study was sponsored by Pfizer Inc. Medical writing support was
provided by Jenni Macdougall and Molly Heitz at ACUMED
®
(Tytherington,
UK) with funding from Pfizer Inc.
Author details
1
Pfizer Oncology, La Jolla, CA, USA.
2
Beaujon University Hospital, Clichy,
France.
3
Department of Internal Medicine and Oncology, National Taiwan
University Hospital, Taipei, Taiwan.
4
Centre Eugène Marquis, University
Hospital, Rennes, France.
5
Centre R Gauducheau, St-Herblain, France.
6
Samsung Medical Center, Seoul, Republic of Korea.
7
Korea University Guro
Hospital, Seoul, Republic of Korea.
8
Pfizer Oncology, Milan, Italy.
9
Exelixis,
South San Francisco, CA, USA.
Authors’ contributions
CH, SD, SL, and XL all contributed to the conception and design of the
study. J-YD, HL, and JK were responsible for recruiting/supplying patients for
the study trial. CH, SD, ER, ML, SL, and XL were all involved with the
acquisition and interpretation/analysis of study data. A-LC was involved with
the acquisition of study data. All the authors contributed to drafting and
reviewing the manuscript, and all the authors read and approved the final
manuscript.
Competing interests
SD, ML, SL, and XL are/were all employees of Pfizer Inc. CH is an employee
of Atrium Inc., owns stock in Pfizer Inc., and was a paid contractor to Pfizer
Inc. in the development of this manuscript and the analysis and
interpretation of data involving circulating biomarkers of angiogenesis. ER
has served Pfizer Inc. in an advisory/consultancy role and J-YD has served
Pfizer Inc. on an advisory board. SF has received honoraria from Pfizer Inc.
All the other authors have no competing interests to declare.
Received: 21 December 2010 Accepted: 25 July 2011
Published: 25 July 2011
References
1. Yao DF, Wu XH, Zhu Y, Shi GS, Dong ZZ, Yao DB, Wu W, Qiu LW, Meng XY:
Quantitative analysis of vascular endothelial growth factor,
microvascular density and their clinicopathologic features in human
hepatocellular carcinoma. Hepatobiliary Pancreat Dis Int 2005, 4:220-226.
2. Zhang ZL, Liu ZS, Sun Q: Expression of angiopoietins, Tie2 and vascular
endothelial growth factor in angiogenesis and progression of
hepatocellular carcinoma. World J Gastroenterol 2006, 12:4241-4245.
3. Amaoka N, Saio M, Nonaka K, Imai H, Tomita H, Sakashita F, Takahashi T,
Sugiyama Y, Takami T, Adachi Y: Expression of vascular endothelial
growth factor receptors is closely related to the histological grade of
hepatocellular carcinoma. Oncol Rep 2006, 16:3-10.
4. Thelen A, Scholz A, Benckert C, von Marschall Z, Schröder M,
Wiedenmann B, Neuhaus P, Rosewicz S, Jonas S: VEGF-D promotes tumor
growth and lymphatic spread in a mouse model of hepatocellular
carcinoma. Int J Cancer 2008, 122:2471-2481.
5. Semela D, Dufour JF: Angiogenesis and hepatocellular carcinoma. J
Hepatol 2004, 41:864-880.
Harmon et al. Journal of Translational Medicine 2011, 9:120
/>Page 12 of 14
6. Park YN, Kim YB, Yang KM, Park C: Increased expression of vascular
endothelial growth factor and angiogenesis in the early stage of
multistep hepatocarcinogenesis. Arch Pathol Lab Med 2000, 124:1061-1065.
7. Kim SJ, Choi IK, Park KH, Yoon SY, Oh SC, Seo JH, Choi CW, Kim BS,
Shin SW, Kim YH, Kim JS: Serum vascular endothelial growth factor per
platelet count in hepatocellular carcinoma: correlations with clinical
parameters and survival. Jpn J Clin Oncol 2004, 34:184-190.
8. Poon RT, Ng IO, Lau C, Yu WC, Fan ST, Wong J: Correlation of serum basic
fibroblast growth factor levels with clinicopathologic features and
postoperative recurrence in hepatocellular carcinoma. Am J Surg 2001,
182:298-304.
9. Kong SY, Park JW, Lee JA, Park JE, Park KW, Hong EK, Kim CM: Association
between vascular endothelial growth factor gene polymorphisms and
survival in hepatocellular carcinoma patients. Hepatology 2007, 46:446-455.
10. Moon EJ, Jeong CH, Jeong JW, Kim KR, Yu DY, Murakami S, Kim CW,
Kim KW: Hepatitis B virus X protein induces angiogenesis by stabilizing
hypoxia-inducible factor-1alpha. FASEB J 2004, 18:382-384.
11. Cheng AL, Kang YK, Chen Z, Tsao CJ, Qin S, Kim JS, Luo R, Feng J, Ye S,
Yang TS, Xu J, Sun Y, Liang H, Liu J, Wang J, Tak WY, Pan H, Burock K,
Zou J, Voliotis D, Guan Z: Efficacy and safety of sorafenib in patients in
the Asia-Pacific region with advanced hepatocellular carcinoma: a phase
III randomised, double-blind, placebo-controlled trial. Lancet Oncol 2009,
10:25-34.
12. Llovet JM, Ricci S, Mazzaferro V, Hilgard P, Gane E, Blanc JF, de Oliveira AC,
Santoro A, Raoul JL, Forner A, Schwartz M, Porta C, Zeuzem S, Bolondi L,
Greten TF, Galle PR, Seitz JF, Borbath I, Häussinger D, Giannaris T, Shan M,
Moscovici M, Voliotis D, Bruix J, the SHARP Investigators Study Group:
Sorafenib in advanced hepatocellular carcinoma. N Engl J Med 2008,
359:378-390.
13. Zhu AX, Sahani DV, Duda DG, di Tomaso E, Ancukiewicz M, Catalano OA,
Sindhwani V, Blaszkowsky LS, Yoon SS, Lahdenranta J, Bhargava P,
Meyerhardt J, Clark JW, Kwak EL, Hezel AF, Miksad R, Abrams TA,
Enzinger PC, Fuchs CS, Ryan DP, Jain RK: Efficacy, safety, and potential
biomarkers of sunitinib monotherapy in advanced hepatocellular
carcinoma: a phase II study. J Clin Oncol 2009, 27:3027-3035.
14. Faivre S, Raymond E, Boucher E, Douillard J, Lim HY, Kim JS, Zappa M,
Lanzalone S, Lin X, Deprimo S, Harmon C, Ruiz-Garcia A, Lechuga MJ,
Cheng AL: Safety and efficacy of sunitinib in patients with advanced
hepatocellular carcinoma: an open-label, multicentre, phase II study.
Lancet Oncol 2009, 10:794-800.
15. Koeberle D, Montemurro M, Samaras P, Majno P, Simcock M, Limacher A,
Lerch S, Kovàcs K, Inauen R, Hess V, Saletti P, Borner M, Roth A, Bodoky G:
Continuous sunitinib treatment in patients with advanced hepatocellular
carcinoma: a Swiss Group for Clinical Cancer Research (SAKK) and Swiss
Association for the Study of the Liver (SASL) multicenter phase II trial
(SAKK 77/06). Oncologist 2010, 15:285-292.
16. Abrams TJ, Lee LB, Murray LJ, Pryer NK, Cherrington JM: SU11248 inhibits
KIT and platelet-derived growth factor receptor beta in preclinical
models of human small cell lung cancer. Mol Cancer Ther 2003, 2:471-478.
17. Kim DW, Jo YS, Jung HS, Chung HK, Song JH, Park KC, Park SH, Hwang JH,
Rha SY, Kweon GR, Lee SJ, Jo KW, Shong M: An orally administered
multitarget tyrosine kinase inhibitor, SU11248, is a novel potent
inhibitor of thyroid oncogenic RET/papillary thyroid cancer kinases. J Clin
Endocrinol Metab 2006, 91:4070-4076.
18. Mendel DB, Laird AD, Xin X, Louie SG, Christensen JG, Li G, Schreck RE,
Abrams TJ, Ngai TJ, Lee LB, Murray LJ, Carver J, Chan E, Moss KG,
Haznedar JO, Sukbuntherng J, Blake RA, Sun L, Tang C, Miller T, Shirazian S,
McMahon G, Cherrington JM: In vivo antitumor activity of SU11248, a
novel tyrosine kinase inhibitor targeting vascular endothelial growth
factor and platelet-derived growth factor receptors: determination of a
pharmacokinetic/pharmacodynamic relationship. Clin Cancer Res
2003,
9:327-337.
19.
Murray LJ, Abrams TJ, Long KR, Ngai TJ, Olson LM, Hong W, Keast PK,
Brassard JA, O’Farrell AM, Cherrington JM, Pryer NK: SU11248 inhibits
tumor growth and CSF-1R-dependent osteolysis in an experimental
breast cancer bone metastasis model. Clin Exp Metastasis 2003,
20:757-766.
20. O’Farrell AM, Abrams TJ, Yuen HA, Ngai TJ, Louie SG, Yee KW, Wong LM,
Hong W, Lee LB, Town A, Smolich BD, Manning WC, Murray LJ,
Heinrich MC, Cherrington JM: SU11248 is a novel FLT3 tyrosine kinase
inhibitor with potent activity in vitro and in vivo. Blood 2003,
101:3597-3605.
21. Kodera Y, Katanasaka Y, Kitamura Y, Hitoshi T, Nishio K, Tamura T, Koizumi F:
Sunitinib inhibits lymphatic endothelial cell functions and lymph node
metastasis in a breast cancer model through inhibition of vascular
endothelial growth factor receptor 3. Breast Cancer Res 2011.
22. Therasse P, Arbuck SG, Eisenhauer EA, Wanders J, Kaplan RS, Rubinstein L,
Verweij J, Van Glabbeke M, van Oosterom AT, Christian MC, Gwyther SG:
New guidelines to evaluate the response to treatment in solid tumors. J
Natl Cancer Inst 2000, 92:205-216.
23. Faivre S, Zappa M, Vilgrain V, Boucher E, Douillard JY, Lim HY, Kim JS,
Im SA, Kang YK, Bouattour M, Dokmak S, Dreyer C, Sablin MP, Serrate C,
Cheng AL, Lanzalone S, Lin X, Lechuga MJ, Raymond E: Changes in Tumor
Density in Patients with Advanced Hepatocellular Carcinoma Treated
with Sunitinib. Clin Cancer Res 2011, 17:4504-4512.
24. DePrimo SE, Bello CL, Smeraglia J, Baum CM, Spinella D, Rini BI,
Michaelson MD, Motzer RJ: Circulating protein biomarkers of
pharmacodynamic activity of sunitinib in patients with metastatic renal
cell carcinoma: modulation of VEGF and VEGF-related proteins. J Transl
Med 2007, 5:32.
25. Bello CL, DePrimo SE, Friece C, Smeraglia J, Sherman L, Tye L, Baum CM,
Meropol NJ, Lenz H, Kulke MH: Analysis of circulating biomarkers of
sunitinib malate in patients with unresectable neuroendocrine tumors
(NET): VEGF, IL-8, and soluble VEGF receptors 2 and 3. J Clin Oncol 2006,
24(Suppl 18S), Abstract 4045.
26. Burstein HJ, Elias AD, Rugo HS, Cobleigh MA, Wolff AC, Eisenberg PD,
Lehman M, Adams BJ, Bello CL, DePrimo SE, Baum CM, Miller KD: Phase II
study of sunitinib malate, an oral multitargeted tyrosine kinase inhibitor,
in patients with metastatic breast cancer previously treated with an
anthracycline and a taxane. J Clin Oncol 2008, 26:1810-1816.
27. Faivre S, Delbaldo C, Vera K, Robert C, Lozahic S, Lassau N, Bello C,
Deprimo S, Brega N, Massimini G, Armand JP, Scigalla P, Raymond E: Safety,
pharmacokinetic, and antitumor activity of SU11248, a novel oral
multitarget tyrosine kinase inhibitor, in patients with cancer. J Clin Oncol
2006, 24:25-35.
28. Motzer RJ, Michaelson MD, Redman BG, Hudes GR, Wilding G, Figlin RA,
Ginsberg MS, Kim ST, Baum CM, DePrimo SE, Li JZ, Bello CL, Theuer CP,
George DJ, Rini BI: Activity of SU11248, a multitargeted inhibitor of
vascular endothelial growth factor receptor and platelet-derived growth
factor receptor, in patients with metastatic renal cell carcinoma. J Clin
Oncol 2006, 24:16-24.
29. Norden-Zfoni A, Desai J, Manola J, Beaudry P, Force J, Maki R, Folkman J,
Bello C, Baum C, DePrimo SE, Shalinsky DR, Demetri GD, Heymach JV:
Blood-based biomarkers of SU11248 activity and clinical outcome in
patients with metastatic imatinib-resistant gastrointestinal stromal
tumor. Clin Cancer Res 2007, 13:2643-2650.
30. George S, Blay JY, Casali PG, Le Cesne A, Stephenson P, DePrimo SE,
Harmon CS, Law CN, Morgan JA, Ray-Coquard I, Tassell V, Cohen DP,
Demetri GD: Clinical evaluation of continuous daily dosing of sunitinib
malate in patients with advanced gastrointestinal stromal tumor after
imatinib failure. Eur
J Cancer 2009, 45:1959-1968.
31. DePrimo SE, Huang X, Blackstein ME, Garrett CR, Harmon CS, Schöffski P,
Shah MH, Verweij J, Baum CM, Demetri GD: Circulating levels of soluble
KIT serve as a biomarker for clinical outcome in gastrointestinal stromal
tumor patients receiving sunitinib following imatinib failure. Clin Cancer
Res 2009, 15:5869-5877.
32. Choi H, Charnsangavej C, Faria SC, Macapinlac HA, Burgess MA, Patel SR,
Chen LL, Podoloff DA, Benjamin RS: Correlation of computed tomography
and positron emission tomography in patients with metastatic
gastrointestinal stromal tumor treated at a single institution with
imatinib mesylate: proposal of new computed tomography response
criteria. J Clin Oncol 2007, 25:1753-1759.
33. Lohela M, Bry M, Tammela T, Alitalo K: VEGFs and receptors involved in
angiogenesis versus lymphangiogenesis. Curr Opin Cell Biol 2009,
21:154-165.
34. Cao Y, Linden P, Farnebo J, Cao R, Eriksson A, Kumar V, Qi JH, Claesson-
Welsh L, Alitalo K: Vascular endothelial growth factor C induces
angiogenesis in vivo. Proc Natl Acad Sci USA 1998, 95:14389-14394.
35. Clarijs R, Schalkwijk L, Hofmann UB, Ruiter DJ, de Waal RM: Induction of
vascular endothelial growth factor receptor-3 expression on tumor
Harmon et al. Journal of Translational Medicine 2011, 9:120
/>Page 13 of 14
microvasculature as a new progression marker in human cutaneous
melanoma. Cancer Res 2002, 62:7059-7065.
36. Grau SJ, Trillsch F, Herms J, Thon N, Nelson PJ, Tonn JC, Goldbrunner R:
Expression of VEGFR3 in glioma endothelium correlates with tumor
grade. J Neurooncol 2007, 82:141-150.
37. Valtola R, Salven P, Heikkilä P, Taipale J, Joensuu H, Rehn M, Pihlajaniemi T,
Weich H, deWaal R, Alitalo K: VEGFR-3 and its ligand VEGF-C are
associated with angiogenesis in breast cancer. Am J Pathol 1999,
154:1381-1390.
38. Achen MG, Williams RA, Baldwin ME, Lai P, Roufail S, Alitalo K, Stacker SA:
The angiogenic and lymphangiogenic factor vascular endothelial growth
factor-D exhibits a paracrine mode of action in cancer. Growth Factors
2002, 20:99-107.
39. Rini BI, Michaelson MD, Rosenberg JE, Bukowski RM, Sosman JA,
Stadler WM, Hutson TE, Margolin K, Harmon CS, DePrimo SE, Kim ST,
Chen I, George DJ: Antitumor activity and biomarker analysis of sunitinib
in patients with bevacizumab-refractory metastatic renal cell carcinoma.
J Clin Oncol 2008, 26:3743-3748.
40. Motzer RJ, Hudes GR, Ginsberg MS, Baum MS, Harmon CS, Kim ST, Chen I,
Redman BG: Phase I/II trial of sunitinib plus gefitinib in patients with
metastatic renal cell carcinoma. Am J Clin Oncol 2010, 33:614-618.
41. Becker G, Schmitt-Graeff A, Ertelt V, Blum HE, Allgaier HP: CD117 (c-kit)
expression in human hepatocellular carcinoma. Clin Oncol (R Coll Radiol)
2007, 19:204-208.
42. Knight B, Tirnitz-Parker JE, Olynyk JK: C-kit inhibition by imatinib mesylate
attenuates progenitor cell expansion and inhibits liver tumor formation
in mice. Gastroenterology 2008, 135:969-979, 979.e1.
43. Tandon P, Garcia-Tsao G: Prognostic indicators in hepatocellular
carcinoma: a systematic review of 72 studies. Liver Int 2009, 29:502-510.
44. Ogawa E, Takenaka K, Yanagihara K, Kurozumi M, Manabe T, Wada H,
Tanaka F: Clinical significance of VEGF-C status in tumour cells and
stromal macrophages in non-small cell lung cancer patients. Br J Cancer
2004, 91:498-503.
45. Liu P, Chen W, Zhu H, Liu B, Song S, Shen W, Wang F, Tucker S, Zhong B,
Wang D: Expression of VEGF-C correlates with a poor prognosis based
on analysis of prognostic factors in 73 patients with esophageal
squamous cell carcinomas. Jpn J Clin Oncol 2009, 39:644-650.
46. Tsutsumi S, Kuwano H, Shimura T, Morinaga N, Mochiki E, Asao T: Vascular
endothelial growth factor C (VEGF-C) expression in pT2 gastric cancer.
Hepatogastroenterology 2005, 52:629-632.
47. Miyazaki T, Okada N, Ishibashi K, Ogata K, Ohsawa T, Ishiguro T, Nakada H,
Yokoyama M, Matsuki M, Kato H, Kuwano H, Ishida H: Clinical significance
of plasma level of vascular endothelial growth factor-C in patients with
colorectal cancer. Jpn J Clin Oncol 2008, 38:839-843.
doi:10.1186/1479-5876-9-120
Cite this article as: Harmon et al.: Mechanism-related circulating
proteins as biomarkers for clinical outcome in patients with
unresectable hepatocellular carcinoma receiving sunitinib. Journal of
Translational Medicine 2011 9:120.
Submit your next manuscript to BioMed Central
and take full advantage of:
• Convenient online submission
• Thorough peer review
• No space constraints or color figure charges
• Immediate publication on acceptance
• Inclusion in PubMed, CAS, Scopus and Google Scholar
• Research which is freely available for redistribution
Submit your manuscript at
www.biomedcentral.com/submit
Harmon et al. Journal of Translational Medicine 2011, 9:120
/>Page 14 of 14