Báo cáo sinh học: "CGB and GNRH1 expression analysis as a method of tumor cells metastatic spread detection in patients with gynecological malignances" potx
Bạn đang xem bản rút gọn của tài liệu. Xem và tải ngay bản đầy đủ của tài liệu tại đây (579.05 KB, 9 trang )
RESEARCH Open Access
CGB and GNRH1 expression analysis as a method
of tumor cells metastatic spread detection in
patients with gynecological malignances
Mirosław Andrusiewicz
1
, Anna Szczerba
1
, Maria Wołuń-Cholewa
1
, Wojciech Warchoł
2
, Ewa Nowak-Markwitz
3
,
Emilia Gąsiorowska
3
, Krystyna Adamska
4
and Anna Jankowska
1*
Abstract
Background: Metastasis is a common feature of many advanced stage cancers and metastatic spread is thought
to be responsible for cancer progression. Mo st cancer cells are localized in the primary tumor and only a small
population of circulating tumor cells (CTC) has metastatic potential. CTC amount reflects the aggressiveness of
tumors, therefore their detection can be used to determine the prognosis and treatment of cancer patients.
The aim of this study was to evaluate human chorionic gonadotropin beta subunit (CGB) and gonadoliberin type 1
(GNRH1) expression as markers of tumor cells circulating in peripheral blood of gynecological cancer patients,
indicating the me tastatic spread of tumor.
Methods: CGB and GNRH1 expression level in tumor tissue and blood of cancer patients was assessed by real-time
RT-PCR. The data was analyzed using the Mann-Whitney U and Spearman tests. In order to distinguish populations
with homogeneous genes’ expression the maximal likelihood method for one- and multiplied normal distribution
was used.
Result: Real time RT-PCR results revealed CGB and GNRH1 genes activity in both tumor tissue and blood of
gynecological cancers patients. While the expression of both genes characterized all examined tumor tissues, in
case of blood analysis, the transcripts of GNRH1 were found in all cancer patients while CGB were present in 93%
of patients. CGB and GNRH1 activity was detected also in control group, which consisted of tissue lacking
cancerous changes and blood of healthy volunteers. The log-transformation of raw data fitted to multiplied normal
distribution model showed that CGB and GNRH1 expression is heterogeneous and more than one population can
be distinguished within defined groups.
Based on CGB gene activity a critical value indicating the presence of cancer cells in studied blood was
distinguished. In case of GNRH1 this value was not established since the results of the gene expression in blood of
cancer patients and healthy volunteers were overlapping. However one subpopulation consists of cancer patient
with much higher GNRH1 expression than in control group was found.
Conclusions: Assessment of CGB and GNRH1 expression level in cancer patients’ blood may be useful for
indicating metastatic spread of tumor cells.
Keywords: human chorionic gonadotropin beta subunit, gonadotropin releasing hormone type 1, real time
RT-PCR, CTC
* Correspondence:
1
Department of Cell Biology, Poznan University of Medical Sciences,
Rokietnicka Street 5D, 60-806 Poznan, Poland
Full list of author information is available at the end of the article
Andrusiewicz et al. Journal of Translational Medicine 2011, 9:130
/>© 2011 Andrusiewicz et al; licensee BioMed Central Ltd. This is an Open Access article distributed under the terms of the Creative
Commons Attribut ion License (http://creat ivecommons.org/licenses/by/2.0), which permits unrestricted use, distribution, and
reproduction in any medium, provided the original work is properly cited.
Background
Neoplastic diseases repr esent chaoti c self-developi ng sys-
tems, in which genetically destabilized cells replicate them-
selves continuously [1]. Within each replication cycle they
produce new, modified daughter cells [2,3]. The accumula-
tion of genetic alternations increases genetic instability [4].
During this process several different cell lines with differ-
ent gene expression profile might co-exist within one
tumor [5-10]. Cancer cells and their metastatic progeny
retain the capacity for self-evolution [1]. New cell variants
are better adapted to local growth requirements and might
survive or undergo apoptosis [11,12].
Tumors with a high degree of genetic instability are
able to produce more cells, thereby providing a larger
reservoir for new, better adapted variants. This corre-
sponds to develo pment from preneop lastic to invasive
cancer and consequently worse prognosis [4,13-15].
Some cancer cells posses the ability to penetrate the
walls of blood vessels, circulate in the bloodstream and
reach other niches of the body. These circulating tumor
cells (CTC) are thought to be responsible for metastatic
spread and cancer progression. Therefore detection of cir-
culating tumor cells may be important for both diagnosis
and treatment of cancer patients [16-19].
While most cancer cells (CC) are localized in the pri-
mary tumor, there is only a small population of circulating
cancer cells having metastatic potential. The frequency of
CTC occurrence in peripheral blood is estimated to be 1
cancer cell per 10
5-7
mononuclear cells [20]. Nevertheless
their presence and amount reflect the aggressiveness of
tumors [21,22].
Recently highly sensitive methods have been devel-
oped to detect CTC in blood of cancer patients. These
methods include flow cytometry, immunohistochemistry
and real time RT-PCR [23-27]. Still, most of these meth-
ods do not seem to be sensitive enough to detect CTC
in patients with early-stage carcinomas [28-31].
The objective of this study was to use quantitative real
time RT-PCR and analyze the expression level of two
genes: human chorionic gonadotropin beta subunit (CGB)
and gonadotropin releasing hormone type 1 (gonadoli-
berin type 1, GNRH1) in order to detect CTC in peripheral
bloo d of gynecologica l cancer pat ients. The research was
undertaken to establish the sensitivity and specificity o f
the genes activity as an informative way to identify tumor
cells of gynecologica l origin in blood of cancer patie nts,
which can indicate metastatic spread of tumor cells.
These two genes were selected because a number of
studies have demonstrated that their expression level is
up-regulated in gynecological tumors [32-38].
Serum free CGB or its urinary degradation product
beta-core fragments are found in 68% of ovarian, 51% of
endometrial and 46% of cervical malignancies [32]. Our
earlier study proved that CGB is expressed by analyzed
gynecological tumor tissues [33-35]. The free beta subu -
nit of human chorionic gonadotropin was originally con-
sidered as biologically non-functional, however it was
shown recently that CGB may stimulate tumor growth
and inhibit its apoptosis. This theory is supported by
the results of CGB genes silencing, showing that reduc-
tion of the hormone’ sexpressionin vitro resulted in
increased apoptosis rate of cancer cells [36]. Further-
more elevated CGB level in serum was found to be asso-
ciated with higher aggressiveness of cancer and its
resistance to therapy [32].
In ovarian, endometrial, mammary, and prostate cancers
significant level of GNRH1 expression was also detected
and the agonists of GNRH1 have been shown to inhibit
proliferation and stimulate apoptosis of ovarian and endo-
metrial carcinoma cells [37]. We have previously demon-
strated that the expression of CGB in endometrial cancer
as well as in endometrial atypical hyperplasia is accompa-
nied by expression of gonadotopin releasing-hormone
type 1 [38].
In this study we showed that the up-regulation of
human c horionic gonadotropin beta subunit and gona-
doliberin type 1 genes expression may indicate the pre-
sence of tumor cells circulating in peripheral blood of
gynecological cancer patients. Thus, the expre ssion of
CGB and GNRH1 maybecomeaprognosticfactorof
metastatic spread of tumor cells [38].
Materials and methods
Patients
Surgical specimens of gynecological cancer tissue have
been obtained f rom 48 patients (age range 36-79) trea-
ted with surgery at the Department of Gynecologic
Oncology, Poznan University of Medical Sciences. Per-
ipheral blood from 41 cancer patients (age range 36-79)
was collected before surgery. None of the patients
received chemo- or radiotherapy prior to the operation.
Histology groups were as follows: ovarian carcinoma (25
cases; FIGO: I, n = 4; II, n = 1; III, n = 14; not determi-
nate, n = 6), endometrial carcinoma (14 cases, FIGO
not evaluated), uterine cervix carcinoma (9 cases; FIGO
0, n = 1; I, n = 4; II, n = 2; III, n = 0; not determinate,
n = 2).
The control group consisted of blood from 43 healthy
volunteers (age range 21 - 56) and 12 control tissue
samples lacking pathological changes. The absence of
cancerous changes has been confirmed by anatomico-
pathologic macroscopic and micro scopic examinations.
These tissue samples were obtained from patients oper-
ated for reasons other than cancer. The study was
approved by the Institutional Ethics Review Board of
Poznan University of Medical Sciences. All patients and
Andrusiewicz et al. Journal of Translational Medicine 2011, 9:130
/>Page 2 of 9
volunteers participated in the research after obtaining
informed consent.
Sample collection
9 ml of blood from the patients and from the volunteers
was collected in S-monovette tubes (SARSTEDT AG &
Co., Numbrecht, Germany). The blood samples where
diluted with PBS (without Ca
2+
and Mg
2+
)upto17ml.
The PfU blood separation tubes and LSM 1077 separation
medium (PAA Laboratories GmbH, Pasching, Austria)
were used to separate the cells during centrifugation at
1200 × g for 20 minutes at room temperature in a swing-
ing bucket rotor. Cells located in the interphase were col-
lected and washed twice with 10 ml of PBS. The cells were
resuspended in 1.5 ml TRIzol LS Reagent (Invitrogen, CA,
USA) and stored at -80°C until total RNA isolation was
performed.
Tissue samples from patients after surgical removal
were placed in RNALater and stored at -80°C.
RNA isolation and cDNA synthesis
Total cellular RNA from blood and tissue samples was
extracted with TRIzol LS Reagent (Invitrogen) and TriPure
Isolation Reagent (Roche Diagnostic GmbH, Mannheim,
Germany) respectively, according to manufacturer’sproto-
cols. RNA purity and concentration was determined spec-
trophotometrically and electrophoretically in 1.2% agarose
gel containing 1.5% formaldehyde (Sigma-Ald rich, USA)
in FA buffer (20 mM MOPS, 5 mM sodium acetate,
1 mM EDTA, 200 mM paraformaldehyde; pH 7.0; Sigma-
Aldrich).
2 μg of total RNA was used for cDNA synthesis. Mix-
ture of RNA, universal oligo (d)T
10
primer and RNase-
free water was incubated at 65°C for 10 minutes in order
to denature RNA secondary structure. Then the mixture
was placed on ice and other components: 500 mM
dNTPs, 10 nM DTT, 20 U ribonuclease inhibitor, 5 ×
reverse transcriptase buffer and 50 U of Transcriptor
Reverse Transcriptase were added. mRNA was reversely
transcribed at 5 5°C for 30 minutes. It was followed by
enzyme inactivatio n at 85°C for 5 minutes. cDNA was
placed on ice or stored at -20°C until real time PCR was
performed. All compounds used for cDNA synthesis
were purchased from Roche Diagnostic (Roche Di agnos-
tic, Mannheim, Germany).
Real time PCR
To asses the expression level of CGB [NCBI:
NM_000737] and GNRH1 [NCBI: NM_000825.3] genes
real time PCR with sequence specific primers and Light-
Cycler
®
TaqMan
®
MasterKit(RocheDiagnostics)has
been performed. PCR reaction mixtur e contained: 5 μlof
cDNA , 1x Taq Man Master mi x, 0.1 μM hydrolysis probe
(TaqMan) and 0.5 μM of the primers. The primers were
designed to be complementary to the spl ice junction,
what excluded the possibility of DNA amplification.
Hydrolysis probes and prime rs used are describe d in
table 1. TaqMan h ydrolysis probe for examined genes
and phosphoribosyltransferase (HPRT) housekeeping
gene were purchased from Universal Probe Library
(Roche Diagnostic).
The program of PCR consisted of 1 cycle of 95°C with
a 10 minute hold, followed by 45 cycles of 95°C with a
10 seconds hold, annealing/amplification temperature at
60°C with a 30 seconds hold, and 72°C with a 1 seconds
hold for fluorescence data acquisition.
All experiments were performed in triplicates. PCR
efficiencies were calculated from the standard curves
(SC) generated using serial decimal dilutions of cDNA
synthesized from placenta. A relati ve expres sion level of
analyzed genes was normalized with control gene -
HPRT. The final step of the expression level analysis
was the calculation of the CGB/HPRT and GNRH1/
HPRT concentration ratio (Cr).
The PCR products were sequenced to confirm their
identity.
Data collection and Statistical analysis
Real time PCR data was assembled using the LightCycler
computer application software 4.05 dedicated for the
LightCycler 2.0. All data was analyzed using the Statistica
Software ver. 6.0 (StatSoft, Poland).
The Mann-Whitney U test was performed and the dif-
ferences were considered to be statistically significant if
P-value was lower than 0.05.
CGB and GNRH1 concentration ratios were log-trans-
formed to achieve normal distribution of data.
In order to distinguish popu lations with hom ogeneous
genes’ expression the maximal likelihood method for one-
and multiplied normal distribution was used.
Relative levels of CGB and GNRH1 expre ssion between
studied groups were correlated using Spearman’sRank
Correlation test and the results were considered to be
statistically significant if P-value was lower than 0.05.
Results
The expression of CGB and GNRH1 was evaluated for
gynecological tumor tissue and peripheral blood of
patients with gynecological cancer using real time RT-
PCR method. PCR products identity was confirmed by
sequencing.
The results of the study demonstrated that both genes
are active in all analyzed tumors samples. Although the
genes ac tivity can be detected in control tissue lacking
cancerous changes, the level of expression was significantly
lowe r than the one found in cancer tissues (Figure 1 and
2). The differences between CGB and GNRH1 genes
exp ression in can cer tis sue and healthy tissue was f ound
Andrusiewicz et al. Journal of Translational Medicine 2011, 9:130
/>Page 3 of 9
to be statistically significant (P = 0.000000 and P=
0.001037, respectively).
CGB and GNRH1 transcripts were found also in per-
ipheral blood of gynecological cancer patients as well as
in blood of healthy volunteers (Figure 3 and 4). None-
theless CGB expression in blood of healthy volunteers
and patients with cancer differed significantly (P=
0.001066) and was higher in blood of cancer patients. In
case of GNRH1 analysis the difference of the gene activ-
ity between studied groups was not statistically signifi-
cant; P=0.6098.
Due to the nature of the measurement real time RT-
PCR data was log-transformed and then analyzed
against existence of potential subpopulations varying in
gene expression. Models of one, two and three coexist-
ing subpopulations were taken into account and then
evaluated using the m aximal likelihood method. The
outcome of this analys is was tested with F-test to assess
the i mprovement of quality of the fit. Model of higher
comp licity (with greater number of subpopulations) was
selected only if statistical significance of improvement
(P < 0.05) was achieved. Additional verification of
correctness of the chosen model was performed using
Kolmogorov-Smirnov test. In this test all cases obtaine d
P > 0.7. The final results showed that the model, which
assumes the presence of more than one normal distribu-
tion components, is significantly better for describing
heterogeneous expression of CGB and GNRH1 genes
within studied groups.
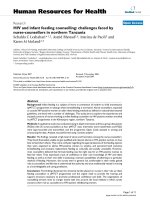
In case of CGB expression analysis in tissues la cking
cancerous changes only one distribution of results for
each group was established (Figure 1A; Table 2). CGB
expression in tumor tissues was categorized into two
normal distributions (Figure 1B; Table 2). One of these
distributions characterized by low level CGB activity
(mean of log
10
of CGB expression: -2.13, Table 2) corre-
sponded to the results obtained for tumor blood (mean
of log
10
of CGB expression:-2.34,Table2).Theother
one with distinctly higher level of the gene expression
(mean of log
10
of CG B expression: -1.35, Table 2) was
typical for cancer tissue only.
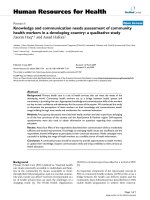
The blood of cancer patients was characterized by one
distribution of CGB expression only (Figure 3B) while
blood of healthy volunteers was categorized into two
subpopulations (Figure 3A).
CGB expression analysis in healthy volunteers’ blood
showed that this group can be divided into two subpo-
pulations: one with low expression (smaller than -6.56)
and the second one with high expression level of CGB
(-3.80). The second population partially overlaps with
distribution of CGB expression found for blood of can-
cer patients. Thus, in this particular case instead of
usually using three sigma rules we applied -2.5 value to
estimate the confidence limit, in which 95% of healthy
volunteer had expression lowe r then critical v alue typi-
cal for cancer patients.
The raw results of GNRH1 expression were fitted to
one, two or three coexisting subpopulations, each with
Table 1 Primers and hydrolysis probes used in real-time PCR
Gene TaqMan probe No Forward primer 5’®3’ Reverse primer 5’®3’
CGB #71
Roche Diagnostic, Cat. No: 04688945001
TACTGCCCCACCATGACC CACGGCGTAGGAGACCAC
GNRH1 #29
Roche Diagnostic, Cat. No: 04687612001
GACCTGAAAGGAGCTCTGGA CTTCTGGCCCAATGGATTTA
HPRT Human HPRT Gene Assay (Roche Diagnostic, Cat. No: 05046157001)
Figure 1 CGB gene expression in tissue lacking of cancerous changes (A) and tumor tissue (B). Relative expression levels are presented as
the logarithm to the base 10. In order to distinguish populations with homogeneous genes’ expression the maximal likelihood method for one-
and multiplied normal distribution was used. The histograms include one (A) and two (B) normal distribution of CGB expression. In case of tumor
tissue (B) two normal distributions’ sum create the final approximation - higher curve in the graph.
Andrusiewicz et al. Journal of Translational Medicine 2011, 9:130
/>Page 4 of 9
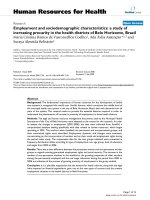
normal distribution, and the model showed that one and
two subpopulations can be set in control tissue lacking
cancerous changes (Figure 2A) and control blood o f
healthy volunteers (Figure 4A), respectively (Table 2). In
tumor tissue and blood of cancer patients three subpo-
pulations with different levels of GNRH1 expression
were established (Figure 2B and 4B).
Log-transformed results of GNRH1 expression in
blood of cancer patient and in tumor tissue showed
remarkably similar distributions (Figure 2B and 4B,
Table 2). Two of these distributions found in tumor
blood corresponded to lower level of the gene activity
(GNRH1 mean in tumor blood: 0.79 and 1.13 and in
tumor tissue: 0.54 and 1.37). Furthermore in both cases
the distribution matched to extremely high activity of
GHNRH (Figure 2B and 4B) was found.
For GNRH1 critical value was not established since
the results of the gene expression in blood of cancer
patients and healthy volunteers were overlapping.
No correlation between CGB and GNRH1 expression
(Table 3) as well as clinical data (Table 4) in studied tis-
sues and blood was observed.
Discussion
The critical role of circulating tumor cells in metastatic
spread of carcinomas has already been very well docu-
mented. However the biology of these cells is poorly
understood and the clinical relevance of their detection
is still the subject of controversies. Available markers
fail to distinguish between subgroups of CTC, and sev-
eral current methods of CTC characterization and
detection lack sensitivity, specificity and reproducibility
[39].
Still early detec tion of these cells can become a useful
method allowing the identification of cells with metastatic
potential, and thus may be important for treatment and
monitoring of cancer patients. RT-PCR based tech niques
and expression analysis of epithelial- and tissue-specific
Figure 2 GNRH1 expression in tissue lacking cancerous changes (A) and tumor tissue (B). Relative expression levels are presented as the
logarithm to the base 10. The maximal likelihood method for one- and multiplied normal distribution of GNRH1 expression was used and one
normal distribution was obtained for control tissue (A) where for tumor tissue three normal distribution was found (B). The higher curve
presented on the graph represents the sum of these three distributions (B).
Figure 3 CGB expression in peripher al blood of healthy volunteers ( A) and patients with cancer (B) .Relativeexpressionlevelsare
presented as the logarithm to the base 10. CGB activity was fitted to two (A) and one normal distribution (B) in blood of healthy volunteers and
cancer patients, respectively. The final approximation of CGB expression curve in control blood (A) is hidden due to the presence of non-
overlapping components.
Andrusiewicz et al. Journal of Translational Medicine 2011, 9:130
/>Page 5 of 9
markers are the most sensitive methods for CTC detec-
tion. Results of numerous studies indicate that detection
of single mRNA markers like mamoglobin, survivin,
HER2, E GFR, VEGF and VEGFR range from 30 to 63%
cases in peripheral blood of breast cancers. After combina-
tion of a few markers as one sing le panel the sensitivity
usually increases [40]. A panel of six genes: CCNE2,
DKFZp1312, PPIC, EMP2, MAL2 and SLC6A8 may serve
as potential m arkers for CTC derived from breast, endo-
metrial, cervical, and ovarian cancers [41]. Also mamoglo-
bin gene expression is a sensitive molecular marker for
tumor spread detection in not only in patients with breast
cancer but also gynecological neoplasms [42]. CTC pre-
sence analyzed with Adna Breast Test (detection of
EpCAM-, MUC-1-, and HER-2-transcripts) together with
CA 125 assessment were shown to be of prognostic signif-
icance in gynecological cancers [43]. Similarly endothelial
progenitor cell expressing CD43 and VEGFR2 circulating
in the blood of patients with ovarian cancer may be a
potential marker to monitor cancer progression and
angiogenesis as well as treatment response [44].
Our study identifies two mRNA markers of gynecolo-
gical cancers: human chorionic gonadotropin beta
subunit (CGB) and gonadotropin releasing-hormone
type 1 (GNRH1), which enable detection of circulating
tumor cells.
We have previously demon strated that CGB is a valu-
able marker of tumor tissue of uterine cervix, endome-
trium and ovary. CGB gene activity in cancer and
atypical hyperplasia of endometrium is accompanied by
the expressio n of gonadoliberin type 1, which physiolo-
gically stimulates the synthesis and secretion of gonado-
tropins [33-35].
In this study the presence of cells expressing CGB and
GNRH1 in tumor tissue and blood of gynecological can-
cer patients was confirmed with real time RT-PCR. The
results demonstrated that both genes are active in all
analyzed tumor samples. CG B and GNRH1 transcripts
were detec ted also in c ontrol tissue lacking cancerous
changes, however t he expression level of CGB gene in
control group was significantly statistically lower than in
cancer group. Similarly both genes expression was
demonstrated in peripheral blood of gynecological cancer
patients as well as in control group consisting of healthy
volunteers’ blood. The level of CGB expression in blood
of cancer patients and in blood of healthy volunteers
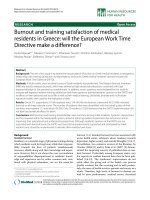
Figure 4 GNRH1 expression in peripheral blood of healthy volunteers (A) and patients with cancer (B).Relativeexpressionlevelsare
presented as the logarithm to the base 10. Analysis of GNRH1 expression blood of healthy volunteers (A) and patients with cancer (B) in both
cases showed two distributions of results. The higher curve represents the sum of these two distributions.
Table 2 The distributions of CGB and GNRH1 genes expression within studied groups
Material I II III
Subpopulation
[%]
Mean SD Subpopulation
[%]
Mean SD Subpopulation
[%]
Mean SD
CGB Tumor (tissue) 36.8 -2.13 1.87 63.2 -1.35 0.62
CGB Control (tissue) 100 -4.25 0.51
CGB Tumor (blood) 100 -2.34 1.98
CGB Control (blood) 24.2 -6.56 0.53 75.8 -3.80 0.79
GNRH1 Tumor (tissue) 43.5 0.54 0.22 43.4 1.37 1.08 13.1 9.79 1.10
GNRH1 Control (tissue) 100 0.21 0.50
GNRH1 Tumor (blood)* 49.0 0.79 0.21 46.0 1.13 1.00 5.0* * *
GNRH1 Control (blood) 63.0 0.88 0.48 37.0 0.97 0.08
SD - standard deviation; * - two cases were excluded because they were found more then 10000 times higher than rightmost case from others.
Andrusiewicz et al. Journal of Translational Medicine 2011, 9:130
/>Page 6 of 9
differed significantly while GNRH1 activity in the studied
groups was not statistically significant.
Due t o the nature of real time RT-PCR measurement
the levels of CGB and GNRH1 relative expression were
log-transformed and fitted to multiplied normal distri-
bution model using the maximal likelihood method. The
results of the conversions showed that the model
assumingthepresenceofmorethanonenormaldistri-
bution components improved the description of hetero-
geneous expression of studied genes.
Analysis of CGB and GNRH1 expression in tissue
lacking cancerous c hanges showed one distribution of
results for both genes. In case of tumor tissue CGB and
GNRH1 activity were fitted into two and three normal
distribution, r espectively. The first population showing
lower expression of CGB (mean of log
10
of CGB expres-
sion: -2.13) consisted of 36.8% of tissues, while the sec-
ond with higher CGB activity (mean of log
10
of CGB
expression: - 1.35) included 63.2% of samples. Two dis-
trib ution of GNRH1 with lower (mean: 0.54) and higher
expression level (mean: 1.37) comprised of almost the
same number of analyzed tissues (43.5%). The third dis-
tribution corresponded to the maximum gene activity
with mean of log
10
GNRH1 expression equal to 9.79 and
includes 13% of examined samples. These samples may
represent tissues producing maximal level of GNRH1 or
tissue fragments containing higher number of cancer
cells. Immunohistochemical analysis could verify these
hypotheses
CGB and GNRH1 activity was studie d also in blood of
gynecological cancer patients and was compared to the
control blood of healthy volunteers.
In control blood both genes were fitted into two distri-
butions. However, GNRH1 distributions overlapped
(mean: 0.88 and 0.97) and CGB distributions were s epa-
rated from each other (mean: -6.56 and -3.8). The resul ts
showed that in case of CGB analysis in 95% of the popula-
tion the gene expression is lower than -2.5, which indi-
cates the lack of circulating tumor cells. In contrast 5% of
control blood was shown to have CGB expression higher
than -2.5. Thus, this critical value may be used to indicate
the metastatic spread of tumor.
There is no defined explanation o f CGB and GNRH1
activity noted both in control tissue lacking cancerous
changes and blood of healthy volunteers. False-positive
CG cases have been already reported before, though the
elevated level of the hormone was detected only on pro-
tein level [45-48]. In these cases the presence of heter o-
philic antibodies was thought to be the reason for false-
positive CG. In our study the activity of CGB and
GNRH1 was detected on mRNA level. Sequence specific
primers and hydrolysis probes used in real time PCR
study excluded the possibility of false-positive results in
case of both genes amplification. This implies that cells
with altered gene expression can exist in healthy tissue.
Even if the number of these cells is very small high sen-
sitivity of real time RT-PCR enables their detection.
Consequently, not only the presence of genes’ tran-
scripts but also the level of their expression should be
verified in case of tumor cells detection.
Analysis of CGB expression transformed results in
blood of gynecological patients revealed the presence of
one d istribution. One of the two distributions found in
control group overlapped partially with CGB detected in
cancer patients. Nonetheless maximal CGB expressio n
level found is some cancer patients was 10
5
higher than
maximal activity of the gene of given healthy volunteers.
Thus, it may be concluded that the high activity of
human chorionic gonadotropin beta subunits indicated
thepresenceoftumorcellscirculatinginbloodof
patients.
The raw results of GNRH1 expression in blood of can-
cer patients was fitted to three normal distributions.
Two of these distributions corresponding to lower level
of the g ene activity (mean of log
10
of GNRH1 expres-
sion: 0.79 and 1.13) were similar to these observed in
tumor tissue and control blood. Additionally in blood of
cancer patients as well as in tumor tissue a third subpo -
pulation corres ponding to extremely high activity of
GNRH1 (Figure 2B and 4B) was found. This activity wa s
10
5
higher than in other cases which may indicate
patients in metastasis stage.
Analysis of results demonstrated that in part of the
studied blood samples of cancer patients activity of CGB
and GNRH1 wasonthesamelevelasincontrolgroup.
There is no defined explanation of this fact, however
some possibilities should be considered. The simplest
one is based o n the presumption that examined patients
Table 3 The correlation between CGB and GNRH1 genes
expression within studied groups
Material CGB/GNRH1
P value
Tumor (tissue) 0.128
Control (tissue) 0.164
Tumor (blood) 0.115
Control (blood) -0.089
Statistical significance P < 0.05.
Table 4 The correlation between CGB and GNRH1 genes
expression in different cancer types
Material CGB/GNRH1
P value
Enodometrial cancer 0.961
Ovarian 0,234
Uterix 0,932
Statistical significance P < 0.05.
Andrusiewicz et al. Journal of Translational Medicine 2011, 9:130
/>Page 7 of 9
simply lacked CTC, which is probably especially that
patients in early cancer stages were examined. Another
possibility is that the cells were present but their num-
ber was so small that we were not able to detect them.
In fact many authors admit to the inability to detect cir-
culating tumor cells because of their small number, indi-
cating insufficient capa city of CTC isolation methods
[49]. Another possibility is that tumor progression
enhances its heterogeneity, clonal selection, and variable
expression of individual mRNA markers [50,51].
When designing this study, we assumed that cancer
cells that spread from a primary tumor, and penetrate
the bloodstream have metastatic potential and show a
sim ilar profile of gene expression to the cells present in
the initial t umor mass. According to the theory of
tumor cellular heterogeneity and its genetic instability
once CTC detach from a primary tumor they may
change their expression profile, adapting to new micro-
environment [52]. What is more it can not be excluded
that analysed gynecological cancer types might not
metastasize primarily via the h ematogenous route, thus
CTC could be even rarer events than expected.
Still based on the results of analyzed genes activity in
blood of volunteers and cancer patients the presence of
cancer cells can be distinguished. High expression level
in case of CGB and GNRH1 expression allowed identify-
ing four and two individuals, respectively as cancer
patients havin g tumor cell circulating in the blood flow.
High CGB activity was found in blood of three patients
with ovarian carcinoma (FIGO II, n = 1; III, n = 2) and
one patient with endometrial cancer. GNRH1 expression
was detected in two patients with ovarian carcinoma
(FIGO II, n = 1; III, n = 1). The expression level o f the
genes assessed in blo od of these patients was 10
5
higher
than the genes activity observed in control group.
Our study demonstrated that CTC-related markers’
expression may be heterogeneous therefore establishing
a critical level of genes expression may be useful in
order to recognize the spread of cancer cells. Defining
such a “cutoff value” maybeappliednotonlyforCGB
and GNRH1 expression but also other genes used as
CTC markers. Especially that most of previously pub-
lished data are limited to showing the percentage of
positive cancer patients without any presentation of the
number of positive healthy controls [40].
No correlation between CGB and GNRH1 expression
in studied tissues and bloods as well as clinica l data was
observed (P >0.05).Thissuggeststhatanalyzedgenes’
expression profiles are independent of one another as
well as of cancer type. The studies on the mechanisms
regulating these genes activity may help explain the
observed phenomenon.
Conclusions
The asse ssment of human chorionic gonadotropin beta
subunit and gonadoliberin type 1 expression levels in
blood of cancer patients may allow distinguishing
patients with tumor cells circulating in their blood and
indicate the metastatic spread of these cells.
Acknowledgements
This study was supported by the Polish Ministry of Science and Higher
Education Awards: NN 407109533, NN 407275439.
Author details
1
Department of Cell Biology, Poznan University of Medical Sciences,
Rokietnicka Street 5D, 60-806 Poznan, Poland.
2
Department of Biophysics,
Poznan University of Medical Sciences, Fredry Street 10, 61-701 Poznan,
Poland.
3
Department of Gynecologic Oncology, Poznan University of Medical
Sciences, Polna Street 33, 60-535 Poznan, Poland.
4
The Great Poland Cancer
Center in Poznan, Garbary Street 15, 61-688 Poznan, Poland.
Authors’ contributions
AM, AS, AJ participated in the study design, carried out the molecular
genetic studies and performed data analysis. AJ has been involved in
coordination of the study and drafting the manuscript. MWC, WW performed
the statistical analysis and interpretation of data. ENM, EG, KA collected
surgical tissue and blood samples, performed anatomicopathologic
macroscopic and microscopic examinations and delivered clinical patients’
data. All authors read and accepted the final manuscript.
Competing interests
The authors declare that they have no competing interests.
Received: 30 December 2010 Accepted: 9 August 2011
Published: 9 August 2011
References
1. Crespi B, Summers K: Evolutionary Biology of Cancer. Trends Ecol Evol
2005, 20:545-552.
2. Merlo LM, Pepper JW, Reid BJ, Maley CC: Cancer as an evolutionary and
ecological process. Nat Rev Cancer 2006, 6:924-935.
3. Coffey DS: Self-organization, complexity and chaos: the new biology for
medicine. Nat Med 1998, 4:882-885.
4. Hanahan D, Weinberg RA: The hallmarks of cancer. Cell 2000, 100:57-70.
5. Fujii H, Marsh C, Cairns P, Sidransky D, Gabrielson E: Genetic divergence in
the clonal evolution of breast cancer. Cancer Res 1996, 56:1493-1497.
6. Shankey SE, Shankey TV: Genetic and phenotypic heterogeneity of
human malignancies: finding order in chaos. Cytometry 1995, 21:2-5.
7. Zhang W, Grossman D, Takeuchi S: Colonization of adjacent stem cell
compartments by mutant keratinocytes. Semin Cancer Biol 2005, 15:97-102.
8. Braakhuis BJ, Leemans CR, Brakenhoff RH: Expanding fields of genetically
altered cells in head and neck squamous carcinogenesis. Semin Cancer
Biol 2005, 15:113-120.
9. Maley CC, Galipeau PC, Finley JC, Wongsurawat VJ, Li X, Sanchez CA,
Paulson TG, Blount PL, Risques RA, Rabinovitch PS, Reid BJ: Genetic clonal
diversity predicts progression to esophageal adenocarcinoma. Nature
Genet 2006, 38:468-473.
10. Gonzalez-Garcia I, Sole RV, Costa J: Metapopulation dynamics and spatial
heterogeneity in cancer. Proc Natl Acad Sci USA 2002, 99:13085-13089.
11. Nunney L: The population genetics of multistage carcinogenesis. Proc
Biol Sci 2003, 270:1183-1191.
12. Michor F, Frank SA, May RM, Iwasa Y, Nowak MA: Somatic selection for
and against cancer. J Theor Biol 2003, 225:377-382.
13. Duesberg P, Rausch C, Rasnick D, Hehlmann R: Genetic instability of
cancer cells is proportional to their degree of aneuploidy. Proc Natl Acad
Sci USA 1998, 95:13692-13697.
14. Loeb LA: Cancer cells exhibit a mutator phenotype. Adv Cancer Res 1998,
72:25-56.
Andrusiewicz et al. Journal of Translational Medicine 2011, 9:130
/>Page 8 of 9
15. Berman JJ, Moore GW: The role of cell death in the growth of
preneoplastic lesions: a Monte Carlo simulation model. Cell Prolif 1992,
25:549-557.
16. Watanabe Y, Satou T, Nakai H, Etoh T, Dote K, Fujinami N, Hoshiai H:
Evaluation of parametrial spread in endometrial carcinoma. Obstet
Gynecol 2010, 116:1027-1034.
17. Chiang AC, Massagué J: Molecular basis of metastasis. N Engl J Med 2008,
359:2814-2823.
18. Gerges N, Rak J, Jabado N: New technologies for the detection of
circulating tumour cells. Br Med Bull 2010, 94:49-64.
19. Jacob K, Sollier C, Jabado N: Circulating tumor cells: detection, molecular
profiling and future prospects. Expert Rev Proteomics 2007, 4:741-756.
20. Ross AA, Cooper BW, Lazarus HM, MacKay W, Moss TJ, Ciobanu N,
Tallman MS, Kennedy MJ, Davidson NE, Sweet D, Winter C, Akard L, Jansen J,
Copelan E, Meagher RC, Herzig RH, Klumpp TR, Kahn DG, Warner NE:
Detection and viability of tumor cells in peripheral blood stem cell
collections from breast cancer patients using immunocytochemical and
clonogenic assay techniques. Blood 1993, 82:2605-2610.
21. Cristofanilli M, Budd GT, Ellis MJ, Stopeck A, Matera J, Miller MC, Reuben JM,
Doyle GV, Allard WJ, Terstappen L, Hayes DF: Circulating tumor cells,
disease progression, and survival in metastatic breast cancer. New Engl J
Med 2004, 351:781-791.
22. Cohen SJ, Punt CJ, Iannotti N, Saidman BH, Sabbath KD, Gabrail NY, Picus J,
Morse MA, Mitchell E, Miller MC, Doyle GV, Tissing H, Terstappen LW,
Meropol NJ: Prognostic significance of circulating tumor cells in patients
with metastatic colorectal cancer. Ann Oncol 2009, 20:1223-1229.
23. Cruz I, Ciudad J, Cruz JJ, Ramos M, Gómez-Alonso A, Adansa JC,
Rodríguez C, Orfao A: Evaluation of multiparameter flow cytometry for
the detection of breast cancer tumor cells in blood samples. Am J Clin
Pathol 2005, 123:66-74.
24. Fabisiewicz A, Kulik J, Kober P, Brewczyńska E, Pieńkowski T, Siedlecki JA:
Detection of circulating breast cancer cells in peripheral blood by a two-
marker reverse transcriptase-polymerase chain reaction assay. Acta
Biochim Pol 2004, 51:747-755.
25. Turner RR, Giuliano AE, Hoon DS, Glass EC, Krasne DL: Pathologic
examination of sentinel lymph node for breast carcinoma. World J Surg
2001, 25:798-805.
26. Stathopoulou A, Gizi A, Perraki M, Apostolaki S, Malamos N, Mavroudis D,
Georgoulias V, Lianidou ES: Real-time quantification of CK-19 mRNA-
positive cells in peripheral blood of breast cancer patients using the
lightcycler system. Clin Cancer Res 2003, 9:5145-5151.
27. Chen CC, Hou MF, Wang JY, Chang TW, Lai DY, Chen YF, Hung SY, Lin SR:
Simultaneous detection of multiple mRNA markers CK19, CEA, c-Met,
Her2/neu and hMAM with membrane array, an innovative technique
with a great potential for breast cancer diagnosis. Cancer Lett 2006,
28
:279-288.
28. Redding WH, Coombes RC, Monaghan P, Clink HM, Imrie SF, Dearnaley DP,
Ormerod MG, Sloane JP, Gazet JC, Powles TJ, Neville AM: Detection of
micrometastases in patients with primary breast cancer. Lancet 1983,
3:1271-1274.
29. Leather AJ, Gallegos NC, Kocjan G, Savage F, Smales CS, Hu W, Boulos PB,
Northover JM, Phillips RK: Detection and enumeration of circulating
tumour cells in colorectal cancer. Br J Surg 1993, 80:777-780.
30. Datta YH, Adams PT, Drobyski WR, Ethier SP, Terry VH, Roth MS: Sensitive
detection of occult breast cancer by the reverse-transcriptase
polymerase chain reaction. J Clin Oncol 1994, 12:475-482.
31. Alunni-Fabbroni M, Sandri MT: Circulating tumour cells in clinical practice:
Methods of detection and possible characterization. Methods 2010,
50:289-297.
32. Muller CY, Cole LA: The quagmire of hCG and hCG testing in gynecologic
oncology. Gynecol Oncol 2009, 112:663-672.
33. Nowak-Markwitz E, Jankowska A, Szczerba A, Andrusiewicz M: Human
chorionic gonadotropin-beta in endometrium cancer tissue. Eur J
Gynaecol Oncol 2004, 25:351-354.
34. Nowak-Markwitz E, Jankowska A, Szczerba A, Andrusiewicz M, Warchoł JB:
Localization of human chorionic gonadotropin beta subunit transcripts
in ovarian cancer tissue. Folia Histochem Cytobiol 2004, 42:123-126.
35. Nowak-Markwitz E, Jankowska A, Andrusiewicz M, Szczerba A: Expression of
beta-human chorionic gonadotropin in ovarian cancer tissue. Eur J
Gynaecol Oncol 2004, 25:465-469.
36. Jankowska A, Gunderson SI, Andrusiewicz M, Burczynska B, Szczerba A,
Jarmolowski A, Nowak-Markwitz E, Warchol JB: Reduction of human
chorionic gonadotropin beta subunit expression by modified U1 snRNA
caused apoptosis in cervical cancer cells. Mol Cancer 2008, 7:26.
37. Nagy A, Schally AV: Targeting of cytotoxic luteinizing hormone-releasing
hormone analogs to breast, ovarian, endometrial, and prostate cancers.
Biol Reprod 2005, 73:851-859.
38. Jankowska AG, Andrusiewicz M, Fischer N, Warchol BJ: Expression of hCG
and GnRHs and their receptors in endometrial carcinoma and
hyperplasia. Int J Gynecol Cancer 2010, 20 :92-101.
39. Muller V, Alix-Panabieres C, Pantel K: Insights into minimal residual disease
in cancer patients: Implications for anti-cancer therapies. Eur J Cancer
2010, 46:1189-1197.
40. Sun YF, Yang XR, Zhou J, Qiu SJ, Fan J, Xu Y: Circulating tumor cells:
advances in detection methods, biological issues, and clinical relevance.
J Cancer Res Clin Oncol 2011.
41. Obermayr E, Sanchez-Cabo F, Tea MK, Singer CF, Krainer M, Fischer MB,
Sehouli J, Reinthaller A, Horvat R, Heinze G, Tong D, Zeillinger R:
Assessment of a six gene panel for the molecular detection of
circulating tumor cells in the blood of female cancer patients. BMC
Cancer 2010,
10:666.
42. Grünewald K, Haun M, Fiegl M, Urbanek M, Müller-Holzner E, Massoner A,
Riha K, Propst A, Marth C, Gastl G: Mammaglobin expression in
gynecologic malignancies and malignant effusions detected by nested
reverse transcriptase-polymerase chain reaction. Lab Invest 2002,
82:1147-1153.
43. Aktas B, Kasimir-Bauer S, Heubner M, Kimmig R, Wimberger P: Molecular
profiling and prognostic relevance of circulating tumor cells in the
blood of ovarian cancer patients at primary diagnosis and after
platinum-based chemotherapy. Int J Gynecol Cancer 2011, 21:822-830.
44. Su Y, Zheng L, Wang Q, Li W, Cai Z, Xiong S, Bao J: Quantity and clinical
relevance of circulating endothelial progenitor cells in human ovarian
cancer. J Exp Clin Cancer Res 2010, 29:27.
45. Olsen TG, Hubert PR, Nycum LR: Falsely elevated human chorionic
gonadotropin leading to unnecessary therapy. Obstet Gynecol 2001,
98:843-845.
46. Hammond CB: False positive hCG. Obstet Gynecol 2001, 98:719-720.
47. Ballieux BE, Weijl NI, Gelderblom H, van Pelt J, Osanto S: False-positive
serum human chorionic gonadotropin (HCG) in a male patient with a
malignant germ cell tumor of the testis: a case report and review of the
literature. Oncologist 2008, 13:1149-1154.
48. Cole LA, Laidler LL, Muller CY: USA hCG reference service, 10-year report.
Clin Biochem 2010, 43:1013-1022.
49. Balic M, Dandachi N, Hofmann G, Samonigg H, Loibner H, Obwaller A, van
der Kooi A, Tibbe AG, Doyle GV, Terstappen LW, Bauernhofer T:
Comparison of two methods for enumerating circulating tumor cells in
carcinoma patients. Cytometry B Clin Cytom 2005, 68:25-30.
50. Smirnov DA, Zweitzig DR, Foulk BW, Miller MC, Doyle GV, Pienta KJ,
Meropol NJ, Weiner LM, Cohen SJ, Moreno JG, Connelly MC,
Terstappen LW, O’Hara SM: Global gene expression profiling of circulating
tumor cells. Cancer Res 2005, 65:4993-4997.
51. Chen SY, Huang YC, Liu SP, Tsai FJ, Shyu WC, Lin SZ: An overview of
concepts for cancer stem cells. Cell Transplant 2010.
52. Gerlinger M, Swanton C: How Darwinian models inform therapeutic
failure initiated by clonal heterogeneity in cancer medicine. Br J Cancer
2010, 103:1139-1143.
doi:10.1186/1479-5876-9-130
Cite this article as: Andrusiewicz et al.: CGB and GNRH1 expression
analysis as a method of tumor cells metastatic spread detection in
patients with gynecological malignances. Journal of Translational
Medicine 2011 9:130.
Andrusiewicz et al. Journal of Translational Medicine 2011, 9:130
/>Page 9 of 9