Báo cáo sinh học: "Fuzzy obesity index (MAFOI) for obesity evaluation and bariatric surgery indication" potx
Bạn đang xem bản rút gọn của tài liệu. Xem và tải ngay bản đầy đủ của tài liệu tại đây (378.36 KB, 10 trang )
RESEARC H Open Access
Fuzzy obesity index (MAFOI) for obesity
evaluation and bariatric surgery indication
Susana Abe Miyahira
1,2,3*
, João Luiz Moreira Coutinho de Azevedo
1
and Ernesto Araújo
1,2,3
Abstract
Background: The Miyahira-Araujo Fuzzy Obesity Index (MAFOI) for being used as an alternative in bariatric surgery
indication (BSI) is validated in this paper. The search for a more accurate method to evaluate obesity and to
indicate a better treatment is important in the world health context. Body mass index (BMI) is considered the main
criteria for obesity treatment and BSI. Nevertheless, the fat excess related to the percentage of Body Fat (%BF) is
actually the principal harmful factor in obesity disease that is usually neglected. The aim of this research is to
validate a previous fuzzy mechanism by associating BMI with %BF that yields the Miyahira-Araujo Fuzzy Obesity
Index (MAFOI) for obesity evaluation, classification, analysis, treatment, as well for better indication of surgical
treatment.
Methods: Seventy-two patients were evaluated for both BMI and %BF. The BMI and %BF classes are aggregated
yielding a new index (MAFOI). The input linguistic variables are the BMI and %BF, and the output linguistic variable
is employed an obesity classification with entirely new types of obesity in the fuzzy context, being used for BSI, as
well.
Results: There is gradual and smooth obesity classification and BSI criteria when using the Miyahira-Araujo Fuzzy
Obesity Index (MAFOI), mainly if compared to BMI or %BF alone for dealing with obesity assessment, analysis, and
treatment.
Conclusion: The resulting fuzzy decision support system (MAFOI) becomes a feasible alternative for obesity
classification and bariatric surgery indication.
Background
The clinical conditions that are characterized as over-
weight (pre-obesity) and obesity are currently a universal
epidemic of cr itical proportions. Efforts have been made
to minimize this public health problem , but the preva-
lence of obesity is still growing in both developed and
developing countries [1-6].
An excess of fat tissue (obesity) has been shown to be
harmful for multiple organs and systems through trom-
bogenic, atherogenic, oncogeni c, hemodynamic, and
neuro-humoral mechanisms [7-11]. Recently, obesity
and related diseases (comorbidities), including diabetes
mellitus, hypertension, corona ry artery disease, cancer,
sleep apnea, and osteoartrosis, have replaced tobacco
use as a leading cause of death, where obesity contri-
butes directly to the severity of the comorbities [12-15].
Therefore, a great clinical interest exists for evaluating
overweight and obese patients to d etermine the risks
inherent with these conditi ons, to p rescr ibe and control
conservative treatments, and to indicate when surgical
treatment is needed. In the last 30 years, only the over-
weight and obesity rating system, which uses the body
mass index ( BMI), has be en internationally recognized
[16] (Table 1).
BMI is a mechanism to measure weight excess exten-
sively used in a myriad of epi demiol ogic studies, and is
incorporated with clinical practice because of its simpli-
city [17]. However, it does not properly evaluate the
body fat (BF) proportion because it fails to distinguish
lean muscle mass from body f at [18]. The BF measure-
ment has more value than global body mass measure-
ments since the harmful factor in obesity is the
accumulation of fat in the body, and lean muscle mass
* Correspondence:
1
Universidade Federal de São Paulo (UNIFESP), Brazil. R. Botucatu 740 - São
Paulo, SP, CEP 04023-900, Brazil
Full list of author information is available at the end of the article
Miyahira et al. Journal of Translational Medicine 2011, 9:134
/>© 2011 Miyahira et al; licensee BioMed Central Ltd. Thi s is an Open Access art icle dis tributed under th e terms of the Creative
Commons Attribution License ( which permits unrestricte d use, distribution, and
reproduction in any medium, provided the original work is properly c ited.
does not burden the individual health [19,20]. Addition-
ally, the BMI itself is revealed as an imprecise and inac-
curate method to measure the percentage of Body Fat
(%BF), especially when people from different categories
are took into account, which happens in populations of
different ages and with different body types [21,22].
Despite of these limitations, the BMI is often used in
the therapeu tic approach to obesity classification, analy-
sis, and treatment as well as to determine bariatric sur-
gery (Table 2) [1].
Taking into account that the BF percentage is the most
reliable indicator of obesity and that the BMI is used to
prescribe surgery, it would also be convenient to simul ta-
neously consider BF when approaching the patient to
recommend bariatric surgery (Table 3) [23-25]. In this
sense, the BMI should be included in conjunction with
the %BF when evaluating the condition of the patient and
determining an obesity treatment algorithm [18,26].
Therefore, the search for a more accurate model that
evaluates overweight and obese patients with apparent
body m ass excess led to the conception t hat indicates when
surgery is appropriate for these patients. Previously pre-
sented, the Miyahira-Araujo Fuzzy Obesity Index (MA FOI)
evaluates the obesity by correlating BMI and the BF in the
context of fuzzy set theory and fuzzy logic. MAFOI must
also have the ability to accurately recommend which
patients should be referred for bariatric surgery.
Objectives
General: To determine a more accurate parameter for
the evaluation of obesity and in bariatric surgical
indication.
Specifics:
1) To evaluate the use of Miyahira-Araujo Fuzzy Obe-
sity Index (MAFOI) in a random sample of the obese
population.
2) To validate Miyahira-Araujo Fuzzy Obesity Index
(MAFOI) in indicating bariatric surgery.
Methods
This prospective study was carried out at the Hospital
Municipal Dr. José de Carvalho Florence (HMJCF), in
the city of São José dos Campos, São Paulo state, Brazil
from December of 2008 to August of 2009. Such a
research is approved by the Ethic and Research Com-
mission (CEP) of the Universidade de Taubaté (UNI-
TAU) (Exhibit I) and the Universidade Federal d e São
Paulo (UNIFESP) (Exhibit II). All participants in the
study signed an informe d consent form that was in
accordance with Decree no. 196/96 of the National
Health Council (CNS)/Health Ministry (MS) and its
complements (Decrees 240/97, 251/97, 292/99, 303/00,
and 304/00 of the CNS/MS) (Exhibit III). This research
was sponsored by the funding agency Fundação de
Amparo à Pesquisa do E stado de São Paulo (FAPESP),
process # 2009/07956-7.
Inclusion criteria were the following: patients from
emergency and nursing rooms in t he HMJCF, of both
gender, and aged 18 years and older, and patients fasting
at least for 6 hours of solid food and 4 hours of liquids.
Exclusion criteria were the following: patients who
refused to take part in the study, pregnant women, and
patients with kidney failure, hydroelectrical alterations,
inadequate hydration, fever (T>37.8°C), ascites, hepatic
cirrhosis, a coronary by-pass, or an amputation of the
inferior or superior members.
The weight, height, and BF of the patients were mea-
sured during the same day and at subsequent time
points.
BMI Calculation
To calculate the BMI, a stadiometer, which was graded
at every 0.5 cm, and a digit al scale, with 0.1-kg sensitiv-
ity, were used.
BF Calculation
To obtain BF and fat-free mass (FFM) values, a body
composition analyzer was used, a method that uses
direct multi-frequency bio-impedance (BIA) and the
Table 1 Guidelines for the classification of overweight
and obese adults using BMI
Condition Classification BMI
Overweight OW 25 to 29.9
Obesity class I OI 30 to 34.9
Obesity class II OII 35 to 39.9
Obesity class III (Morbid) OIII ≥40
Clinical guidelines on the identification, evaluation, and treatment of
overweight and obesity in adults. Washington, National Institute of Health,
1998. (Modified).
Table 2 Indication of bariatric surgery according to the
BMI and comorbidities
BMI >35 and <40 Kg/m
2
BMI >40 Kg/m
2
Without comorbidities Without indication With indication
With comorbidities With indication With indication
Table 3 Obesity classified by BF
BF (%) Women Men
ADEQUATE <25% <15%
LIGHT 25 - 30% 15 - 20%
MODERATE 30 - 35% 20 - 25%
HIGH 35 - 40% 25 - 30%
MORBID >40% >30%
Guideline for the classification of obesity in adults. National Institute of
Diabetes and Digestive and Kidney Diseases. U.S. Department of Health and
Human Services. (Modified).
Miyahira et al. Journal of Translational Medicine 2011, 9:134
/>Page 2 of 10
Segmental-model InBody230 (Biospace Co., Ltd. Seoul
135-784 KOREA) Tetra-polar System with 8-points. The
BF values and FFM system were obtained through the
BIA from equations that were incorporated in the
equipment, as described by Bedogni [35].
Protocol for the evaluation
1) The pati ents were instructed to refrain from drinking
alcohol and to not perform heavy physical activity dur-
ing the day prior to the exam.
2) Fasting at least for 6 h of solid food and 4 h of
liquids prior to the exam.
3)Thepatientswereinstructedtousetherestroom
before the test.
4) The patients wore light clothes or a hospital gown.
5) The patients did not wear watches or jewelry i n the
vicinity of the electrodes.
6) The pa tients remained standing for 5 minute s
before the exam performance.
7) The room temperature at the exam wa s maintained
from 20°C to 25°C.
Fuzzy Set Theory and Fuzzy Logic for Fuzzy BMI, Fuzzy %BF
and Fuzzy Obesity Output Classes and Values in Obesity
Assessment
Initially, the BMI was modified by the treatment of the
crisp classes, as adopted by the World Health Organiza-
tion (WHO), into fuzzy sets, i.e., fuzzy classes (Figure 1
and 2). While the classical set theory is based on the
excluded middle principle where an element belongs, or
not, to a set (crisp set/class), the fuzzy set theory allows
a relation of gradual membership of an element to a
determined set [27,28]. Such an approach was, thus,
extended to the %BF classes (Figure 3). The fuzzy BMI
and fuzzy %BF classes were aggregated by employing
logical connectives and mapped into fuzzy obesity
output classes and values resulting in a new index
named the Miyahira-Araujo Fuzzy Obesity Index
(MAFOI) (Figure 4). MAFOI was, then, used to classify
individuals in relation to their obesity condition and
establish a criterion that provides a decision-making sys-
tem that can recommend bariatric surgery, as well.
These described steps embrace the mapping process
that includes the following: (i) the knowledge basis, (ii)
the fuzzification that translates the crisp value (classical
number) of the input variable into a fuzzy value, (iii) the
cylindrical extension, the aggregation, the conjunction,
and the projection, and (iv)thedefuzzification that
translates the output linguistic variable in a crisp value.
To build the input variable for the fuzzy BMI, the
WHO classification (Table 1) was used. The fuzzy sets
for the fuzzy BMI are assigned the following linguistic
terms: overweight (OW), obesity class I (OI), obesity
class II (OII), and obesity class III (OIII).
To build the input variable for the fuzzy %BF, the
NIDDK classification of overweight and obesity was
used (Table 3). The fuzzy sets for the fuzzy %BF are
assigned the following linguistic terms: adequate (AD),
light obesity (LI), moderate obesity (MDE), high obesity
(HI), and morbid obesity (MOR).
The fuzzy obesity or surgical-treatment-indication eva-
luation constituted the output linguistic variable (conse-
quent of the rule). The fuzzy sets for the fuzzy obesity
or surgical-treatment indication are assigned the follow-
ing linguistic terms: thin (TH), muscular hypertrophy
(MUH), excess of weight (EW), sutomori (SUT), fuzzy
obesity (FZOB), and morbid obesity (MOR). The rules
were restricted to those clas ses considered re levant, i.e.
restricted to only those than can happen in ordinary
practice (Table 4).
The base of rules is represented as a fuzzy matrix in
table 4.
Fuzzy BMI, % Fuzzy BF, Fuzzy Obesity Output Classes, and
MAFOI performance to obesity diagnosis and to surgical
treatment indication
The WHO reference standard is employed to evaluate
the obesity dia gnosis performance, which is evaluated by
using the BMI (Table 1). Values that are already
described in the literature were used to evaluate the obe-
sity-diagnosis performance, which was evaluated using
the %BF cut-off value [25]. To evaluate the MAFOI, a
value defined by the defuzzification of the output variable
is used by using the center of area method.
Statistical analysis
The continuous variables are presented as mean and
standard deviation (SD) and numbers and percentages
as categorical variables. The Pearson coefficients of cor-
relation and the respective intervals of confidence (IC)
(95%) are estimated to compare BMI, BF and MAFOI
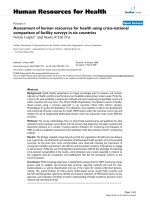
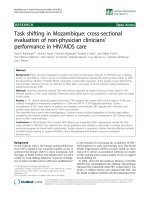
Figure 1 Classical BMI. BMI classical set, with the linguistic values:
slim (S), overweight (OW), obesity class I (OI), obesity class II (OII),
obesity class III (OIII).
Miyahira et al. Journal of Translational Medicine 2011, 9:134
/>Page 3 of 10
by genre. The McNemar test [29] is used to compare
the percentage o f the individuals considered obese by
the BMI versus BF, BMI versus MAFOI and BF and BF
versus MAFOI.
Results
In the current s tudy, 81 patients were evaluated and 72
out of the 81 were evaluated by analyzing the BMI and
%BF. Among the excluded patients, 7 were not fasting, a
patient had consumed alcohol within 24 h prior to the
test, and a patient had a fever (T = 38.2°C) at the time
of evaluation. Within the 72 patients, 42 were female
and 30 were male. The mean age standard deviation
(SD) was 39.5 ± 11.2 years old for women and 43.5 ±
15.8 years old for men. The mean weig ht SD was 70.0 ±
14.5 kg for women and 79.6 ± 25.3 kg for men. The
mean BMI SD was 27.1 ± 5.8 kg/m
2
for women and 27
±7.4kg/m
2
for men. The mean %BF SD was 38.7 ±
6.7% for women and 26.3 ± 7.9% for men. The demo-
graphic data are described in Table 5.
The maximum and minimum BMI, %BF, and MAFOI
values are presented in Table 6. Mean and SD values
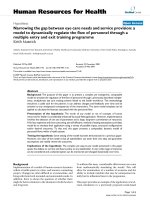
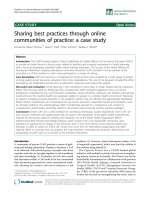
Figure 2 Fuzzy BMI. BMI fuzzy set, with the linguistic terms: overweight (OW), obesity class I (OI), obesity class II (OII), obesity class III (OIII).
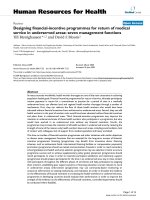
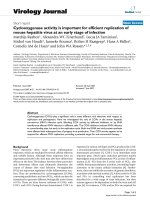
Figure 3 Fuzzy BF. BF fuzzy set, with the linguistic term s: adequate (AD), light obesity (LI), moderate obesity (MDE), high obesity (HI), morbid
obesity (MORB).
Miyahira et al. Journal of Translational Medicine 2011, 9:134
/>Page 4 of 10
are given for BMI and %BF. Table 7 displays the Pear-
son linear correlation coefficien ts between BMI (Kg/m
2
)
and the remaining variables: BF, FFM, and MAFOI for
both genders.
The low bound value of BMI obesity class I classifica-
tion (OI) = 30 and the low bound value of %BF high
obesity classification (HI) = 35 (women = 35; men = 25
+10), which are defined by the WHO/NIDDK [16,25]
were used as input values of the fuzzy model. The fuzzy
inference was performed. The outcome was t he cut-off
value of index MAFOI/BSI (MAFOI) = 68.
The percentage of individuals that were considered
obese by the BF criteria was statistically lower than by
the BMI criteria (Table 8).
The percentage of obese individuals determined by the
MAFOI criter ia was statistically higher than by the BMI
criteria (Table 9). The percentage of obese individuals
determined by the BF criteria was statistically higher
than the MAFOI criteria (Table 10).
The correlation between the BMI and %BF for women
was stronger than for men. When comparing BMI to
FFM, the correlation was better for men. The groups
show a stron g correlation for all of the variable s in both
genders. Regarding the BMI and MAFOI, the correlation
was strong for both women and men. The correlation
between BF and MAFOI was the best one for both
genders.
The percentages of individuals that were considered
obese by the BMI, %BF, and MAFOI criteria are pre-
sented in Table 11. The percentage of individuals con-
sidered obese by the %BF criteria (63.9%) was
statistically higher than the BMI criteria (23.9%) (p <
0.001). The percentage of individuals considered obese
by the MAFOI criteria (41.7%) w as statistically higher
than the BMI criteria (23.6%) (p < 0.001). The percen-
tage of individuals considered obese by the %BF criteria
(63.9%) was statistically higher than the MAFOI criteria
(41.7%) (p < 0.001) [30].
Discussion
Use of BMI to classify obesity
Despite its limitations, the BMI is currently considered
the most useful measurement of the obesity level of the
population. Thus, the BMI can be used to estimate the
prevalence of obesity in the population and the risks
associated with this condition. However, it does not elu-
cidatethewidevariationinthenatureofobesity
between different individuals and diverse populations.
Among sedentary and overfed individuals, the increase
of body mass is generally due to both body fat and mus-
cle mass. Nevertheless, among men, the increase of body
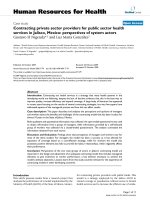
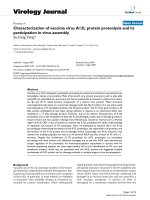
Figure 4 Fuzzy Obesity-Degree/Surgical-Tre atment-Indication Classes. Obesity-Degree/ Surgical-Treatment-Indication classes set, with the
linguistic terms: thin (TH), muscular hypertrophy (MUH), excess of weight (EW), sutomori (SUT), fuzzy obesity (FZOB), and morbid obesity (MOR).
Table 4 Bases of Fuzzy Rules
BMI/BF TH OW OI OII OIII
AD TH MUH MUH MUH X
LI TH HM HM HM X
MDE EW EW SUT SUT MOR
HI EW FZOB FZOB FZOB MOR
MOR X FZOB FZOB FZOB MOR
BMI (body mass index), overweight (OW), obesity class I (OI), obesity class II
(OII), and obesity clas s III (OIII). BF (body fat percentage), adequate (AD), light
obesity (LI), moderate obesity (MDE), high obesity (HI), thin (TH), muscular
hypertrophy (MUH), excess of weight (EW), sutomori (SUT), fuzzy obesity
(FZOB), and morbid ob esity (MOR).
Miyahira et al. Journal of Translational Medicine 2011, 9:134
/>Page 5 of 10
mass may play a mo re important role than in w omen
whichhastheincreaseofbodyfatthemainfactorof
acquired excess of weight. Thus, the correlation between
the BMI and %BF for women is stronger than for men.
When comparing BMI to fat-free mass, the correlation
was better for men, a feasible explanation is due to the
greater increase of the muscle mass among them.
Regarding the BMI and MAFOI, the correlation was
strong for bot h men and women. The correla tion
between BF and MAFOI was the best one for both
genders.
Studies indicate t hat the BMI has to be adjusted for
diverse ethnical groups as the WHO study of the Wes-
tern Pacific Region [31]. This study demonstrated that
different cut-off values must be adapted for overweight
(>23 kg/m
2
) and for obesity (>25 kg/m
2
). Other studies
evaluated the Australian aborigine population and
showed that the cut-off point was >26 kg/m
2
for defin-
ing overweight [31]. The BMI accuracy in diagnosing
obesity is mainly limited in intermediary ranges of BMI
in men and in elder s due to a failure in discriminating
free-fat mass and body fat [32].
The results of this stu dy were in agreement with the
data found in the literature when the performances of
the BMI and BF in diagnosing obesity were compared
[18,32,33]. Analyzing only the BMI, 23% of the sample
was considered obese, while this proportion increased to
63.9% and 41.7% when evaluated, respectively, with the
%BF and the MAFOI.
The v ariability between living things of the same spe-
cies, inherent to the biological condition, allows a range
of classification. However, the limits of these artificially
created classes are inaccurate and badly defined.
To justify the use of fuzzy logic in this research, it is
worth to consider that the classical procedure for evalu-
ating the results from research in the life-science area
has been the application of descriptive statistics to the
tabulation and stratification of data. Inferential statistics
have been used where probabilistic analyses are needed.
In the classical logic approach, however, all of the
instruments aim at establishing v alues with a higher rate
of occurrence; specific ranges of variables are directly
defined as causes or modu lating factors. This trea tment
is perfectly suited when it refers to results of exact-
science studies where the objects are simple substances
and the samples are homogeneous. However, this is not
thecaseinthebiologicalfieldwherethedisparity
observed can be simply due to normal individual varia-
tion that occurs in a species population [34].
Limitations of the study
1) The membership functions were conceived by the
authors based on the concepts, classification and knowl-
edge about overweight a nd obesity already described in
the literature [25]. Therefore others membership func-
tions maybe acceptable. 2) The fact that there is not a
MAFOI for men and other for women. The only one
obtained maybe creates a skewness that underestimates
BSI for men as the BF cut-off f or men may be consid-
ered. 3) The calculus of the MAFOI itself was decided
taking into account the lower bounds of two special
bands of BMI and %BF categorization. This election
Table 5 Standard deviation (SD), body mass index (BMI), body fat (BF)
Women (n = 42) Men (n = 30)
Mean Minimum Maximum SD Mean Minimum Maximum SD
Age
(years)
39.5 18.0 60.0 11.2 43.5 18.0 76.0 15.8
Weight
(Kg)
70.0 48.0 113.1 14.5 79.6 32.0 160.0 25.3
Height
(m)
160.9 148.5 170.0 5.7 172.2 155.5 183.0 7.5
BMI
(Kg/m
2
)
27.1 18.8 45.9 5.8 27.0 17.6 54.1 7.4
BF
(%)
38.7 25.2 48.8 6.7 26.3 9.9 40.1 7.9
Table 6 Standard deviation (SD), body mass index (BMI), body fat (BF)
Women (n = 42) Men (n = 30)
Mean Minimum Maximum SD Mean Minimum Maximum SD
BMI 27.1 18.8 45.9 5.8 27.0 17.6 54.1 7.4
BF (%) 38.7 25.2 48.8 6.7 26.3 9.9 40.1 7.9
MAFOI 23.9 91.7 23.9 91.7
The maximum and minimum BMI, BF, and MAFOI values.
Miyahira et al. Journal of Translational Medicine 2011, 9:134
/>Page 6 of 10
seems adequate since those special bands include the
obese subjects, however studies may continue to analyze
clinical conditions like metabolic syndrome, hyperten-
sion, and cancer. 4) The rules appear to be reasonable,
since they are buildi ng up based on the logical concept.
5) The accurateness of all the assumptions adopted for
the fuzzy inference system can be verified according to
the matchi ng again st real data where BSI had been
achieved as a good decision. Finally, the development
carried out in this paper admits other representations
since it allows subtle changes, mo difications in the out-
put can be verified.
Conclusion
The Miyahira-Araujo Fuzzy Obesity Index (MAFOI)
demonstrated to be adequate both to e valuate the obe-
sity condition a nd to recommend bariatric surgery
according to experimental data.
The MAFOI results are closer to the real clinical con-
dition of obesity of the individual than either the BMI
or the %BF.
Appendix
MAFOI: Fuzzy Set Theory, Fuzzy Logic building
Fuzzy Obesity Assessment according to Fuzzy BMI,
Fuzzy %BF, and Fuzzy Output Classes and Values
[26,37]:
The fuzzy set theory and fuzzy logic can be under-
stood both as a manner to reproduce the knowledge
and the common sense working as an interface between
numbers and symbols (linguistic expression) as a tool to
build up numerical functions when dealing with data
[36,37].
The concept underlying fuzzy sets allows the gradual
and not absolute pertinence from an element to a class,
contrary to the classical sets. A classic set, M, in a space
of points assigned universe of discourse, X ={x}, is
defined by a charac teristic function, μ
M
(x), that assumes
a null value for all elements of X that not belongs to the
set M, μ
M
(x)=0ifx∉ M, and a unit ary value for those
values that belong to it, μ
M
(x)=1ifxÎ M, i.e., μ
M
(x):
X ® {0, 1}. Differently, a fuzzy set, M,inauniverseof
discourse, X, is defined by a membership function, μ
M
(x): X ® [0, 1]. If the values of μ
M
(x)are,inturn,
associate to a degree of truthiness, the truth is assigned
to continuous values within [0, 1] [27,28]. The member-
ship function μ
M
(x) can also be understood as the com-
patibility degree among fuzzy sets which, in turn, are
related to linguistic terms.
(1)Thefirststepforachieving the Miyahira-Araujo
Obesity Index (MAFOI) is, thus, accomplished when the
BMI is modified into fuzzy sets by the treatment of the
crisp classes adopted by the World Health Organization
(WHO), as depicted in Figure 1 and 2[26]. To build the
input variable for the BMI, the WHO classification in
Table 1 is used. In sequence, such a process is extended
to %BF classes (Figure 3) [26]. To build the input vari-
able for the %BF, the NIDDK classification of
Table 8 Body mass index (BMI), body fat (BF)
BF
>35(women) >25(men)
BMI
>30 kg/m
2
OBESE NON-OBESE
OBESE 16 1 17 (23.6%)
NON-OBESE 30 25 55
TOTAL 46 (63.9%) 26 72
The percentage of individuals considered obese by the BF and the BMI
criteria.
Table 9 Body mass index (BMI)
MAFOI
>68
BMI
>30 kg/m
OBESE NON-OBESE
OBESE 12 5 17 (23.6%)
NON-OBESE 18 37 55
TOTAL 30 (41.7%) 42 72
The percentage of individuals considered obese by the MAFOI and the BMI
criteria.
Table 10 Body fat percentage (%BF)
MAFOI
>68
BF
>25 men OBESE NON-OBESE
>35 women
OBESE 30 16 46 (63.9%)
NON-OBESE - 26 26
TOTAL 30 (41.7%) 42 72
The percentage of individuals considered obese by the MAFOI and the BF
criteria.
Table 7 Body mass index (BMI), body fat (BF), fat free
mass (FFM)
Women
(n = 42)
Men
(n = 30)
BMI and BF Pearson correlation 0.831 0.656
Sig. (2-tailed) <0.001 <0.001
BMI and FFM Pearson correlation 0.683 0.848
Sig. (2-tailed) 0.000 <0.001
BMI and MAFOI Pearson correlation 0.770 0.617
Sig. (2-tailed) <0.001 <0.001
BF and MAFOI Pearson correlation 0.905 0.961
Sig. (2-tailed) <0.001 <0.001
The Pearson linear correlation coefficients between BMI (Kg/m
2
), BF (% ), FFM
(Kg), and MAFOI for both genders.
Miyahira et al. Journal of Translational Medicine 2011, 9:134
/>Page 7 of 10
overweight and obesity in Table 3 is used. The elements
of BMI and the elements of %BF, both being distributed
into the universes of discourses X and Y, respectively,
are grouped and assigned by classes or linguistic terms.
The BMI obesity classes are assigned the linguist terms
overweight (OW), obese class I (OI), obese class II (OII),
and obese class III (OIII) meanwhile the %BF obesity
classes are assigned the linguistic terms adequate (AD),
light obesity (LI) , moderate obesity (MDE), high obesity
(HI), morbid obesity (MOR) [26].
When employing the classical set theory to classify
obesity and to recommend surgical treatments, or not,
there is categorical, crisp classes like yes or no, recom-
mendation or no-recommendation for bariatric surgery.
Diverse crisp obesity classes can be employed for surgi-
cal recommendation, according to the class a patient
belongs to (Figure 1). For instance, a patient with a BMI
of 39 Kg/m
2
is assigned to the Obesity II class, such that
μ
M=OII
(x=39Kg/m
2
)=1. Observe that all the other
classes obtain a null activation status, μ
≠OII
(x=39Kg/
m
2
)=0. This category achieves no-recommendation
class for bariatric surgery, μ
no-recommendation
(x=39 Kg/
m
2
)=1, or equally null surgical recommendation , μ
re-
commendation
(x=39 Kg/m
2
)=0 [37]. Nevertheless, it
seems to be arbitrary to assign a Boolean approach as
the one used for BMI or %BF. Two patients with BMI
of 39 kg/m
2
and BMI of 40 kg/m
2
are, respectively, clas-
sified into the OII and OIII groups receiving each a dis-
tinct treatment recommendations, even if the difference
from one patient to the other is minimal, Δ1. Although
the first patient is not in the range for a surgical recom-
mendation, the second one is in t he range for a surgical
recommendation. In t his situation, both patients may
not present significa nt biological, anatomical, or physio-
pathological differences that justify such a discrepancy
in the surgical recommendation. Conversely, fuzzy set
theory allows simultaneously allocating a patient in
more than one class, or not, by embodying the inherent
subjectivity in the obesity and bariatric surgery classifi-
cation and analysis processes. Likewise crisp obesity
classification, fuzzy obesity classification also allows
dealing with diverse groups and classes (Figure 2). This
provides the advantage of a more realistic classification
both for obesity severity and surgical recommendations.
Taking into account the same patient, a fuzzy set (class)
assigned Obesity II Class is active with a degree of
recommendation - i.e., a degree of certainty - for surgical
treatment, μ
recommendation
OBII
(x=39 Kg/m
2
)=a
1
, where
0<a
1
<1,duetoadegreeofmembership,μ
M=OBII
(x
= 39 Kg/m
2
)=a
1
. Observe that this patient may also be
classified by another fuzzy set labeled Obesity III Class
achieving another degree of recommendation for surgical
treatment, μ
recommendation
OBIII
(x=39 Kg/m
2
)=a
2
,
where 0 <a
2
< 1, according to a different degree of
membership, μ
M = OBIII
(x=39 Kg/m
2
)=a
2
, such that
a
1
> a
2
[37]. Further, when taking into account two
patients with BMI of 39 kg/m
2
and BMI of 40 kg/m
2
,
both would be categorized either as OII as OIII. The
difference exists since the first patient presents a class of
OII that i s higher than OIII, whereas the second patient
is more in the OIII group than in the OII group. In this
case, both patients have a p otential to receive or not
receive a recommendation for surgical treatment. This
determination depends on other factors and not only
the BMI value, which is improperly and perhaps incon-
sistently used.
(2) The second step in building up the MAFOI is
fulfilled by satisfying the BMI dependence upon
another factor [26]. Fuzzy set theory advantages in
allowing distinct variables to work together based on
the aggregation of their respective fuzzy sets. The
manipulation of sets is chiefly carried out by operators
of intersection ∩,union∪,andcomplement,¬.The
intersection set operation corresponds in logic to the
connective, operator of conjunction, ⋀,andtothe
semantic connective, “and” The union set operation is
associated to the connective operator of disjunction, ⋁,
and to the semantic connective “or” The complement
is related to the logical connective of negation of a
given proposition presenting the idea of opposition.
The BMI and %BF classes were aggregated by employ-
ing logical connective of conjunction. The %BF vari-
able is the modulation factor for BMI variable in the
obesity degree and surgical recommendation analysis.
When the sets are considered under the classical set
theory, the Cartesian pair, (x,y), such that x Î BMI
and y Î %BF, assumes either a unitary value, μ(
M
BMI
×
M
%BF
)(x,y) = 1, for each pair that belongs to the rela-
tionship or a null value, μ(
M
BMI
×
M
%BF
)(x,y) = 0, for
each pair that does not belong to the relationship.
When the partition of the universe of d iscourse for the
BMI and %BF variables is accomplished by using the
fuzzy set theory, each Cartesian pair is also able to
assume an intermediary value between 0 and 1, 0
μ(
M
BMI
×
M
%BF
)(x,y 1, yielding an overlapping of
Table 11 Body mass index (BMI), body fat (BF)
BMI = 23.6% BF = 63.9%
>30 >35(women)
>25(men)
BMI = 23.6% MAFOI = 41.7%
>30 >68
BF - 63.9% MAFOI = 41.7%
>35 (women) >68
>25(men)
n=72
The percentages of individuals that were considered obese by the BMI, BF,
and MAFOI criteria.
Miyahira et al. Journal of Translational Medicine 2011, 9:134
/>Page 8 of 10
classes (overlapped assignments) in a way that the
patient can be classified in complementary manners.
Both BMI and %BF are understood as input variable
when dealing with a fuzzy IF-THEN inference mechan-
ism (mapping) and the resulting Cartesian product, X
× Y, is related to the input space. In general, this input
space is mapped into an output universe of discourse.
(3) This leads to the third step in design ing the Miya-
hira-Araujo Fuzzy Obesity Index. The obesity-degree/
surgical-treatment-indication evaluation constituted the
output linguistic variable (Figure 4) [26]. The fuzzy set s
that part such an output universe of discourse are
assigned the linguistic terms thin (TH), muscular hyper-
trophy (MUH), excess of weight (EW), sumotori (SUT),
fuzzy obesity (FZOB), and morbid obesity (MOR). They
were obtained according to the classification of body
composition, regarding the weight, muscle mass, and
body fat. The sutomori fuzzy set for obesity is also a
novel obesity class previously introduced by the a uthors
and there is no similar in literature.
26
It is a special
body constitution which is found among sumo wrestlers,
characterized by a large amount of both muscles and fat
tissue. These athletes have a large muscular mass and
present a high level of %BF a nd due to that are usually
considered as obese. However, when compared with
individuals with equivalentBMI,theypresentlower
values of %BF [26].
(4) The fourth and latter step for obtaining the
MAFOI is related to its proper structure that maps the
BMI and %BF linguisti c variables into the obesity-
degree/surgical-treatment-indication linguistic variable
by employing the fuzzy logic [26]. Fuzzy logic is essen-
tially a system of rules of inference characterized as a
set of (IF-THEN) rules. This mechanism of fuzzy infer-
ence uses logic principles to establish how facts and
ruleshavetobecombinedtoderivenewfacts.An
important concept is the fuzzy rules,IFP
1
AND P
2
AND AND P
n
THEN Q where the set of input fuzzy
propositions, P
i
= x
i
is M
i
, i =1, ,n, and the inferred
fuzzy proposition, Q = z is Ni, are called, respectively,
premises (antecedent of the rule) and conclusion (conse-
quentoftherule)suchthatthefuzzyrulescanalsobe
represented as IF x
1
is M
1j
AND x
2
is M
2j
AND AND
x
n
is M
nj
THEN z is Ni. Being a mechanism of infer-
ence, the fuzzy logic is understood as a form to repre-
sent the human approxi mate reasoning; being a form to
represent a mapping, it is a universal approximator.
36,37
The rules were restricted to those considered relevant; i.
e., they were restricted to fea sible rule t han can really
occur in real health world. Given the set of fuzzy IF-
THEN rules as established in Table 4 the Miyahira-Ara-
ujo Fuzzy Obesity Index is, then , used to classify indivi-
duals in relation to their obesity condition and establish
a criterion that provides a decision-making system that
can recommend bariatric surgery [26].
Acknowledgements
Supported by grant: 2009/07956-7 from Fundação de Amparo à Pesquisa do
Estado de São Paulo (FAPESP), Universidade Federal de São Paulo (UNIFESP),
and Associação Paulista para o Desenvolvimento da Medicina (SPDM).
Author details
1
Universidade Federal de São Paulo (UNIFESP), Brazil. R. Botucatu 740 - São
Paulo, SP, CEP 04023-900, Brazil.
2
Hospital Municipal Dr. José de Carvalho
Florence (HMJCF), Av. Saigiro Nakamura 800 - São José dos Campos, SP, CEP
12220-280, Brazil.
3
Associação Paulista para o Desenvolvimento da Medicina
(SPDM), Av. Saigiro Nakamura 800 - São José dos Campos, SP, CEP 12220-
280, Brazil.
Authors’ contributions
SAM made an extensive research on the bibliography, and was the
responsible for the data collection. JLMCA designed the study in a
methodological point of view, and was the principal writer of this study in
English. EA was the responsible for the fuzzy logic approach. All authors
read and approved the final manuscript.
Competing interests
The authors declare that they have no competing interests.
Received: 5 July 2011 Accepted: 14 August 2011
Published: 14 August 2011
References
1. Kolata G: Obesity declared a disease. Science 1985, 227:1019-20.
2. Bray GA: The epidemic of obesity - A chronic disease that governments
worldwide must take seriously. West J Med 2000, 172:78-9.
3. Haslam DW, James WPT: Obesity. Lancet 2005, 366:1197-209.
4. James PT, Leach R, Kalamara E, Shayeghi M: The worldwide obesity
epidemic. Obes Res 2001, 9:228S-233S.
5. Fine JT, Colditz GA, Coakley EA, Moseley G, Manson JAE, Willett WC,
Kawachi I: A prospective study of weight change and health-related
quality of life in women. JAMA 1999, 282:2136-42.
6. Abelson P, Kennedy D: The obesity epidemic. Science 2004, 304:1413-8.
7. Hampton T: Scientists study fat as endocrine organ. JAMA 2009,
296:1573-5.
8. Lago F, Gómez R, Gómez-Reino JJ, Dieguez C, Gualillo O: Adipokines as
novel modulators of lipid metabolism. Trends Biochem Sci 2009, 3:500-10.
9. Wozniak SE, Gee LL, Watchel MS, Frezza EE: Adipose Tissue: The New
Endocrine Organ? A Review Article. Dig Dis Sci 2009, 54:1847-56.
10. Nathan C: Epidemic inflammation: pondering obesity. Mol Med 2008,
14:485-92.
11. Wellen KE, Hotamisligil GS: Inflammation, stress, and diabetes. J Clin Invest
2005, 115:1111-19.
12. Visscher TLS, Seidell JC, Menotti A, Blackburn H, Nissinen A, Feskens EJM,
Kromhout D: Underweight and overweight in relation to mortality
among men aged 40-59 and 50-69 years. Am J Epidemiol 2000, 151:660-6.
13. WHO: Obesity: preventing and managing the global epidemic. Report of
a WHO consultation. World Health Organ Tech Rep Ser; 2000:894:i-xii, 1-
253.
14. McLachlan CR, Poulton R, Car G, Cowan J, Filsell S, Greene JM, Taylor DR,
Welch D, Williamson A, Sears MR, Hancox RJ: Adiposity, asthma, and
airway inflammation. J Allergy Clin Immunol 2007, 119:634-9.
15. Geloneze B, Mancini MC, Coutinho W: Obesity: knowledge, care, and,
commitment, but not yet cure. Arq Bras Endocrinol Metabol 2009,
53
:117-119.
16. Calle EE, Thun MJ, Petrelli JM: Body-mass index and mortality in a
prospective cohort of U.S. adults. N Engl J Med 1999, 341:1097-105.
17. Eknoyan G: Adolphe Quetelet (1796-1874)–the average man and indices
of obesity. Nephrol Dial Transplant 2008, 23:47-51.
18. Okorodudu DO, Jumean MF, Montori VM, Romero-Corral A, Somers VK,
Erwin PJ, Lopez-Jimenez F: Diagnostic performance of body mass index
Miyahira et al. Journal of Translational Medicine 2011, 9:134
/>Page 9 of 10
to identify obesity as defined by body adiposity: a systematic review
and meta-analysis. Int J Obes 2010, 34:791-9.
19. Adams TD, Heath EM, LaMonte MJ, Gress RE, Pendleton R, Strong M,
Smith SC, Hunt SC: The relationship between body mass index and per
cent body fat in the severely obese. Diabetes Obes Metab 2007, 9:498-505.
20. Liu A, McLaughlin T, Liu T, Sherman A, Yee G, Tsao PS: Differential Intra-
abdominal Adipose Tissue Profiling in Obese, Insulin-resistant Women.
Obes Surg 2009, 19:1564-73.
21. Jackson AS, Ellis KJ, McFarlin BK, Sailors MH, Bray MS: Body mass index bias
in defining obesity of diverse young adults: the Training Intervention
and Genetics of Exercise Response (TIGER) Study. Br J Nutr 2009,
102:1084-90.
22. Razak F, Anand SS, Shannon H, Vuksan V, Davis B, Jacobs R, Teo KK,
McQueen M, Yusuf S: Defining Obesity Cut Points in a Multiethnic
Population. Circulation 2007, 115:2111-8.
23. Lee JW, Wang W, Lee YC, Huang MT, Ser KH, Chen JC: Effect of
laparoscopic mini-gastric bypass for type 2 diabetes mellitus:
comparison of BMI>35 and <35 kg/m2. J Gastrointest Surg 2008,
12:945-52.
24. Staub K, Ruhli FJ, Woitek U, Pfister V: BMI distribution/social stratification
in Swiss conscripts from 1875 to present. Eur J Clin Nutr 2010, 64:335-40.
25. National Institute of Diabetes and Digestive and Kidney Diseases:
Understanding adult obesity. NIH- Publ. n° 94-3680. Rockvilli, MD: National
Institute of Health; 1993.
26. Miyahira SA, Araujo E: Fuzzy obesity index for obesity treatment and
surgical indication. IEEE International conference on fuzzy systems (Fuzz-IEEE).
Hong Kong 2008, 2392-7.
27. Zadeh LA: Fuzzy control. Informat Control 1965, 8:338-53.
28. Zadeh LA: Probability measures and fuzzy events. J Math Anal Appl 1968,
23:421-7.
29. Eliasziw M, Donner A: Application of the McNemar test to non-
independent matched pair data. 2006.
30. World Health Organization: Western Pacific Region. The Asia-Pacific
perSDective: Redefining obesity and its treatment. WHO; 2000.
31. Romero-Corral A, Somers VK, Sierra-Johnson J, Thomas RJ, Collazo-
Clavell ML, Korinek J, Allison TG, Batsis JA, Sert-Kuniyoshi FH, Lopez-
Jimenez F: Accuracy of body mass index in diagnosing obesity in the
adult general population. Int J Obes 2008, 32:959-66.
32. Waisbren E, Rosen H, Bader AM, Lipsitz SR, Rogers SO, Eriksson E: Percent
Body Fat and Prediction of Surgical Site Infection. J Am Coll Surg 2010,
210:381-9.
33. Pan WH, Yeh WT: How to define obesity? Evidence-based multiple action
points for public awareness, screening, and treatment: an extension of
Asian-Pacific recommendations. Asia Pac J Clin Nutr 2008,
17:370-4.
34. Seising R: From vagueness in medical thought to the foundations of
fuzzy reasoning in medical diagnosis. Artificial Intelligence in Medicine
2006, 38:237-5.
35. Bedogni G, Malavoti M, Severi S, Poli M, MUssi C, Fantuzzi AF, Battisni N:
Accuracy of an eight-point tactile-electrode impedance method in the
assessment of total body water. Eur J Clin Nutr 2002, 56:1143-8.
36. Araujo E: Fuzzy Logic and Approximate Reasoning: Concepts and
Application. Synergismus scyentifica 2009, 04(2):1-16.
37. Miyahira SA, Araujo E: Miyahira-Araujo Fuzzy Obesity Index (MAFOI) for
Body Mass Index and Body Fat Clinical Analysis, Syndrome Assessment,
Classification and Treatment, and Surgical Indication. IEEE Trans on Fuzzy
Systems 2011.
doi:10.1186/1479-5876-9-134
Cite this article as: Miyahira et al.: Fuzzy obesity index (MAFOI) for
obesity evaluation and bariatric surgery indication. Journal of
Translational Medicine 2011 9:134.
Submit your next manuscript to BioMed Central
and take full advantage of:
• Convenient online submission
• Thorough peer review
• No space constraints or color figure charges
• Immediate publication on acceptance
• Inclusion in PubMed, CAS, Scopus and Google Scholar
• Research which is freely available for redistribution
Submit your manuscript at
www.biomedcentral.com/submit
Miyahira et al. Journal of Translational Medicine 2011, 9:134
/>Page 10 of 10