Báo cáo sinh học: " A SNR-based admission control scheme in WiFi-based vehicular networks" pot
Bạn đang xem bản rút gọn của tài liệu. Xem và tải ngay bản đầy đủ của tài liệu tại đây (1.68 MB, 37 trang )
This Provisional PDF corresponds to the article as it appeared upon acceptance. Fully formatted
PDF and full text (HTML) versions will be made available soon.
A SNR-based admission control scheme in WiFi-based vehicular networks
EURASIP Journal on Wireless Communications and Networking 2011,
2011:204 doi:10.1186/1687-1499-2011-204
Kihun Kim ()
Younghyun Kim ()
Sangheon Pack ()
Nakjung Choi ()
ISSN 1687-1499
Article type Research
Submission date 29 June 2011
Acceptance date 19 December 2011
Publication date 19 December 2011
Article URL />This peer-reviewed article was published immediately upon acceptance. It can be downloaded,
printed and distributed freely for any purposes (see copyright notice below).
For information about publishing your research in EURASIP WCN go to
/>For information about other SpringerOpen publications go to
EURASIP Journal on Wireless
Communications and
Networking
© 2011 Kim et al. ; licensee Springer.
This is an open access article distributed under the terms of the Creative Commons Attribution License ( />which permits unrestricted use, distribution, and reproduction in any medium, provided the original work is properly cited.
1
An SNR-based admission control scheme in
WiFi-based vehicular networks
Kihun Kim
1
, Younghyun Kim
1
, Sangheon Pack
∗1
and Nakjung Choi
2
1
School of Electrical Engineering, Korea University, Seoul, Korea
2
Alcatel-Lucent, Bell-Labs Seoul, Seoul, Korea
∗
Corresponding author:
KK:
YK: younghyun
NJ:
Abstract
In WiFi-based vehicular networks, the performance anomaly problem can be serious because different vehicles
with diverse channel conditions access the channel by a random access protocol. In this article, we first develop
a novel analytical model, which combines the vehicular traffic theory and WiFi properties to show the impact of
performance anomaly at the intersection. We then propose a signal-to-noise ratio (SNR)-based admission control
scheme that excludes vehicles with bad channel qualities to address the performance anomaly problem. Extensive
simulation and analytical results are presented to show the effect of the traffic condition and the topology. From
the simulation results, it can be found that the SNR-based admission control scheme can improve the overall
throughput, and starvation issues can be addressed by means of mobility in WiFi-based vehicular networks with
multiple intersections.
Keywords: performance anomaly; WiFi-based vehicular networks; SNR-based admission control; mobility.
2
1. Introduction
Recently significant progress has been made in vehicular networks to support mobile users. Vehicular
communications can be classified into vehicle-to-infrastructure (V2I) and vehicle-to-vehicle (V2V) com-
munications. In terms of communication technology, wireless local area network (WLAN) or WiFi [1],
wireless wide area network (WWAN) [2], or their combination [3] can be used in vehicular environments.
Even though the performance of WWAN has been improved over the past years, its data rate is still limited
compared with WLAN. Also, WWAN typically adopts a meter-rate-dependent monetary cost policy which
is a burden to users. Meanwhile open WiFi networks are deployed in many cities around the world and
thus WiFi-based vehicular networks are perceived as one of the most promising solutions.
In WiFi-based vehicular networks, users traveling by car usually come in range of multiple WiFi access
points (APs). While they are on their way, mobile users experience intermittent connectivity because of
the short range of a WiFi AP [4].
a
WiFi networks can be deployed at road sides and intersections. When
vehicles are in WiFi networks deployed at intersections, more dynamic channel qualities can be observed
compared with vehicles on the road side. This is because there always exist stopped cars as well as moving
cars at intersections. It is known that stopped cars have better channel qualities than moving cars [5], and
vehicles also experience different channel conditions dependent on the distance from an AP. In addition,
stopped cars at intersections have much longer association time with WiFi APs than moving cars at road
sides and thus the association time at an intersection needs to be used efficiently.
In carrier sensing multiple access/collision avoidance-based WLANs, each node has the same opportu-
nity to access the channel, and the channel utilization by a node can be defined as the ratio between the
transmission time of the node and the total transmission time of all other nodes. Then, nodes transmitting
at high transmission rates obtain the same throughput as the nodes transmitting at low transmission
rates, which is known as performance anomaly [6]. Because vehicles at an intersection have various
channel conditions, throughput degradation because of performance anomaly happens more apparently
at intersections rather than the road sides. To solve the performance anomaly problem, several studies
3
have been proposed, in which both fast and slow nodes capture the channel for the same amount of time
by means of packet fragmentation [7], backoff adaptation [8], or packet aggregation [9]. However, these
studies do not investigate the effect of mobility on the performance anomaly problem.
In this article, we investigate the performance anomaly problem at the intersection where stopped and
moving cars exist. In particular, we develop a novel analytical model, which combines the vehicular
traffic theory and WiFi properties to show the impact of performance anomaly at the intersection. We also
propose a signal-to-noise ratio (SNR)-based admission control scheme that excludes vehicles with bad
channel qualities as a remedy for the performance anomaly problem. Extensive simulation and analytical
results are presented to show the effect of the traffic condition and the topology, which demonstrate that
the SNR-based admission control scheme can improve the overall throughput, and starvation issues can
be addressed by means of mobility in WiFi-based vehicular networks with multiple intersections. To the
best of the authors’ knowledge, this is the first study to investigate and solve the performance anomaly
problem in WiFi-based vehicular networks.
The rest of this article is organized as follows. In Section2, related studies are summarized and the
system model is given in Section3. We then analyze the performance anomaly problem at the intersection
in Section 4 and present an SNR-based admission control scheme in Section5. Simulation and analytical
results are given in Section 6. Finally, Section7 concludes this article with future studies.
2. Related study
Ott and Kutscher [4] introduced the idea of Drive-thru Internet systems where the connection between a
vehicle and a roadside AP is opportunistically established during a travel, and they studied the performance
of UDP and TCP flows in vehicles moving at different speeds. Subsequently, many studies have been
conducted to verify the feasibility of WiFi-based vehicular networks [10] and to improve the performance
of Internet access in moving vehicles [11]. Also, interesting studies have been done to develop analytic
models that characterize salient features of Drive-thru systems [12]. However, most of them assume low
traffic density (i.e., a single vehicle in the coverage of an AP).
4
In urban environments, because of high traffic density, the channel contention among vehicles should
be considered. In a recent study [13], an analytical model is presented by considering the channel
contention. However, this study does not consider the performance anomaly problem. In WiFi-based
vehicular networks, vehicles in the coverage of an AP have different transmission rates because the
channel quality degrades proportionally to the distance from an AP and varies depending on the velocity
of vehicles. Hence, we need to consider not only the channel condition but also the diversity of transmission
rates in urban environments. In this study, we analyze the communication performance of a vehicle by
considering the performance anomaly problem that occurs in multi-rate environments.
To solve the performance anomaly problem, a number of schemes have been presented in the literature.
Most of them allow both nodes with high and low transmission rates to capture the channel for the same
amount of time, i.e., the time fairness is sustained. By doing so, the throughput degradation of nodes with
high transmission rates can be mitigated. The existing schemes can be classified into three categories:
packet fragmentation [7], contention window adaptation [8], and packet aggregation [9]. However, all of
these studies do not consider mobility. On the contrary, we try to solve the performance anomaly problem
by adopting admission control with the help of mobility in vehicular environments.
3. System model
In this study, we adopt a macroscopic vehicle model that aggregates vehicles into a flow and describes
the flow in terms of speed, density, and vehicle arrival rate. At an intersection, there exist many traffic
flows depending on the number of road segments and these flows can be classified into two types: green
light flow and red light flow. A green light flow is an aggregation of vehicles allowed to proceed with the
green light signal whereas a red light flow is a set of stopped vehicles at each road segment. These two
types of flows are separately investigated in this section. We summarized notations and their meanings in
Table 1.
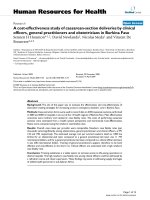
We first consider the green light flow (i.e., moving vehicles) as shown in Fig.1. S is the length of space
for each vehicle. L
i
is the transmission range of an AP when the specific transmission rate r
i
is used. L
i
5
is less than or equal to the maximum transmission range of an AP. Let q be the vehicle arrival rate that
counts the number of vehicles passing a fixed roadside observation point per unit time. v is the vehicle
speed and k is the vehicle density. Then, we have the following relationship:
q = kv. (1)
Based on [14], it can be found that there exists a linear relationship between the speed v and the density
k as
v = v
f
(1 −
k
k
jam
) (2)
where v
f
is the free-flow speed (i.e., the speed when the vehicle is alone on the road) and k
jam
is the
traffic jam density when traffic flow comes to a halt that is given by k
jam
= 1/S.
Given the vehicle arrival rate, v and k can be determined by using Equations 1 and 2 which describe
a homogeneous and equilibrium traffic flow passing through a road segment [15]. From [16], the vehicle
arrival can be approximated as a Poisson process with mean rate λ (i.e., q = λ). It is assumed that every
vehicle has the same speed v and the constant sojourn time T
i
in the coverage of 2L
i
. Therefore, the
sojourn time T
i
can be obtained as T
i
= 2L
i
/v. Under these conditions, an M/D/C/C queueing system
can be used to model the green light flow [13]. Then, the steady-state probability p
N
with N vehicles in
the coverage of an AP 2L
i
is given by
p
N
=
(λT
i
)
N
N!
C
i
j=0
(λT
i
)
j
j!
(3)
where 0 ≤ N ≤ C
i
. C
i
is the maximum number of vehicles in the coverage of an AP, which is given
by C
i
= 2k
jam
L
i
= 2L
i
/S. Based on this model, when the vehicle arrival rate q is given, the number of
vehicles using a specific transmission rate can be computed.
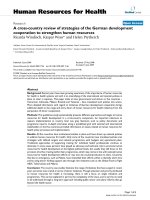
As shown in Fig.2, in a red light flow, vehicles are accumulated until the end of the red light signal.
Hence, the elapsed time since the light turned red I is an important factor to model the red light flow.
M is the number of remaining vehicles after the last green light signal. During I, there will be incoming
vehicles with rate q and thus the number of arrived vehicles is qI. Therefore, the number of remaining
6
vehicles, M, is given by qI −E where E is the number of outgoing vehicles during the green light signal
and E can be estimated from simulation results. On the other hand, if the number of outgoing vehicles
is larger than that of incoming vehicles, M is simple 0. Consequently, M can be expressed as
M =
qI − E, for qI ≥ E (4a)
0, otherwise (4b)
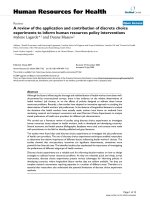
As shown in Fig. 3, the number of vehicles in the transmission range L
i
increases up to L
i
/S with the
increase of I and remains at the value. By taking an integral of the area in Fig. 3 for given input rate q
and time period I, the average number of vehicles during the time period I in the range of L
i
can be
obtained as
E[N] =
1
I
I
0
min (M + qt, L
i
/S)dt. (5)
In short, if the number of road segments at an intersection and the arrival rate of vehicles at each road
segment are known, the number of vehicles using specific transmission rates can be found from Equations
3 and 5.
4. Problem statement
When N nodes exist in an IEEE 802.11 WLAN, the overall transmission time T (N) can be expressed
as
T (N) = t
tr
+ t
ov
+ t
cont
(N) (6)
where t
tr
is the MAC protocol data unit (MPDU) transmission time and t
ov
is the constant overhead that
includes DIFS = 50 µs, SIFS = 10 µs, MAC acknowledgement transmission time t
ack
, and physical layer
convergence protocol (PLCP) preamble and header transmission time t
pr
. t
pr
is dependent on the selected
transmission rate. For example, when the transmission rate is 1Mbps, t
pr
is 192 µs and t
pr
is 96 µs for
other transmission rates. t
cont
(N) is the time due to channel contention.
Assume that N nodes use different transmission rates and they can be classified into several groups
depending on the transmission rate. Let G
i
be the group of nodes with the ith highest transmission rate
7
r
i
and N
i
be the number of nodes included in G
i
. t
r
i
ov
is the constant overhead of a node in G
i
. If the
propagation time is neglected, the overall transmission time of a node in G
i
is
T
i
=
D
r
i
+ t
r
i
ov
+ t
cont
(N) (7)
where D is the MPDU size.
Based on [6], it can be found that each node has the same throughput X regardless of transmission
rates, and X is obtained from
X =
D
b
i=1
N
i
× T
i
+ P
C
(N) × T
jam
(N) × N
(8)
where T
jam
(N) is the average time spent by collisions and b is the number of groups. P
C
(N) is the
conditional collision probability that is given by
P
C
(N) = 1 − (1 −
1
CW
min
)
N−1
(9)
where CW
min
is the minimum contention widow size.
From Equation 8, it can be seen that the throughput is determined by the number of nodes and the
transmission time. Since a node with a low transmission rate leads to longer transmission time, the
throughput X will be decreased significantly as the number of nodes with lower transmission rates
increases, which is a well-known performance anomaly problem [6]. Figure 4 shows the throughput of
a node when only one node uses 11 Mbps and others use lower rates (1, 2, or 5.5Mbps). Owing to
the performance anomaly, the throughput decreases as the number of nodes using low rates increases.
Apparently, the throughput drop happens more seriously when 1Mbps nodes exist compared with the case
when 2 or 5.5Mbps nodes exist.
As mentioned earlier, two types of cars exist at an intersection: stopped and moving cars (see Fig. 5).
Typically, moving cars may have worse channel quality (i.e., lower transmission rate) than stopped
cars [5]. Moreover, stopped cars have different transmission rates because the channel quality degrades
proportionally to the distance from the AP. Consequently, the performance anomaly problem is more
8
serious at intersections in vehicular networks. To mitigate the impact of performance anomaly, we introduce
an SNR-based admission control scheme in Section 5, which limits the number of nodes with low
transmission rates for improving the overall throughput.
5. SNR-based admission control scheme
Most of the schemes to address the performance anomaly problem guarantee the time fairness among
nodes regardless of their transmission rates. Our approach is different from them because the proposed
scheme does not allow nodes with low transmission rates to capture the channel at all to prevent the
performance anomaly problem via admission control. The amount of time taken from nodes with low
transmission rates can be used by nodes with high transmission rates, and thus high rate nodes can transmit
more packets than low rate nodes during the same time period. Consequently, the overall performance of
IEEE 802.11 networks can be improved.
Specifically, we propose an SNR-based admission control scheme where the AP estimates the SNR
through association procedures.
b
IEEE 802.11 WLAN defines two scanning modes for association: active
and passive scannings. In both modes, a vehicle can estimate the SNR by receiving a probe response (in
active mode) or beacon frames (in passive mode). After that, the estimated SNR information is reported
to the AP by means of an association request frame.
c
Based on the SNR estimation, the AP performs an
admission control scheme which key idea is to exclude vehicles with low transmission rates. By doing
so, the performance anomaly problem can be mitigated and the overall throughput can be improved. The
detailed procedure is as follows.
1) All the vehicles in the range of the AP estimate their SNRs after receiving a beacon frame or a
probe response frame from the AP. To mitigate the effect of SNR variations, SNR values from
multiple beacon or probe response frames can be averaged [17].
2) An association request frame including the estimated SNR is sent to the AP.
3) The AP classifies vehicles into b groups from G
1
to G
b
based on the transmission rate selected
depending on the SNR.
9
4) As shown in Table 2, the AP constructs a decision criterion table that includes the expected through-
put of a super group (1, ,l), which is a union of groups from G
1
to G
l
, is given by
X
l
=
D
l
i=1
N
i
× T
i
+ P
C
(N) × T
jam
(N) × N
(10)
where 1 ≤ l ≤ b. This table also includes member groups of the super group, the proportion of
vehicles involved in the super group, and SNR
i
which is the SNR threshold to be a member of G
i
.
5) From Table2, the AP can check the threshold SNR to keep the expected throughput above a certain
value. For example, SNR
1
can be selected to provide vehicles with throughput higher than X
2
.
Note that SNR
x
> SNR
y
and X
x
> X
y
if x < y where x, y ∈ {1, . . . , b}. This is because the
overall throughput degrades when vehicles with low transmission rates are associated with an AP
(see Section4).
6) Finally, the AP sends an association response frame only to vehicles with higher SNRs than the
threshold.
Figures 6 and 7 show detailed actions performed by the AP and the vehicle, respectively. Note that the
proposed admission control scheme can be implemented at the commodity WiFi standards without any
significant modifications.
In the SNR-based admission control scheme, vehicles associated with an AP can communicate without
any significant impact of performance anomaly. However, other vehicles excluded through admission
control cannot transmit data at all. Consequently, the SNR-based admission control scheme may lead to
a starvation issue at an AP. However, when we consider mobility over a traveling path with a number
of APs, the starvation problem can be addressed as follows. In urban environments, a vehicle usually
passes through multiple intersections during a travel and opportunistically experiences various channel
conditions. At an intersection, the vehicle may be excluded as a result of admission control and thus may
not receive any data. However, at other intersections after movements, the vehicle can communicate with
APs, i.e., after moving entire traveling path the vehicle can receive more data than the case in which
10
admission control is not used. More investigations on the starvation issue will be given in the following
section through simulations.
6. Performance evaluation
In this section, we evaluate the performance of the SNR-based admission control scheme and investigate
the effect of performance anomaly at an intersection via VISSIM [18] and analysis. VISSIM is a micro-
simulation software developed to model urban traffic environments. In VISSIM, car movement models
are categorized into Wiedemann 74 and Wiedemann 99 models. The Wiedemann 74 model is suitable in
urban environments, whereas the Wiedemann 99 model is applicable to inter-urban environments [19]. We
choose the Wiedemann 74 model for simulating urban traffic environments. Unless explicitly mentioned,
the network topology consists of three-lane roads and four-way intersections with IEEE 802.11b WLAN
APs. At a multi-way intersection, a traffic signal cycle consists of red and green light signals and it is
assumed only one lane is allowed to pass at the same time. The AP transmission ranges are dependent on
transmission rates as shown in Table3 [20]. Other WLAN parameters follow the IEEE 802.11b standard
values and the frame size is 1500bytes. In an intersection, we use a fixed time traffic control system that
operates with the constant cycle length, phase sequence, and green time during every cycle. In this study,
we focus on elastic data download services in vehicular network with opportunistic (or intermittent) WiFi
connectivity, and thus the handoff and car start times are not considered. Therefore, the throughput can
be computed by dividing the total amount of data during travel with the total traveling time.
A. Effect of traffic condition
We first evaluate the network throughput at a single intersection for each super group with respect
to the vehicle arrival rate. First of all, Fig. 8 indicates that the simulation results are well matched with
the analytical results except the super group (1,2,3,4). The analytical model on the number of moving
vehicles is based on the M/D/C/C queueing model described in Section 3. It can be found that the
11
analytical numbers are slightly higher than the simulation results, i.e., the analytical result for the super
group (1,2,3,4) overestimates the network throughput.
From Fig. 8, it can be shown that the network throughput decreases with the increase of the number
of vehicles due to more collisions in the IEEE 802.11 MAC layer. Also, Fig. 8 indicates that, for a small
number of vehicles/hour, the network throughput of each super group except the super group (1,2,3,4)
shows almost the same value. However, when the number of vehicles/hour exceeds 1400 vehicles/hour,
the network throughputs of the super groups (1,2) and (1,2,3) drop drastically. This can be explained as
follows. When the number of vehicles/hour is less than 1400 vehicles/hour, all these vehicles use 11Mbps
and thus no performance anomaly occurs. On the contrary, if the number of vehicles/hour is larger than
1400 vehicles/hour, the distances between the AP and some vehicles are larger than the 11Mbps range (i.e.,
48.2 m in Table 3) and therefore these vehicles should use low transmission rates such as 5.5/2/1Mbps,
which results in the throughput degradation due to performance anomaly.
Similarly, it can be shown that the network throughput of the super group (1,2,3) also drops at the
point of 1900 vehicles/hour. The network throughput of the super group (1), on the other hand, does not
experience significant drops at the points of 1400 and 1900 vehicles/hour. This is because all vehicles
associated with the AP can transmit data at the highest transmission rate (i.e., 11 Mbps) and therefore the
performance anomaly problem does not occur. Owing to the same reason, the super group (1,2) does not
experience significant throughput degradation at the point of 1700 vehicles/hour.
When no admission control scheme is used (i.e., super group (1,2,3,4)), the network throughput is
less than a half of the throughputs of the other super groups for every arrival rate because performance
anomaly happens in the super group (1,2,3,4) regardless of the arrival rate. From Fig. 8, the network
throughput variation remains when the arrival rate exceeds the point of 2500 vehicles/hour. At this point,
the transmission range of an AP is already fully occupied with vehicles. Thus, the network throughputs
are not affected by the arrival rate any more. Only depending on the groups accepted by the AP, the
network throughput is determined.
12
Figure 9 shows the simulation result on the number of vehicles included in each group under different
traffic signal cycle lengths at an one-lane four-way intersection when the vehicle arrival rate is 900
vehicles/hour. Traditionally, the traffic signal cycle length is extended to reduce the start loss time caused
by frequent starts in each traffic signal cycle. However, it can be found that as the traffic signal cycle length
decreases, the number of stopped vehicles in the transmission range of an AP decreases and thus only
the group of vehicles with 11Mbps remains. This is because vehicles are accumulated during a shorter
time period as the traffic signal cycle length decreases. As a result, the performance anomaly problem
does not happen when the traffic signal cycle length is short.
B. Effect of topology
In this section, we present simulation results to assess the performance of the proposed admission
control scheme under different network topologies.
As demonstrated in Fig. 8, even though the super group (1) exhibits the highest throughput, all vehicles
in the super group (2,3,4) cannot transmit any data at some APs and thus starvation issues can occur.
However, this starvation issue can be addressed at multiple intersection environments. To justify this, more
realistic topologies are considered and the effects of mobility and topology in urban environments are
investigated.
In urban environments, vehicles usually move through multiple intersections. Hence, we consider
traveling paths including multiple intersections in two urban areas at Korea (i.e., Myeong-dong and
Gangnam) as shown in Figs. 10 and 11. Vehicles following these paths are observed to measure the
average received data and the minimum received data by a vehicle during a travel. We assume that every
road segment around intersections has full traffic density, i.e., each lane is fully populated by vehicles up
to the end of the transmission range of an AP.
Figures 12 and 13 show the average received data by a vehicle at Myeong-dong and Gangnam, respec-
tively, for different numbers of intersections and for each super group associated with the AP. Intuitively,
the total number of bytes increases as the number of intersections increases and/or groups using low
13
transmission rates are excluded. In particular, it can be found that the exclusion of groups using low
transmission rates leads to significant performance enhancement compared to the case when the admission
control is not used (i.e., super group (1,2,3,4)). It is the best choice to support the super group (1) in terms
of average throughput regardless of the number of intersections. However, in this case, more vehicles are
excluded through admission control and they can experience starvation.
As depicted in Fig.14, in the worst case, some vehicles may not receive any data at all even after
passing through two intersections when the AP allows only super groups (1) or (1,2). However, as the
number of intersections increases, vehicles with admission control (i.e., (1), (1,2), and (1,2,3)) can receive
much more data than the case when no admission control is used (i.e., (1,2,3,4)) even in the worst case.
In other words, the starvation problem induced by admission control can be mitigated as the number of
intersections increases. Similar trends can be observed at Gangnam as shown in Fig.15. In short, the
starvation issue can be resolved in realistic vehicular environments where a number of intersections exist.
As shown in Fig.8, performance anomaly is apparent for the super group (1,2,3), and therefore we
analyze the network throughput of a super group (1,2,3) depending on the number of ways and lanes at a
single intersection with the fixed traffic signal cycle length. From Fig.16, it can be seen that throughput
degradation occurs earlier at a five-way intersection than others. With the fixed traffic signal cycle length,
the red light signal (i.e., the stop signal) length increases with the increase of the number of ways because
the traffic signal cycle time is fairly distributed to each road segment. For example, when the signal
cycle length is 120, 40, and 30 s are assigned to each way in three-way and four-way intersections,
respectively. Then, a vehicle in the three-way intersection should wait for 80(= 40 + 40) s during the
red light signal because vehicles in other two lanes should pass away. In the same manner, a vehicle
in the four-way intersection should wait for 90(= 30 + 30 + 30) s during the red light. As a result, for
a five-way intersection, vehicles are accumulated during a longer time period and performance anomaly
happens earlier if the fixed traffic signal cycle length is assumed.
To see the effect of the number of lanes at an intersection, the network throughput of a super group (1,
14
2, 3) is analyzed with respect to the vehicle arrival rate at a four-way intersection as shown in Fig.17.
As the number of lanes increases, the space available for vehicles at each road segment enlarges and thus
more vehicles can be located close to an AP. Hence, vehicles can communicate with an AP at a higher
transmission rate and performance anomaly happens slowly as the number of lanes increases.
7. Conclusion
In this article, we proposed an SNR-based admission control scheme to address the performance anomaly
problem in WiFi-based vehicular networks. Even though a starvation problem can occur at a single
intersection AP, its impact becomes insignificant as the number of intersections increases (i.e., multiple
intersection environments). Simulation and analytical results show that the SNR-based admission control
scheme can improve the network throughput and mitigate the effects of performance anomaly. As future
studies, we will devise more sophisticated admission control schemes for IEEE 802.11p networks, in which
more accurate channel estimation methods will be introduced and fairness issues will be investigated.
Acknowledgment
This study was supported in part by the National Research Foundation of Korea Grant funded by the
Korean Government (2009-0064397) and in part by the BLS project funded by Seoul Metropolitan City
(Seoul R&BD Program (WR080951). A preliminary version of this article was presented at International
Wireless Communications and Mobile Computing (IWCMC) Conference 2011, July 2011.
Competing interests
The authors declare that they have no competing interests.
Endnotes
a
Such a network is also known as a Drive-thru system [4].
b
When a vehicle has high speed, the channel
condition at the frame transmission may be different from the channel condition at the association, and
thus the admission control result may not be appropriate. However, since the vehicle will pass away the
15
AP quickly, the impact of high speed vehicle is limited to the short time and therefore we do not design
any special mechanism for high-speed vehicles.
c
In IEEE 802.11p, an amendment for wireless access
in vehicular environments (WAVE), there are no interactive steps between the AP and nodes to perform
association operation. However, our work is based on commodity WiFi techniques such as 802.11b/a/g.
The extension to IEEE 802.11p is one of our future works.
REFERENCES
[1] A Balasubramanian, R Mahajan, A Venkataramani, BN Levine, J Zahorjan, Interactive WiFi connectivity for moving vehicles, in Proc.
ACM SIGCOMM 2008, August 2008
[2] S Tenorio, P Spence, B Garriga, J Lopez, A Garcia, M Arranz, 3G HSPA for broadband communications with high speed vehicles, in
Proc. IEEE VTC 2010, May 2010
[3] BB Chen, MC Chan, MobTorrent: a framework for mobile internet access from vehicles, in Proc. IEEE INFOCOM 2009, April 2009
[4] J Ott, D Kutscher, Drive-thru internet: IEEE 802.11b for “automobile” users, in Proc. IEEE INFOCOM 2004, March 2004
[5] J Camp, E Knightly, Modulation rate adaptation in urban and vehicular environments: cross-layer implementation and experimental
evaluation, in Proc. ACM MOBICOM 2008, September 2008
[6] M Heusse, F Rousseau, G Berger-Sabbatel, A Duda, Performance anomaly of 802.11b, in Proc. IEEE INFOCOM 2003, March 2003
[7] J Dunn, M Neufeld, A Sheth, D Grunwald, J Bennett, A practical cross-layer mechanism for fairness in 802.11 networks, in Proc.
BROADNETS 2004, October 2004
[8] M Heusse, F Rousseau, R Guillier, A Duda, Idle sense: an optimal access method for high throughput and fairness in rate diverse
wireless LANs, in Proc. ACM SIGCOMM 2005, August 2005
[9] B Sadeghi, V Kanodia, A Sabharwal, E Knightly, Opportunistic media access for multirate ad hoc networks, in Proc. ACM MOBICOM
2002, September 2002
[10] V Bychkovsky, B Hull, A Miu, H Balakrishnan, S Madden, A measurement study of vehicular internet access using in situ Wi-Fi
networks, in Proc. ACM MOBICOM 2006, September 2006
[11] Z Zheng, Z Lu, P Sinha, S Kumar, Maximizing the contact opportunity for vehicular internet access, in Proc. IEEE INFOCOM 2010,
March 2010
[12] N Banerjee, M Corner, D Towsley, B Levine, Relays, base stations, and meshes: enhancing mobile networks with infrastructure, in
Proc. ACM MOBICOM 2008, September 2008
[13] W Tan, W Lau, O Yue, T Hui, Analytical models and performance evaluation of drive-thru internet systems. IEEE J. Sel. Areas
Commun. 29(1), 207–222 (2011)
[14] J Fricker, R Whitford, Fundamentals of Transportation Engineering: A Multimodal Systems Approach (Prentice Hall, 2004)
VISSIM, />16
[15] A Klar, R Kuehne, R Wegener, Mathematical models for vehicular traffic. Surv. Math. Indus. 6, 215–239 (1996)
[16] T Woensel, N Vandaele, Modeling traffic flows with queueing models: a review. Asia Pac. J. Oper. Res. 24, 435–461 (2007)
[17] A Wiesel, J Goldberg, H Messer-Yaron, SNR estimation in time-varying fading channels. IEEE Trans. Commun. 54(5), 841–848 (2006)
[18]
[19] VISSIM 5.30 User Manual. pp. 128–145 (2010)
[20] P Liu, Z Tao, S Panwar, A cooperative MAC protocol for wireless local area networks, in Proc. IEEE ICC 2005, June 2005
17
Fig. 1. Green light flow.
Fig. 2. Red light flow.
Fig. 3. Number of vehicles in AP transmission range versus elapsed time.
Fig. 4. Throughput of an IEEE 802.11b node when only one node uses 11Mbps and others use lower rates.
Fig. 5. Vehicles at an intersection.
Fig. 6. Flow chart of AP.
Fig. 7. Flow chart of vehicle.
Fig. 8. Network throughput versus traffic load (signal cycle length = 140 s).
Fig. 9. Number of vehicles in each group at one-lane four-way intersection (vehicle arrival rate = 900 vehicles/hour).
Fig. 10. Traveling path at Myeong-dong: Vehicles follow the path from S to D.
Fig. 11. Traveling path at Gangnam: Vehicles follow the path from S to D.
Fig. 12. Average received data size over multiple intersections in Myeong-dong (signal cycle length = 140 s).
Fig. 13. Average received data size over multiple intersections in Gangnam (signal cycle length = 140 s).
Fig. 14. Minimum received data size over multiple intersections in Myeong-dong (signal cycle length = 140 s).
Fig. 15. Minimum received data size over multiple intersections in Gangnam (signal cycle length = 140 s).
Fig. 16. Network throughput versus number of ways at intersection (signal cycle length = 140s and super group (1,2,3)).
Fig. 17. Network throughput versus number of lanes (signal cycle length = 140s and super group (1,2,3)).
18
TABLE 1
Notations and meanings
Notation Meaning
S Length of space for each vehicle
L
i
Transmission range of an AP when the specific transmission rate r
i
is used
q Vehicle arrival rate that counts the number of vehicles passing a fixed roadside observation point per unit time
v Vehicle speed
k Vehicle density
v
f
Speed when the vehicle is alone on the road
k
jam
Traffic jam density when traffic flow comes to a halt
λ Mean vehicle arrival rate
T
i
Sojourn time in the coverage of 2L
i
p
N
Steady state probability with N vehicles in the coverage of an AP
C
i
Maximum number of vehicles in the coverage of an AP
I Elapsed time since the light turned red
M Number of remaining vehicles after the last green light signal
E Number of outgoing vehicles during the green light signal
T (N) Overall transmission time of a single node when N nodes exist
t
tr
MAC protocol data unit (MPDU) transmission time
t
ack
MAC acknowledgement transmission time
t
pr
Physical layer convergence protocol (PLCP) preamble and header transmission time
t
ov
Constant overhead that includes DIFS = 50 µs, SIFS = 10 µs, t
ack
, and t
pr
t
cont
(N) Channel contention time when N nodes exist
G
i
Group of nodes with the ith highest transmission rate r
i
N
i
Number of nodes included in G
i
t
r
i
ov
Constant overhead time of a node in G
i
T
i
Overall transmission time of a node in G
i
T
jam
(N) Average time spent by collisions when N nodes exist
b Number of groups
P
C
(N) Conditional collision probability when N nodes exist
CW
min
Minimum contention widow size
X
l
Expected throughput of a super group (1, ,l)
SNR
i
SNR threshold to be a member of G
i
TABLE 2
Decision criterion table
Throughput Groups Proportion of groups Threshold SNR
X
1
G
1
N
1
/N SNR
1
X
2
G
1
+ G
2
N
1
+N
2
/N SNR
2
X
b
b
i=1
G
i
1 SNR
b
19
TABLE 3
Transmission rate vs. transmission range
Transmission rate 11 Mbps 5.5Mbps 2Mbps 1 Mbps
Range 48.2 m 67.1 m 74.7m 100 m
Figure 1
Figure 2
Figure 3
Figure 4
Figure 5