Báo cáo sinh học: " Effect of oligonucleotide primers in determining viral variability within hosts" ppt
Bạn đang xem bản rút gọn của tài liệu. Xem và tải ngay bản đầy đủ của tài liệu tại đây (296.33 KB, 8 trang )
BioMed Central
Page 1 of 8
(page number not for citation purposes)
Virology Journal
Open Access
Methodology
Effect of oligonucleotide primers in determining viral variability
within hosts
Maria Alma Bracho*
†
, Inmaculada García-Robles
†
, Nuria Jiménez,
Manuela Torres-Puente, Andrés Moya and Fernando González-Candelas
Address: Institut Cavanilles de Biodiversitat i Biologia Evolutiva, Universitat de València, Edifici Instituts, Polígon "La Coma" s/n, Paterna
(València) 46980 SPAIN
Email: Maria Alma Bracho* - ; Inmaculada García-Robles - ; Nuria Jiménez - ;
Manuela Torres-Puente - ; Andrés Moya - ; Fernando González-Candelas -
* Corresponding author †Equal contributors
Abstract
Background: Genetic variability in viral populations is usually estimated by means of polymerase
chain reaction (PCR) based methods in which the relative abundance of each amplicon is assumed
to be proportional to the frequency of the corresponding template in the initial sample. Although
bias in template-to-product ratios has been described before, its relevance in describing viral
genetic variability at the intrapatient level has not been fully assessed yet.
Results: To investigate the role of oligonucleotide design in estimating viral variability within hosts,
genetic diversity in hepatitis C virus (HCV) populations from eight infected patients was
characterised by two parallel PCR amplifications performed with two slightly different sets of
primers, followed by cloning and sequencing (mean = 89 cloned sequences per patient). Population
genetics analyses of viral populations recovered by pairs of amplifications revealed that in seven
patients statistically significant differences were detected between populations sampled with
different set of primers.
Conclusions: Genetic variability analyses demonstrates that PCR selection due to the choice of
primers, differing in their degeneracy degree at some nucleotide positions, can eclipse totally or
partially viral variants, hence yielding significant different estimates of viral variability within a single
patient and therefore eventually producing quite different qualitative and quantitative descriptions
of viral populations within each host.
Background
One of the most difficult tasks faced by virologists is the
documentation and evaluation of the genetic variability
of viral populations in infected patients. These analyses
are greatly facilitated by the use of the polymerase chain
reaction (PCR). PCR based techniques do not always pro-
duce a highly specific and homogeneous product. When
the template is a complex mixture of homologous
sequences the aim of the amplification would be to pre-
serve as much as possible the template-to-product ratios
of every sequence in order to obtain a good representation
of the diversity present in the initial sample. PCR products
are derived from templates by a process involving com-
plex chemical kinetics, and the relative abundance of the
Published: 09 December 2004
Virology Journal 2004, 1:13 doi:10.1186/1743-422X-1-13
Received: 22 October 2004
Accepted: 09 December 2004
This article is available from: />© 2004 Bracho et al; licensee BioMed Central Ltd.
This is an Open Access article distributed under the terms of the Creative Commons Attribution License ( />),
which permits unrestricted use, distribution, and reproduction in any medium, provided the original work is properly cited.
Virology Journal 2004, 1:13 />Page 2 of 8
(page number not for citation purposes)
different homologous genomes among the final products
is often a parameter of interest. This is the case, for
instance, in experiments aimed at determining natural
diversity in microbial communities [1] or at identifying
members of multigene families [2] and it is of special rel-
evance for studies of viral variability within hosts, espe-
cially for highly variable RNA viruses.
The precise mechanisms involved in the preferential
amplification of some templates from non-homogeneous
sources are not fully understood and should be differenti-
ated from those related to stochastic or tube-to-tube vari-
ations in amplification efficiency. When dealing with
heterogeneous templates, two different processes can alter
template-to-product ratios: PCR selection and PCR drift
[3]. The former comprises mechanisms that favour the
amplification of certain templates leading to their over-
representation in the final product. Preferential denatura-
tion due to GC content (in overall template and primer),
differential efficiency of primer hybridisation or differen-
tial DNA polymerase extension rates (due to secondary
structures of DNA) can all account for this type of bias.
The second type of bias is related to stochastic variation in
the early cycles of the reaction and its outcome should
therefore be different in replicate PCR experiments. How-
ever, in a recent report analysing sampling strategies and
repeatability to determine genetic variability in viral pop-
ulations [4], we did not detect such PCR drift-caused bias.
Given the high levels of variability found in RNA virus
populations, primers involved in RT-PCR (retrotranscrip-
tion followed by PCR) are usually designed as degenerate
sequences to ensure that the chance of amplifying the dif-
ferent sequences present in an heterogeneous template
will be more uniform and, therefore, all will be present in
the amplified product in similar proportions to those in
the original template. However, the use of even highly
degenerate primers does not preclude the possibility of
mismatches occurring between a given primer and some
of the sequences present in a heterogeneous template,
especially for highly variable regions. This would lead to
differential amplification of sequences [5] (i.e. PCR selec-
tion, see above). Although unnoticed for the experi-
menter, if this preferential amplification does indeed
occur, conclusions of many evolutionary studies, clinical
predictions or even genotyping assessments would be
affected.
Hepatitis C virus (HCV) is a positive-sense, single-
stranded RNA virus of approximately 9.4 kb, classified in
a separate genus (Hepacivirus) of the Flaviviridae family.
HCV has been recognised as a major etiological agent of
acute and chronic hepatitis, cirrhosis, and hepatocellular
carcinoma around the world [6]. HCV isolates can be
highly divergent and have been classified into six major
genotypes and more than 30 subtypes based on molecular
phylogenetic analysis [7]. Moreover, like most RNA virus,
HCV circulates in vivo as a highly polymorphic popula-
tion of genetically closely related variants. This genetic
variability may have implications not only for pathogene-
sis and prevention [8], but also for predicting the thera-
peutic outcome of HCV infection during interferon
therapy [9,10].
Results
Population and phylogenetic analyses
Genetic variability in two different regions of the HCV
genome was studied by means of RT-PCR amplification in
eight infected patients. A fragment comprising partially E1
and E2 region including HVR1 and HVR2 (hypervariable
regions 1 and 2, respectively) was amplified in six infected
patients. In the other two patients, part of the NS5A region
including the ISDR (interferon-sensitivity determining
region) and the variable region 3 (V3) was amplified.
Each fragment was amplified twice from each HCV
infected patient with two slightly different sets of primers
(Table 1). Differences between primer sets 1 and 2 for
both regions are based on degeneracy of some nucleotide
positions, with primer set 2 being more degenerate than
primer set 1, except for primer 2-Ng2 (Table 1). After clon-
ing and sequencing, about 100 sequences for the E1E2
region and about 50 sequences for the NS5A region were
obtained from each patient and set of primers. Therefore,
from each patient we obtained two different groups (pop-
ulations) of sequences corresponding to the two parallel
PCR reactions performed with primer sets 1 and 2
respectively.
Two types of population analysis were carried out (Addi-
tional file 1) with the two groups of sequences from each
patient: (a) common measures of genetic variability
within each group of sequences, and (b) a population
genetics test that detects differentiation between groups of
sequences (permutation test of Hudson [19]). In addi-
tion, for each genomic region, a phylogenetic reconstruc-
tion using all detected haplotypes obtained with the two
sets of primers was performed in order to visually inspect
their distribution along the branches.
Differences between groups of sequences from the same
infected patient
HCV genetic variability estimates from sequence data
obtained for one of the two regions analysed for the eight
infected patients showed a wide range of values (Addi-
tional file 1). For the E1E2 region, the number of poly-
morphic sites (S) detected in a group of sequences from a
particular set of primers ranged from 1 (in patient E04) to
68 (in patient E16). Similarly, for region NS5A, with only
two patients analysed, S ranged from 4 to 70 for the same
Virology Journal 2004, 1:13 />Page 3 of 8
(page number not for citation purposes)
set of primers (patients N02 and N07, respectively). Hap-
lotype diversity (H
T
) also reached both extreme values: in
some groups of sequences corresponding to a particular
primer set from a single patient (i. e. E10, E16, N07),
almost every sequence constituted a different haplotype,
resulting in H
T
~ 1; whereas in other groups (i. e. E03, E04,
E25) very few haplotypes were detected, with H
T
~ 0.1 or
even lower. When variability was measured taking both
the frequencies of haplotypes and their genetic distances a
wider variability range was observed: nucleotide diversity
(
π
) of the viral populations estimated for the eight
patients analysed differed by up to three orders of magni-
tude (Additional file 1).
The statistical significance of the observed differences in
amount of genetic variation among groups of sequences
could not be tested as no appropriate statistical test is cur-
rently available (but see [21]). However, the statistical sig-
nificance of population differentiation can be evaluated
between pairs of groups of sequences. In this way, for each
patient the statistic and its corresponding P value was esti-
mated using the permutation test [19].
Only for one patient the outcomes from the two parallel
PCR amplifications were not significantly different. In
patient E25, the use of different primers set seemed not to
affect variability measures, although primer set 1 recov-
ered more variability for all measurements than set 2. This
is the only patient for which the average number of pair-
wise nucleotide substitutions (k) between both groups of
sequences was lower than k obtained for a single primer
set (e. g. primer set 2). Moreover, the main haplotype was
similarly sampled by the two sets of primers (48 and 44
sequences respectively, see additional file 1), and there-
fore no significant statistical genetic differentiation
between the two groups of sequences was detected. The
distribution of viral sequences in the phylogenetic tree
(Fig. 1a) shows that sequence sampling with the two sets
of primers can be considered very similar for this patient.
For the remaining patients we found that each set of prim-
ers produced a very different collection of viral sequences,
leading to significant genetic differentiation between the
two groups of sequences obtained with each primer set.
However, in patients E10, E23 and N07, the total amount
of variability recovered with both sets of primers was sim-
ilar (Additional file 1), although the distribution of
haplotypes detected with each primer set in the phyloge-
netic tree was not homogeneous (Fig. 1a and 1b). Moreo-
ver, population differentiation tests showed that the
groups of sequences obtained with different primer sets
for these three patients were significantly different. Even
for patient E10, for which both groups of sequences were
the most diverse of all analysed in this report and were
apparently intermixed in the phylogenetic tree, the differ-
entiation test detected significant differences.
In patients E03, E04, E16 and N02 the population differ-
entiation statistic ( ) also showed that the two groups of
sequences obtained from each patient were statistically
different, with genetic distances (k) between the two
groups of sequences from the same patient largely exceed-
ing the genetic distances estimated within a single group
of sequences. Moreover, in these four patients, the
amount of genetic variability detected also seemed to be
deeply affected by the set of primers chosen for PCR (see
Table 1: List of primers for the E1E2 and NS5A regions of HCV
Region Primer name
a
Nucleotide position
b
Primer set Sequence 5'-3'
c
Primer degeneracy
E1E2 1-Eg1 1290–1309 1 CGCATGGCATGGRATATGAT 2
2-Eg1 1290–1309 2 CGCATGGCYTGG
GAYATGAT 4
1-Eg2 1300–1321 1 GG
RATATGATGATGAACTGGTC 2
2-Eg2 1300–1321 2 GG
GATATGATRATGAAYTGGTC 4
1-Ea 1873–1854 1 GGAGTGAAGCARTATACTGG 2
2-Ea 1873–1854 2 GGGGTGAARCARTAYACYGG 16
NS5A 1-Ng1 6715–6739 1 TGGAYGGGGTGCGCCTACAT
AGGTW 4
2-Ng1 6715–6739 2 TGGACGGGGTGYGMCTRCAY
AGGTT 16
1-Ng2 6734–6753 1 TAGGT
WYGCSCCCCCYTGCA 16
2-Ng2 6734–6753 2 TAGGT
TYGCGCCCCCYTGCA 4
1-Na 7519–7503 1 CCCTCSAGRGGGGGCAT 4
2-Na 7519–7503 2 CCYTCSARGGGRGGCAT 16
a
g indicates genomic sense and a indicates antigenomic sense.
b
Nucleotide positions according to sequence accession no. M62321.
c
Nucleotides in bold indicate differences between primer sets and underlined nucleotides indicate overlapping positions of nested primers.
k
s
*
Virology Journal 2004, 1:13 />Page 4 of 8
(page number not for citation purposes)
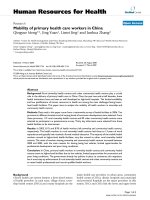
Phylogenetic trees obtained by the neighbour-joining method for the different haplotypes of a) E1E2 region, patients E03, E04, E10, E16, E23 and E25; b) NS5A region, patients N02 and N07Figure 1
Phylogenetic trees obtained by the neighbour-joining method for the different haplotypes of a) E1E2 region, patients E03, E04,
E10, E16, E23 and E25; b) NS5A region, patients N02 and N07. Black dots represent haplotypes obtained with the set of prim-
ers 1; white dots represent haplotypes obtained with the set of primers 2, and grey dots are shared haplotypes obtained with
both sets of primers. The number next to the dot indicates the number of times this haplotype was detected by a particular
primer set. For shared haplotypes two numbers are given, the first one corresponds to primer set 1 and the second to primer
set 2. The scale bar represents number of nucleotide substitutions per site (0.02 and 0.01, respectively).
1
2
1
1
1
2
1/1
1
1
1
2
1
1
1
1
2
1
1
1
1
1
1
1
1
1
1
1
1
1
1
1
1/1
1
1
1
1
1
1
1
1
1
1
1
1
1
1
1
1
1
1
1
1
1
1
1
1
1
1
1
1
1
0 1
1
1
1
1
1
1
1
1
1
1
1
1
2/1
1
1
1
0 1
1
1
2/1
1
2
1
1
1
1
1
1
1
1
18
1
1
1
10
1
6
15/16
4
2
2
1
1
18
1
48/44
1
1
1
1
2
1
1
1
1
1
1
1
1
2
1
2
1
2
1
1
1
1
1
1
1
46
2
1
1
1
1
1
4
1
1
1
1
1
1
2
1
1
2
2
5
1
1
1
1
47
1
1
50
1
1
43
17
2
1
25
2
1
1
0.02
e10
e23
e25
e16
e03
e04
a
1
1
1
1
1
1
1
1
1
1
1
1
4/2
1
1
1
1
1
1
1
1
1
1
1
1
1
1
1
1
1
1
1
1
1
1
1
1
1
1
1
1
1
9
1
1
2
1
1
1
22/8
1
14
1
1
1
1
1
1
1
1
2
1
0.01
n07
n02
b
Virology Journal 2004, 1:13 />Page 5 of 8
(page number not for citation purposes)
additional file 1) with one set of primers recovering at
least twice as many haplotypes as the other set. It is
remarkable that in patients E03 and E04 the most fre-
quently detected (main) haplotype with one set of prim-
ers was genetically distant from the main haplotype found
with the alternative set, as shown by their relative posi-
tions in the phylogenetic tree (Fig. 1a). It is also worth
noticing that in patients E16 and E02 rare haplotypes were
more abundant in PCR products obtained with primer set
2.
Although we have dealt here with cloned sequences, direct
sequencing of PCR products can also be much affected by
PCR selection: both consensus sequences obtained from
PCR amplification of the same cDNA aliquot from patient
E04 with sets of primers 1 and 2 respectively, showed up
to 7 nucleotide differences in 472 nucleotides (data not
shown).
Discussion
PCR drift (i. e. bias in template-to-product ratios pro-
duced by random events occurred in the early cycles of the
reaction) and PCR selection (i. e. differential amplifica-
tion of specific sequences caused by differential annealing
of oligonucleotide primers) are two processes that can
lead to bias in template-to-product ratio of PCR amplifi-
cations [3,22]. In a previous report aimed at studying PCR
repeatability on sampling HCV sequences from four
infected patients [4] we found no evidence of such PCR
drift under our conditions. However a role for PCR selec-
tion could not be ruled out. The main contributing factor
to PCR selection is usually the differential affinity of prim-
ers for template sequences due to differences in the pri-
mary or secondary structure of DNA at target sites [3]. PCR
assays rely on the efficient hybridization of primers to the
target sequence. However, mismatches between the
primer and the target molecules can affect duplex stability
and may compromise the ability of the system to amplify
and detect the target sequences. Numerous factors deter-
mine the final effect of mismatches, including primer
length, nature and position of mismatches, hybridization
temperature, presence of co-solvents (such as DMSO) and
concentrations of both primers and monovalent and diva-
lent cations. For instance, Ishii and Fukui [23] showed
how using complex templates with different annealing
temperatures severely affected the PCR outcome because
of the presence of primer mismatch. Therefore, in samples
with a heterogeneous composition of templates (such as
viral populations in infected patients) the presence of mis-
matches can introduce differences in amplification effi-
ciencies of the different templates hence leading to
template-to-product ratios alterations during PCR. Some
of these factors have been experimentally proven to cause
this alteration.
Attempts to reduce PCR bias caused by primer-template
mismatches usually involve designing degenerate prim-
ers. Here we have studied the effect of small differences in
primer degeneracy on PCR outcome with heterogeneous
templates and their implications and extent on viral
genetic variability at the intrapatient level. Our results
indicate that template-to-product ratios can be signifi-
cantly biased in standard PCR amplifications of non-
homogeneous templates. By means of RT-PCR sampling
of HCV sequences from eight infected patients we have
found that sequence sampling from a single source varied
considerably when two slightly different sets of primers
were used in the PCR amplification: both sets of primers
were chosen after inspection of HCV-1 aligned sequences
from GenBank, and degenerations were introduced in
both sets following only slightly different criteria. The use
of one set of primers or another not only gave rise to dif-
ferent collections of sequences, but also to their different
distribution along phylogenetic trees in most of viral pop-
ulations studied. These results indicate that bias in tem-
plate-to-product ratios can severely distort the results of
analysis of variability in virus populations, both quantita-
tively (i. e. amount of genetic variability) and qualitatively
(i. e. particular sequence clusters on a phylogenetic tree).
Fan et al. [5] demonstrated that partially mismatched
primers used in RT-PCR preferentially amplified different
HVR1 sequences in a HCV virus population, but they
pointed to the specific primer set used for the cDNA syn-
thesis in the RT reaction as the main cause for the
observed bias. To avoid this possible source of error, here
we have used random hexamers to perform reverse tran-
scriptions on viral RNA templates and consequently we
have only focussed on the alterations caused by primers
during PCR. This kind of PCR bias related to primer pref-
erences to anneal to some viral templates has been previ-
ously demonstrated at the level of detection of HCV
infections [24], detection of HCV mixed-genotype infec-
tions [25], differences in genotype assignment [26], or fre-
quent failure to amplify hypervariable regions (references
in [5]). But here we have demonstrated that this bias can
be relevant at the population genetics level to the point
that two independently obtained groups of sequences
from the same patient could be considered as two signifi-
cantly different viral populations. One consequence of
our results is that viral variability estimated by means of
PCR sampling of viral sequences will almost surely be an
underestimation, and should always be considered as a
minimum value. However relative changes in viral varia-
bility through time could probably be reliably assessed.
Underestimates of variability due to PCR selection could
be in agreement with the failure to find correlation
between genetic diversity present in viral populations
before treatment and treatment outcome [10], although
significant changes in relative viral diversity yielded prog-
Virology Journal 2004, 1:13 />Page 6 of 8
(page number not for citation purposes)
nosis information. Another consequence is that, as recov-
ered viral sequences after PCR are those more related to
the sequences used in primer design, an unknown propor-
tion of the original viral population present in the tem-
plate source will not even be detected. This is shown in
our experiment by the presence in the phylogenetic trees
of divergent clusters of sequences from a single patient
only amplified by one of the two sets of primers tested
(see for instance patients E03, E04, E16, N02 and N07) in
figure 1. Since search for particular sequences related to
therapy response is a common issue in antiviral resistance
studies, this observation is of crucial interest as some
sequences of specific or potential interest could remain
unnoticed under particular PCR conditions. For example,
in HCV the evolution of interferon sensitivity-determin-
ing region (ISDR) during IFN therapy is controversial
[27]. It cannot be ruled out that discrepant results related
to the predictive value of particular viral sequences
detected by means of PCR could be partially due to the
sampling bias of amplified sequences as those shown in
the present report.
The results obtained in this study allow us to strongly sug-
gest that, for PCR-based variability studies, a certain level
of primer degeneration, compatible with specific product
amplification, would be more than advisable for variabil-
ity studies in which, as with viral populations, there is no
possibility of designing a perfect set of primer pairs that
equally amplify all possible templates. For this, it is con-
venient to align many available related sequences and
empirically determine which positions are most polymor-
phic and therefore susceptible to participate in
mismatches.
Conclusions
PCR selection (differential amplification of specific
sequences due to differential annealing of oligonucle-
otides) was detected and attributed to differences in
degeneracy at some nucleotide positions in the oligonu-
cleotides involved in amplification. Alterations in the
template-to-product ratio during PCR amplification sig-
nificantly affects viral population descriptions to the
extent that two PCR outcomes from the same infected
patient can result, after genetic population analyses, in
two genetically distinct populations. Two important
implications can be derived: first, all estimates of genetic
variability parameters should be considered always as a
minimum, and second, the search for particular existing
genomes, such as drug resistant genomes, can be totally or
partially eclipsed by others more susceptible to be
annealed by the olinucleotides used in the amplification.
Methods
Viral RNA extraction and amplification
Serum samples from eight patients infected with HCV
were chosen for this study. Six patients infected with HCV-
1b (E03, E04, E10, E16, E23 and E25) were analysed using
two sets of primers that partially amplified the E1E2
region (472 nucleotides) and two patients infected with
HCV-1a (N02 and N07) were analysed using two sets of
primers that partially amplified the NS5A region (743
nucleotides).
The first step in the design of oligonucleotide primers was
to collect a representative variety of HCV-1 sequences
from GenBank. From 50 homologous sequences,
nucleotide positions for primers were chosen with Gene-
Fisher [11], and two sets of homologous primers were
designed for the E1E2 region and the same procedure for
the NS5A region. For each region, both sets of homolo-
gous primers basically differ in their degree of degeneracy
at some polymorphic positions (see table 1).
Viral RNA was extracted from 140 µl of serum using High
Pure Viral RNA Kit (Roche). In order to prevent any bias
during reverse transcription reactions due to oligonucle-
otide specificity, all reverse transcription reactions were
performed using random hexadeoxynucleotides. Reverse
transcriptions (RT) were performed in a 20 µl volume
containing 5 µl of eluted RNA, 4 µl of 5x RT buffer, 0.5
mM of each deoxynucleotide, 0.5 µg of random hexamers,
100 U of MMLV reverse transcriptase (Promega), and 20
U of RNasin Ribonuclease Inhibitor (Promega). Reactions
were incubated at 37°C for 60 min, followed by 2 min at
95°C.
A first PCR round was then carried out in a 100 µl volume
containing 10 µl of the reverse transcription product, 0.2
mM of each dNTP, 400 nM of genomic primer and 400
nM of antigenomic primer and 1.25 units of Pfu DNA
polymerase (Promega). The outer set of primers for the
E1E2 region were 1-Eg1 (or alternatively 2-Eg1) and 1-Ea
(or 2-Ea) (see Table 1). Hemi-nested PCR was carried out
to amplify a 472-bp fragment with nested primer 1-Eg2
(or 2-Eg2) and original primer 1-Ea (or 2-Ea). The outer
set of primers for the NS5A region were 1-Ng1 (or 2-Ng1)
and 1-Na (or 2-Na). Hemi-nested PCR were carried out to
amplify a 743-bp fragment with 1-Ng2 (or 2-Ng2) and 1-
Na (or 2-Na). All reactions were performed in a Perkin
Elmer 2400 thermalcycler according to the following pro-
file: initial denaturation at 94°C for 1 min; 5 cycles at
94°C for 30 s, 55°C 30 s, 72°C 3 min; then 35 cycles at
94°C 30 s, 52°C 30 s, 72°C 3 min, and a final extension
at 72°C for 10 min. A single amplified product was
observed after electrophoresis on 1.4 % agarose gels
stained with ethidium bromide. The same PCR conditions
were strictly applied to every primer set in both regions.
Virology Journal 2004, 1:13 />Page 7 of 8
(page number not for citation purposes)
The 233 newly reported sequences (haplotypes) are
deposited in the EMBL nucleotide sequence database
under accession numbers AF715552-AF715784.
Cloning and sequencing of viral populations
Amplified products from the second round of PCR for the
E1E2 and NS5A regions were purified using High Pure
PCR product Purification Kit (Roche) and directly cloned
into EcoRV-digested pBluescript II SK (+) phagemid
(Stratagene). Recombinant plasmid DNA was purified
using the High Pure Plasmid Isolation Kit (Roche).
Cloned products were sequenced using vector-based
primers KS and SK (Stratagene). Sequencing was carried
out using ABI PRISM BigDye Terminator v3.0 Ready Reac-
tion Cycle Sequencing KIT (Applied Biosystems) on an
ABI 3700 automated sequencer. Sequences were verified
and both strands assembled using the Staden package
[12].
Phylogenetic reconstruction and population genetics
analysis
Sequences were aligned using CLUSTALX v1.81 [13]. The
neighbour-joining algorithm [14] applied on the pairwise
nucleotide divergence matrix using Kimura's two parame-
ter model [15] was used to obtain phylogenetic trees using
the MEGA program [16].
Polymorphism and genetic differentiation were analysed
using DNAsp version 4.0 [17]. Estimated polymorphism
parameters included: number of polymorphic sites (S);
haplotype diversity (H
T
) considering as haplotype each
different sequence; nucleotide diversity (
π
) [18]; and aver-
age number of pairwise differences between sequences
(k). Genetic differentiation between groups of sequences
was estimated as the average number of nucleotide substi-
tutions between groups (d
xy
). The statistical significance of
genetic differentiation between groups, as estimated by
, was established by the permutation test [19]. The pro-
portion of nucleotide diversity attributable to variation
between populations, the fixation index F
st
, was calculated
using the ARLEQUIN program ver. 2.000 [20].
Competing interests
The authors declare that they have no competing interests.
Authors' contributions
MAB and IG-R co-conceived, designed and coordinated
the study, participated in the molecular studies and
sequence alignment, interpreted data, oversaw the train-
ing of technicians, and co-drafted the manuscript; MAB
isolated viral genomes, co-performed population and
phylogenetic analyses; NJ and MT-P participated in
molecular studies and sequence alignment, interpreted
the data and helped draft the manuscript; AM interpreted
data and participated in proofreading of the manuscript;
FG-C coordinated the study, interpreted data, co-per-
formed population and phylogenetic analyses and partic-
ipated in proofreading of the manuscript. All authors read
and approved the final manuscript.
Additional material
Acknowledgements
This work was supported by the Conselleria de Sanitat, Generalitat Valen-
ciana, and by the Spanish Ministerio de Educación, Cultura y Deporte, Plan
Nacional I+D (project 1FD97-2328) and the Ministerio de Ciencia y Tec-
nología (BMC2001-3096).
References
1. von Wintzingerode F, Gobel UB, Stackebrandt E: Determination of
microbial diversity in environmental samples: pitfalls of
PCR-based rRNA analysis. FEMS Microbiology Reviews 1997,
21:213-329.
2. Ruddle FH, Bartels JL, Bentley KL, Kappen C, Murtha MT, Pendleton
JW: Evolution of Hox genes. Annual Review of Genetics 1994,
28:423-442.
3. Wagner A, Blackstone N, Cartwright P, Dick M, Misof B, Snow P,
Wagner GP, Bartels J, Murtha M, Pendleton J: Surveys of gene fam-
ilies using polymerase chain reaction: PCR selection and
PCR drift. Systematic Biology 1994, 43:250-261.
4. Torres-Puente M, Bracho MA, Jiménez N, García-Robles I, Moya A,
González-Candelas F: Sampling and repeatability in the evalua-
tion of hepatitis C virus genetic variability. Journal of General
Virology 2003, 84:2343-2350.
5. Fan X, Lyra AC, Tan D, Xu Y, Di Bisceglie AM: Differential ampli-
fication of hypervariable region 1 of hepatitis C virus by par-
tially mismatched primers. Biochemical Biophysical Research
Communications 2001, 284:694-697.
6. Alter HJ, Seeff LB: Recovery, persistence, and sequelae in hep-
atitis C virus infection: a perspective on long-term outcome.
Seminars in Liver Disease 2000, 20:17-35.
7. Simmonds P, Smith DB, McOmish F, Yap PL, Kolberg J, Urdea MS,
Holmes EC: Identification of genotypes of hepatitis C virus by
sequence comparisons in the core, E1 and NS-5 regions. Jour-
nal of General Virology 1994, 75:1053-1061.
8. Farci P, Purcell RH: Clinical significance of hepatitis C virus gen-
otypes and quasispecies. Seminars in Liver Disease 2000,
20:103-126.
9. Farci P, Shimoda A, Coiana A, Diaz G, Peddis G, Melpolder JC,
Strazzera A, Chien DY, Munoz SJ, Balestrieri A, Purcell RH, Alter HJ:
The outcome of acute hepatitis C predicted by the evolution
of the viral quasispecies. Science 2000, 288:339-344.
10. Farci P, Strazzera R, Alter HJ, Farci S, Degioannis D, Coiana A, Peddis
G, Usai F, Serra G, Chessa L, Diaz G, Balestrieri A, Purcell RH: Early
changes in hepatitis C viral quasispecies during interferon
therapy predict the therapeutic outcome. Proceedings of the
National Academy of Sciences of the United States of America 2002,
99:3081-3086.
11. Giegerich R, Meyer F, Schleiermacher C: GeneFisher – software
support for the detection of postulated genes. Proc Int Conf
Intelli Syst Mol Biol 1996, 4:68-77.
k
s
*
Additional File 1
Summary of genetic variability and population differentiation of within
patient HCV populations based on viral sequences obtained with two
alternative primer set. E1E2 region was analysed in patients E03, E04,
E10, E16, E23 and E25, and NS5A region in patients N25 and E02
Click here for file
[ />422X-1-13-S1.doc]
Publish with BioMed Central and every
scientist can read your work free of charge
"BioMed Central will be the most significant development for
disseminating the results of biomedical research in our lifetime."
Sir Paul Nurse, Cancer Research UK
Your research papers will be:
available free of charge to the entire biomedical community
peer reviewed and published immediately upon acceptance
cited in PubMed and archived on PubMed Central
yours — you keep the copyright
Submit your manuscript here:
/>BioMedcentral
Virology Journal 2004, 1:13 />Page 8 of 8
(page number not for citation purposes)
12. Staden R, Beal KF, Bonfield JK: The Staden Package, 1998. Meth-
ods Mol Biol 2000, 132:115-130.
13. Thompson JD, Gibson TJ, Plewniak F, Jeanmougin F, Higgins DG: The
ClustalX windows interface: flexible strategies for multiple
sequence alignment aided by quality analysis tools. Nucleic
Acids Research 1997, 24:4876-4882.
14. Saitou N, Nei M: The Neighbor-Joining method: a new method
for reconstructing phylogenetic trees. Molecular Biology and
Evolution 1987, 4:406-425.
15. Kimura M: A simple method for estimating evolutionary rates
of base substitutions through comparative studies of nucle-
otide sequences. Journal of Molecular Evolution 1980, 16:111-120.
16. Kumar S, Tamura K, Jakobsen IB, Nei M: MEGA2: molecular evo-
lutionary genetics analysis software. Bioinformatics 2001,
17:1244-1245.
17. Rozas J, Sánchez-Delbarrio JC, Messeguer X, Rozas R: DnaSP, DNA
polymorphism analyses by the coalescent and other
methods. Bioinformatics 2003, 19:2496-2497.
18. Nei M: Molecular Evolutionay Genetics Columbia University Press New
York; 1987.
19. Hudson RR, Boos DD, Kaplan NL: A statistical test for detecting
geographic subdivision. Molecular Biology and Evolution 1992,
9:138-151.
20. Schneider S, Roessli D, Excoffier L: Arlequin ver. 2000: A software for
population genetics data analysis Genetics and Biometry Laboratory,
University of Geneva Switzerland; 2000.
21. Innan H, Tajima F: A statistical test for the difference in the
amounts of DNA variation between two populations. Geneti-
cal Research 2002, 80:15-25.
22. Polz MF, Cavanaugh CM: Bias in template-to-product ratios in
multitemplate PCR. Applied and Environmental Microbiology 1998,
64:3724-3730.
23. Ishii K, Fukui M: Optimization of annealing temperature to
reduce bias caused by a primer mismatch in multitemplate
PCR. Applied and Environmental Microbiology 2001, 67:3753-3755.
24. Bukh J, Purcell RH, Miller RH: Importance of primer selection
for the detection of hepatitis C virus RNA with the polymer-
ase chain reaction assay. Proceedings of the National Academy of Sci-
ences of the United States of America 1992, 89:187-191.
25. Hu Y-W, Balaskas E, Furione M, Yen P-H, Kessler G, Scalia V, Chui L,
Sher G: Comparison and application of a novel genotyping
method, semiautomated primer-specific and mispair exten-
sion analysis, and four other genotyping assays for detection
of hepatitis C virus mixed-genotype infections. Journal of Clinical
Microbiology 2000, 38:2807-2813.
26. Forns X, Maluenda MD, Lopez-Labrador FX, Ampurdanes S, Olmedo
E, Costa J, Simmonds P, Sanchez-Tapias JM, Jimenez De Anta MT,
Rodes J: Comparative study of three methods for genotyping
hepatitis C virus strains in samples from Spanish patients.
Journal of Clinical Microbiology 1996, 34:2516-2521.
27. He Y, Katze MG: To interfere and to anti-interfere: the inter-
play between hepatitis C virus and interferon. Viral Immunology
2002, 15:95-119.