Nanotechnology and the Environment - Chapter 5 potx
Bạn đang xem bản rút gọn của tài liệu. Xem và tải ngay bản đầy đủ của tài liệu tại đây (897.39 KB, 24 trang )
© 2009 by Taylor & Francis Group, LLC
99
5
Analyses of
Nanoparticles in
the Environment
Marilyn Hoyt
AMEC Earth & Environmental
CONTENTS
5.1 Ana lytical Method s 101
5.1.1 Nanopa rt icle Imag ing: Size, Shape, and Chemica l Composition 101
5.1.1.1 Electron Microscopy 101
5.1.1.2 Sca nn ing Probe Microscopy (SPM) 106
5.1.2 Compositional Analysis 108
5.1.2.1 Single Particle Mass Spectrometer 108
5.1.2.2 Particle-Induced X-Ray Emission (PIXE) 109
5.1.3 Surface Area: Product Characterization and Air Monitoring 109
5.1.3.1 The Br unauer Em mett Teller (BET) Method 109
5.1.3.2 Epiphaniometer 109
5.1.3.3 Aerosol Diffusion Charger 110
5.1.4 Size Distribution 110
5.1.4.1 Electrostatic Classiers 110
5.1.4.2 Real-Time Inertial Impactor: Cascade Impactors 110
5.1.4.3 Electrical Low Pressure Impactor (ELPI) 111
5.1.4.4 Dyna mic Light Scatter ing (DLS) 111
5.2 Workplace Ai r Monitori ng 112
5.2.1 Condensation Particle Counter (CPC) 113
5.2. 2 Sur face Area: Tota l Exposu re 113
5.3 Sampling and Analysis of Waters and Soils for Nanoparticles 114
5.4 Nanotechnology Measurement Research and Future Directions 115
5.4.1 United States 115
5.4.1.1 N IOSH 115
5.4.1.2 U.S. Government-Sponsored Research 117
5.4.1.3 National Institute of Standards and Technology (NIST) 117
5.4.2 European Union 118
5.4.3 Asia-Pacic 118
5.5 Sum ma ry 119
References 119
© 2009 by Taylor & Francis Group, LLC
100 Nanotechnology and the Environment
The rapid explosion of production and use of engineered nanoparticles has outpaced
the scientic community’s ability to monitor their presence in the environment.
Withoutmeasurementdata,itisnotpossibletofullyevaluatewhetherthepromises
of nanoparticles are accompanied by signicant ecological or human health risks.
Numerous national and international agencies and research groups have recognized
thisgapandputinplaceresearchprogramstoaddressit.However,thetechnical
requirements for the detection and characterization of nanoparticles in complex
environmental systems push the limits of current sampling techniques and instru
-
m
e
ntation. In most cases, multiple complementary measurements are likely neces-
s
a
rytodetectandunderstandtheimportanceofnanoparticlesinair,water,orsoil
because physical properties as well as chemical composition determine activity and
environmental impact or risk. Environmental analyses of nanoparticles are not com
-
m
o
n offerings at commercial environmental laboratories at this time, and they are
notlikelytobecomesointhenearfuture.
In the manufacturing industry, the development and production of nanoparti
-
c
l
e materials for commercial applications are supported by an array of analytical
methods. While numerous methods can successfully characterize the chemistry and
physical properties of nanoparticles in relatively pure states and under dened condi
-
t
i
ons, the applicability of these methods to nanoparticles in environmental settings
maybemorelimited.Oncenanoparticlesentertheenvironment,theymayclusterto
formlargerparticles,interactwithparticlesfromnaturalsources,orchangechemi
-
ca
l
ly. Conventional environmental analysis methods as developed and standardized
by the U.S. Environmental Protection Agency (EPA) are bulk analyses; they can
detect the primary chemical constituents of nanoparticle materials but little else
ofuseforcharacterizingriskfromthem.Inaddition,thetargetnanoparticlesmay
only be a minor component of an environmental sample and fall below the detec
-
t
i
on limits of standard EPA chemical analysis methods. Collection and separation of
nanoparticles from larger environmental particles, when even possible, are difcult,
and their analysis is in most cases time-consuming and costly. No standard methods
with prescribed quality control requirements for environmental nanoparticle analy
-
ses exist, and only limited traceable standards have been developed.
Asidefromthetechnicalchallengestonanoparticlemeasurementinenviron
-
mental media, the lack of specic regulations limits the incentive for commercial
environmental laboratories to put in place the costly instrumentation and the high
degree of expertise that will be required to offer nanoparticle analyses to government,
privateindustry,orpublicgroups.Whilethereissomeconcernforpossibleenvi
-
ronmental risks from nanoparticles, manufacturers, users, and site owners currently
are not required to address these concerns with actual environmental measurement
data. A
sa
result,mosttechnicaladvancesanddatathatdoexistforenvironmen-
tal analyses have come from academic laboratories and governmental or privately
funded research laboratories. The applicability of regulatory statutes as discussed in
Chapter 4 of this book continues to be debated. The Toxic Substances Control Act
(TSCA),theCleanWaterandCleanAirActs(CWA,CAA),theResourceConserva
-
tion and Recovery Act (RCRA), and the Federal Insecticide, Fungicide, and Roden-
t
i
cide Act (FIFRA) drove method development for numerous industrial chemicals
in the environment. Regulatory requirements applicable to nanomaterials likewise
© 2009 by Taylor & Francis Group, LLC
Analyses of Nanoparticles in the Environment 101
wouldbeexpectedtodrivethedevelopmentandstandardizationofenvironmental
nanoparticle analytical methods for wider application, as well as to foster competi-
tion in an emerging market for laboratory services. Instrumentation and stafng
costswill,however,remainabarriertoentryintotheeldformostcommercial
laboratories currently offering environmental services.
5.1 ANALYTICAL METHODS
Theproductionofnanoparticlematerialstypicallyrequirescontrolofthechemical
composition, size, shape, and surface characteristics of the material. Many of the
analytical techniques applied for the analysis of nanoparticles during development
and production also are critical to laboratory studies of fate and transport and expo-
sure effects to ensure that the material being tested is fully understood. These meth-
ods also may be components of analyses to detect nanoparticles after their release
into the environment, dispersion in air or water, or uptake into organisms [1].
Thischapterdiscusseshighlightsofthemostwidelyusedtechniques,provid-
in
g the basic science of the analyses and describing the type of information that
canbeexpectedandreportedforpossibleenvironmentalapplications.Thesetech-
niques, as listed in Table 5.1, represent what must be considered initial approaches of
researchers to address environmental issues; it is likely that over time, other current
techniques or newly developed instrumentation will also prove useful. Representa-
ti
ve citations are provided where methods have proven successful for analyses of
nanoparticles present in air, water, or soils. However, it should be noted that most
environmental analyses reported to date for nanoparticles have focused on natural
species such as colloids in water or on combustion-related emissions. Engineered
nanoparticleshavebeencharacterizedinlaboratorystudiesandinindoorairmoni-
to
ring programs, but only limited studies designed to detect their releases into or fate
inambientair,surfaceorgroundwaters,orsoilsorwastehavebeenreported[2].
Morein-depthdiscussionsofthetheoreticalbasisforeachmeasurementtech-
ni
que, specics for instrument design, detection options, and data examples can be
foundinareviewarticle[3]thatdiscussesmorethan30measurementtechniques
in detail, presenting the theory and advantages and limitations to each. Labora-
to
ry analyses, real-time methods, and portable instrumentation for particulate
characterization from mobile source emissions are reviewed in a literature survey
fortheCaliforniaAirResearchBoard(ARB)[4].Manyofthemethodsdiscussed
and equipment illustrated are also potentially applicable to measurement of nanopar-
ti
cles from other sources in the environment. A recent U.S. EPA symposium on
nanoparticlesintheenvironmentdiscussedthechallengesinvolved,andalsopre-
sented highlights of applicable measurement methods [5].
5.1.1 NANOPARTICLE IMAGING: SIZE, SHAPE, AND CHEMICAL COMPOSITION
5.1.1.1 Electron Microscopy
Electron microscopy is comparable to light microscopy, except that a beam of elec-
tronsratherthanlightisusedtoformimages.Electronbeamshaveamuchshorter
wavelength than light and, as a result, they can provide the resolution required to
102 Nanotechnology and the Environment
TABLE 5.1
Methods for Environmental Analyses of Nanoparticles
Technique Parameters Measured Resolution/Sensitivity Limitations/Advantages Environmental Applications
Nanoparticle Imaging
Electron microscopy (SEM,
TEM, ESEM)
Particle size, shape, texture,
crystalline vs. amorphous
structure, elemental
composition, bonding
1 nm SEM, <0.1 nm TEM Particle-by-particle analysis, time-
consuming. Sample preparation,
high vacuum for SEM, TEM may
alter particles. ESEM allows
imaging in water or other liquid
media
Ambient air studies [11],
nanoparticle characterization
for laboratory studies of fate,
toxicity [7–10]
Scanning probe microscopy
(STM, AFM)
Particle size, morphology 0.5 nm Particle-by-particle analysis.
Analysis at ambient pressure,
particles may be in solution
Ambient air studies, natural
colloids [15–17, 20, 21]
Compositional Analysis
Single-particle mass
spectrometry
Chemical composition, organic
and inorganic species
3 nm particle Continuous analysis of particles in
air stream
Atmospheric studies, vehicular
emissions [23, 24]
Particle-induced x-ray (PIXE) Elemental mapping of
nanolms or collected
nanoparticles
1 micron Requires radioactive source. Air pollution studies [28]
Surface Area
BET Average surface area on a mass
basis
2000 m
2
/g Laboratory-based instrument;
requires relatively pure bulk sample
of chemically homogenous
material.
Characterization for laboratory
studies of fate, toxicity [29]
Epiphaniometer Active surface area 10–20 nm particles, 0.003
m
2
/cm
3
Requires radioactive lead source Ambient air studies [30]
Aerosol diffusion charger Aerosol surface area 10 to 100 nm in diameter Fast response Ambient air [31]
© 2009 by Taylor & Francis Group, LLC
Analyses of Nanoparticles in the Environment 103
Size Distribution
Electrostatic classier (DMA,
NDMA, DMPS, SMPS)
Particle distribution based on
assumed spherical shape
5 nm Monitors on real-time basis; size
will not necessarily be same as
from imaging technique
Releases during nanopowder
use [33]
Cascade impactor, MOUDI Particle distribution based on
aerodynamic diameter
<30 nm diameter <10 nm
(MOUDI)
Time-integrated average
distributions; particles collected
may be analyzed subsequently by
microscopy
Ambient air studies, vehicle
emissions [35]
Electrical impactor (ELPI) Particle distribution based on
aerodynamic diameter
7 nm, >90 nanoparticles/
cm
3
air; 5 ng/m3
Real-time particle counts Indoor air, ambient air studies,
vehicular emissions [36, 37]
Light scattering (DLS, PLS,
QELS)
Particle size based on
hydrodynamic diameter
0.7 nm In situ measurements possible Characterization of
nanomaterials prior to
laboratory studies [38–40]
Particle Concentration/Surface Area in Air
Condensation particle counter Particle concentration in air
stream
3 nm No information on particle size,
shape composition. Hand-held units
available, real-time data.
Indoor air monitoring, worker
exposure studies [43]
Electrical aerosol detector Aerosol diameter concentration,
calculated from a number
concentration multiplied by
average diameter
10 nm Real-time data generation, eld-
portable instrumentation
Ambient air studies [45]
Particles in Aqueous Samples
Field-Flow Fractionation Particle separation by size 1 nm diameter; 1–5000
ng/L for elemental
composition
Must be combined with subsequent
analysis to assess size, (e.g., DLS).
Can combine with ICPMS, ESEM.
Natural colloids, iron oxide/
hydroxide colloids [49, 50]
© 2009 by Taylor & Francis Group, LLC
© 2009 by Taylor & Francis Group, LLC
104 Nanotechnology and the Environment
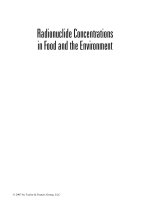
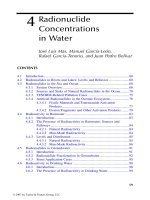
formclearimagesofnanomaterials.Therearetwomajortypesofelectronmicros-
copy: (1) transmission electron microscopy (TEM) and (2) scanning electron micros-
co
py(SEM).Asabeamofelectronshitsthesurfaceofaparticleorlm,electrons
canbedeectedoffthesurfaceor,incollisionswithatomsofthematerial,release
light,knockoffsecondaryelectronsfromatomsinthematerial,orcausetheemis
-
si
onofx-rays.Someelectronsalsopassthroughthematerial,eitherdirectlyorwith
somescatteringduetocollisionswiththeparticleatoms(Figure5.1).
WithSEM,emissionsfromthetopofasurfaceimpactedbytheelectronbeam
aredetectedandmeasured.Avarietyofinstrumentscanbeusedtodetecttheback-
scatteredelectrons,secondaryelectrons,x-rays,orlightgeneratedabovethesurface.
Each detector adds its own acronym to the analysis technique (e.g., EDS [energy
dispersivex-rayspectroscopy],EDX[energydispersivex-ray],andXEDS[x-ray
energy dispersive spectroscopy] all refer to x-ray detection techniques that provide
structural or chemical composition information when paired with SEM). Auger elec
-
tronmicroscopyorspectroscopy(AEMorAES),whichmeasurestheenergyof
FIGURE 5.1 Electronmicroscopy.(FromJ.Manseld,UniversityofMichigan.With
permission.)
© 2009 by Taylor & Francis Group, LLC
Analyses of Nanoparticles in the Environment 105
ejectedelectrons,alsoisusefulforelementalcompositioninformation.Pairedwith
these different detectors, SEM can provide information on the size and shape of a
particle, three-dimensional topographic information on surface features and texture,
crystallineoramorphousstructure,andelementalcomposition.Thetechniqueis
most useful for measurements of particles in the range of 50 nanometers (nm) or
higher,althoughstrongerelectronsourcescanachievespatialresolutionof1nm.
More advanced detectors are available now that can charactize the difference in
chemistrybetweenthetop2nmofaparticleanditsinterior.
With TEM, the measurements are taken underneath the material. The portion of
theelectronbeamthatpassesthroughtheparticlecanbeprojectedontoauorescent
screen to form a two-dimensional image of the particle. Resolution of less than 0.1
nm can be achieved, making it a primary tool for characterization of the smallest
nanoparticles. As with SEM, a variety of detectors can be used to detect scattered
electrons and x-rays released by the interactions of the electron beam with the atoms
of the particles. TEM analyses can be designed to determine the elemental composi
-
ti
on of the particle and the chemical bonding environment, particle shape and size,
anditscrystallineoramorphousstructure.TEMalsocanbeconductedinascanning
mode(STEM),wherethenarrowlyfocusedelectronbeamscansovertheparticlefor
maximumsensitivityandresolution.AmoredetailedintroductiontoTEMisavail
-
able on the Internet [6].
Researchers frequently use SEM and TEM to characterize nanoparticles before
their use in laboratory experiments and to monitor progress or results. TEM has been
used to characterize TiO
2
andfullereneforinhalationandaquatictoxicitystudies[7,
8]. Rothen-Rutishauser et al. [9] used TEM techniques to visualize TiO
2
and gold
nanoparticles absorbed into red blood cells; and Sipzner et al. [10] monitored the
dermal absorption of TiO
2
nanoparticles using TEM.
Reported environmental applications include the use of SEM and TEM to charac-
t
e
rizeneandultraneparticulatespresentinambientair.Inanurbanairstudy[11],
Utsunomiya et al. conducted analyses using several TEM techniques to characterize
theparticulatesizeassociatedwithheavymetalsandtospeciatethemetalsdetected.
Metals of particular interest for engineered nanomaterials — titanium, iron, and
silver — were all detected in nanoparticles. Titanium and iron were present at com
-
p
a
rativelyhighconcentrationsandwereattributabletofractalrockandnumerous
natural and anthropogenic sources, highlighting the difculty of determining poten
-
tial air sources from the manufacture or use of zero-valent iron or titanium dioxide
nanoparticles against naturally high backgrounds. Silver was present at low levels,
primarilyassociatedwithsootparticles,andtentativelyattributedtobackground
combustion sources.
SEM and TEM provide invaluable information for many purposes. They do,
however, have several limitations for environmental applications. Although SEM
hasalargereldofviewthanTEM,bothSEMandTEMcananalyzeonlyarela
-
t
i
vely small number of particles at a time. Representativeness for a nonhomogeneous
sample is difcult to achieve. The instrumentation is costly and requires a high level
oftechnicalexpertisetooperateproperly.Thesamplepreparationandanalysisare
time-consuming. The particles must be deposited on a support lm, and the differ
-
ent ways of achieving this deposition may allow some nanoparticles to aggregate
© 2009 by Taylor & Francis Group, LLC
106 Nanotechnology and the Environment
or to fragment, losing some of the characteristics responsible for their activity. For
TEM, nonconductive materials must be coated with a conducting material such as
graphite, potentially obscuring critical features. On most available instruments, the
sample must be at high vacuum during analysis, and results for nanoparticles with
volatile components, such as hydrated salts or oxides, may not be representative for
thematerialasitexistsoutsidethevacuum.
Environmental SEM (ESEM) instruments have been developed recently that
utilize differential pressure zones. These do allow analyses with the sample at pres
-
suresclosertoatmospheric,andESEMinstrumentationalsocanbemodiedto
allow imaging of nanoparticles while in suspension in water or other liquid media.
Condensation, evaporation, and transport of water inside carbon nanotubes have
been monitored
in situ with E
SEM[11].Bogneretal.[12]reporttheanalysesofgold
and silica nanoparticles and carbon nanotubes dispersed in water using this tech-
ni
que, which they have named “wet scanning transmission electron microscopy,”
(wet STEM).
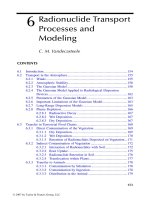
5.1.1.2 Scanning Probe Microscopy (SPM)
Scanningprobemicroscopy(SPM),arelativelynewertool,providesatruethree-
dimensionalsurfaceimage.SPMincludesavarietyofdifferenttechniques,includ
-
ingatomicforcemicroscopy(AFM)andscanningtunnelingmicroscopy(STM),
whichhaveprovenusefulforimagingandmeasuringmaterialsatthenanoscale.
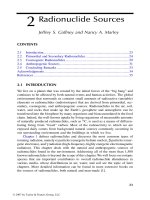
SPMtechniquesarebasedonamechanicalsurveyofthesurfaceofanobjectorpar
-
ti
cle.Averynetipmountedonacantileverscansoverthesurfaceofinterest,fol-
lo
wingthesurfaceprole.Interactionsbetweenthetipandthesurfacedeectthetip
asitfollowsthesurfaceprole.Themovementofthetipinresponsetotheinterac
-
ti
oncanbemonitoredwithalaserreectedfromthecantilevertoaphotodiodearray
(Figure5.2).STMmonitorstheweakelectricalcurrentinducedasthetipishelda
setdistancefromthesurface.STM,undersomeconditions,canprovidechemical
composition information for the surface. With AFM, the tip responds to mechanical
contactforcesaswellasatom-levelinteractionsbetweenthetipandsurface(suchas
chemical bonding forces, van der Waals forces, or electrostatic forces).
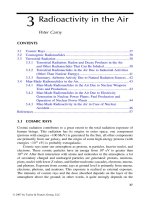
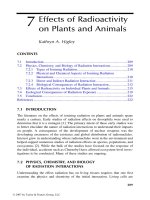
Since their development in the late 1980s, both techniques have found wide
application for nanotechnology materials development, as illustrated by the
characterization of fullerene particles in Figure 5.3. AFM also holds promise for
environmentalapplications.AFMcanbeoperatedatambientpressureandcanchar
-
act
erizeawiderangeofparticlesizesinthesamescan,from1nmto8μm(microm-
et
er). It can analyze particles on a solid substrate at atmospheric pressure or in a
liquid medium such as water. It has been used to characterize the morphology and
size distribution of nanometer-sized environmental aerosol particles collected from
ambientair,aswellasforengineeredTiO
2
nanoparticles [14]. The size distribu-
tion and morphology of natural aquatic colloids, which play important roles in con-
ta
minant binding, transport, and bioavailability, also have been characterized with
AFM after their absorption onto a mica substrate [15–17]. A detailed discussion of
AFMisprovidedinthereviewarticlebyBurlesonetal.[3];furtherinformationon
© 2009 by Taylor & Francis Group, LLC
Analyses of Nanoparticles in the Environment 107
FIGURE 5.2 Atomicforcemicroscopy.(FromA.Nadarajah.Withpermission.)
FIGURE 5.3 STMimagesofbuckyballs.(FromNanoscienceInstruments.Withpermission.)
© 2009 by Taylor & Francis Group, LLC
108 Nanotechnology and the Environment
applications of and images from AFM for nanotechnology are available on instru-
ment manufacturers’ websites [18, 19].
5.1.2 COMPOSITIONAL ANALYSIS
5.1.2.1 Single Particle Mass Spectrometer
MassspectrometryformsthebasisofseveralU.S.EPAmethodsforenvironmental
sampleanalysisonabulkbasis,providingchemicalcompositiondataonanele-
mental level for metals, and on a molecular level for organics. Mass spectrometry
also applies to the analysis of single particles on a real-time basis, although the
instrumentation has major differences from mass spectrometers used in U.S. EPA
method analyses. The single particle mass spectrometer, rst developed in the 1970s
for atmospheric aerosol research, analyzes particles from a continuous air stream
drawndirectlyintotheionsource.Bothorganicandinorganicconstituentscanbe
detected and identied. The instrument has been widely used for air monitoring
studies of particles with aerodynamic diameters in the low micron range [20, 21], but
thetechnologyhasbeenextendednowtothenanoparticlerange.
Most current single particle mass spectrometers are time-of-ight instruments,
withsomethatcandetectandanalyzeparticlesdownto3nmindiameter[22].As
asolidparticulateordropletsuspendedintheairstreamentersthesourceregionof
themassspectrometer,apulsedlaserbeamdesorbsandionizestheparticlecompo-
nents; immediately afterward, a pulsed electric eld accelerates all ions of the same
chargetothesameenergy,afterwhich,dependingontheirmassandcharge,they
“y”atdifferentvelocitiestoachargeddetector.Bothpositiveandnegativeions
can be detected in some time-of-ight instruments. These instruments can be eld-
deployedandhavebeenusedinupperatmosphericstudies[23]andforon-siteambi-
entairmonitoring[24].Ofthenanomaterialsspecicallydiscussedinthisbook,
fullereneistheonlyoneforwhichdetectionbysingleparticlemassspectrometry
hasbeenreported[25].
A recent modication to the technology adds particle size measurement prior
to the introduction of the particle into the mass spectrometer source. These instru-
ments, called aerosol time-of-ight mass spectrometers (ATOFMS) [26], employ
two distinct time-of-ight technologies. One determines particle size; the other
determines particle chemical composition. As a particle enters the instrument, a
supersonicexpansionofthecarriergasacceleratestheparticletoterminalveloc-
ity.Becausesmallerparticlesreachahighervelocitythanthelargerparticles,the
aerodynamicdiametercanbecalculatedfromthetimeittakestheparticletotravel
betweentwolasers.Astheparticlepassesthesecondlaserandentersthemass
spectrometer source, the high-intensity laser of the source is triggered to hit the
particle and desorb and ionize particle constituents. These instruments have been
usedfornanoparticleemissionstudiesfromvehicleemissions[27]aswellasfor
atmospheric studies [23].
© 2009 by Taylor & Francis Group, LLC
Analyses of Nanoparticles in the Environment 109
5.1.2.2 Particle-Induced X-Ray Emission (PIXE)
PIXEmeasurementscanprovidemajor,minor,andtraceconstituentanalysesof
nanoparticles.Theinstrumentdirectsabeamofprotonsfromahigh-energyparticle
acceleratorthatwillknockoutcoreelectronsfromtheatomsofthesample.X-rays
arethenemittedwhenoutershellelectronsdropintotheorbitalfromwhichthepro-
ton-ejected electron came. The resulting x-ray spectrum of the sample can be used
for elemental identications. The requirement for a particle accelerator to generate
the proton beam makes PIXE techniques very costly and available in only a lim-
ited number of research laboratories. The technique has been used for trace element
analysisofbackgroundaerosolparticlesintheheavilypollutedairofMexicoCity
[28], but it is likely to remain a research tool with limited use.
5.1.3 SURFACE AREA: PRODUCT CHARACTERIZATION AND AIR MONITORING
Surface area is a critical parameter inuencing the properties and activity of nanopar-
ticles.Inlargepart,thisisbelievedduetothecomparativelyhighnumberofatomson
the surface of the particle as opposed to larger particles where most atoms are interior.
Surface areas for individual particles can be estimated from the imaging techniques
discussedabove,buttechniquesfordeterminingtheaveragesurfaceareaforabulk
sample of nanoparticles are more commonly used to monitor production of nano-
materials for specic uses. Some of these methods also are applicable for materials
characterization before laboratory exposure studies, and for environmental samples.
5.1.3.1 The Brunauer Emmett Teller (BET) Method
The BET method is named for the three scientists who recognized that particulate
surfaceareacanbedeterminedbasedonthevolumeofgasthatwilladsorbtothe
surfaceofagivenmassofsample.TheBETequationrelatesthevolumeofgas
adsorbed to form a monolayer, the size of the gas molecules, and the mass of the
material to derive surface area per unit mass. Commercial analyzers are available
that perform this measurement, which may be used during development and produc-
ti
on. In a representative research application, BET measurements were relied upon
forsizecharacterizationofnitrogen-dopedtitaniumdioxidepreparedasaphotocat-
alyst for Escherichia coli disinfection [29]. Because BET requires a relatively pure
bulksampleofachemicallyhomogeneousmaterial,ithasnotfoundapplicationfor
environmental analyses.
5.1.3.2 Epiphaniometer
Theepiphaniometerisarelativelysimpledevicethatmeasurestheactivesurfacearea
of aerosol particles. Particles entering the instrument are charged with radioactive
lead ions and then collected on a collection lter. The measured total radioactivity
isameasureoftheattachmentrate,whichthenallowscalculationofthetotalactive
surface area of particles in the sample. The requirement for a radioactive source lim-
it
sthewideuseofthisinstrument,butithasbeenusedinresearchprogramssuchas
mobilelaboratorystudiesofon-roadairqualityasrelatedtotrafcemissions[30].
© 2009 by Taylor & Francis Group, LLC
110 Nanotechnology and the Environment
5.1.3.3 Aerosol Diffusion Charger
Thesamemeasurementprincipleasusedfortheepiphaniometerisappliedinaero-
soldiffusionchargersbutwithouttherequirementforaradioactivesource.Ionsare
producedinacarriergasbyelectricaldischarge.Theionsattachtothesurfaceof
theparticles,whicharethencollectedinanelectricallyinsulatedparticlelter.The
electricchargeisconvertedtoadirectcurrent(DC)voltagesignalinanelectrometer
amplier. Studies have shown that these devices provide a good estimate of aero-
so
lsurfaceareainambientairwhenairborneparticlesaresmallerthan100nmin
diameter [31].
5.1.4 SIZE DISTRIBUTION
Individual particle sizes can be measured accurately with TEM, STEM, and AFM,
but those techniques are not time or cost efcient when a complete size distribution
is required. Size distribution analyses generally are conducted with aerosols formed
whentheparticlesaresuspendedinair,orwhenparticlesareinemulsionsorsuspen-
si
onsinaliquidmatrix.
5.1.4.1 Electrostatic Classifiers
Electrostatic classiers operate on the basic principle that the velocity of a charged
spherical particle in an electrical eld relates directly to its diameter. Particles are
suspendedinairtoformanaerosol,charged,andthenintroducedintoacylindri-
cal
apparatus.Theclassierhasanoutercylinderthatisagroundelectrodeandan
inner rod that can have precisely controlled negative voltage applied. The charged
particlesareintroducednearthewalloftheoutercylinder,withasheathofcleanair
movingthroughthecylinderataconstantowrate.Thepositivelychargedparticles
willmovetowardthenegativelychargedcenterelectrodeataratedeterminedby
theiroperativediameterandtheappliedvoltage.Onlythoseparticleswithinanar-
ro
wvelocityrangewillpassthroughathinsamplingslitnearthebottomofthecen-
terelectrode.Particlesexitthroughthisslitintoaparticle-countinginstrument.By
scanningthevoltageonthecentralrod,analystscanobtainafullparticle-sizedis-
tr
ibutionfortheaerosol.Itshouldbenoted,however,thattheparticlesizemeasured
isbasedontheassumptionofasphericalshape,andthedimensionsofnonspherical
particlesdeterminedbythistechniquewillcorrelatewithbutnotnecessarilyequal
thosedeterminedbyanimagingtechnique.
Varioustypesof(andnamesfor)electrostaticclassiersareincommonuse.
These include the differential mobility analyzer (DMA), nanodifferential mobility
analyzer (NDMA), the differential mobility particle sizer (DMPS), and the scanning
mobilityparticlesizer(SMPS).Electrostaticclassierscanbeusedinavarietyof
ways, including real-time monitoring of the length of carbon nanotubes during syn-
the
sis[32]ortomonitoremissionsduringuseofTiO
2
nanopowder materials [33].
5.1.4.2 Real-Time Inertial Impactor: Cascade Impactors
Cascade impactors have a long history with ambient air monitoring programs, pro-
vi
ding size selectivity to the collection of suspended particles. These units take
© 2009 by Taylor & Francis Group, LLC
Analyses of Nanoparticles in the Environment 111
advantageofthedifferencesinsettlingratesbetweenparticlesofdifferentaerody-
namicdiameters.Acascadeimpactorhasco-linearplatesinseriesofpairsthrough
whichairisdrawn.Therstplateofeachpairhasasmallnozzleornozzlesinit
to control ow velocity. After the sample passes through the nozzle(s), it is turned
sharplybeforethesolidplate,whichactsasacollectionplate.Particleslargerthan
thestagecutdiameter(whichisafunctionoftheowvelocityandthedistance
between the plates) cannot follow the ow stream lines but fall onto the collection
plate.Particlessmallerthanthestagecutdiametercontinuetothefollowingimpac
-
torstages.Ambientaircascadesthroughsucceedingstages,whichhavesuccessively
smalleroricesandconsequentlyhigheroricevelocities.Collectionplatesateach
successive stage will collect successively smaller particles. While most available
units were designed to meet the regulatory requirements to monitor for particulate
matter with aerodynamic diameters of 2.5 μm (PM2.5) or less as a category, newer
unitsdesignedwithupto13stagescanseparateparticulatedownto30nm[34].
Samples are time-integrated and may be collected from the plates for further charac
-
te
rization analyses by electron
mi
croscopyorothertechniques.Amicro-oriceuni-
form deposit impactor (MOUDI) allows collection of nanoparticles in three stages:
<32nm,<18nm,and<10nm.Theseunitshavebeenusedtocharacterizenanopar-
ti
cles from vehicular emissions [35].
5.1.4.3 Electrical Low Pressure Impactor (ELPI)
The electrical low pressure impactor (ELPI) is an extension of cascade impactor
technologythatincludesthemulti-stagecascadeimpactorwithdetectortechnology
to provide real-time data for both particle size and concentration. This makes it pos
-
si
bletomeasurerapidlychangingconditionsinambientair.ThedesignoftheELPI
is based on combining electrical detection principles with low-pressure impactor size
classication. The gas sample containing the particles passes through an electrical
discharge that ionizes aerosol particles. The charged particles then pass into a low-
pressure impactor with electrically isolated collection stages. The electric current
carried by the charged particles into each impactor stage is measured in real-time
byasensitivemultichannelelectrometer.Aversiondesignedforambientorindoor
monitoringcandetectdownto90nanoparticlesinthe30-nmorsmallerrangeper
cubic centimeter (nm/cm
3
),andcanmeasureamassassmallas0.005micrograms
percubicmeter(μg/m
3
)[36].TheELPIhasbeenusedforindoorairmonitoring,
vehicularemissionstudies,andambientairmonitoring[37].
5.1.4.4 Dynamic Light Scattering (DLS)
Where the electrostatic classiers measure the size distributions of particles sus
-
pe
nded in air, dynamic light scattering instrumentation determines size distribu-
ti
onsforparticlessuspendedintheliquidphase.Lightpassingthroughaliquidor
suspension of nanoparticles will be scattered, and for nanoparticles, the intensity
ofthescatteredlightwilluctuate.Thisuctuationresultsfromtherandommove-
me
ntofthenanoparticlesasaresultoftheirrandombombardmentbythemolecules
oftheuid.Thevelocityanddistanceofthismovement(calledBrownianmotion),
and the subsequent uctuation of scattered light intensity, depend on the size of the
© 2009 by Taylor & Francis Group, LLC
112 Nanotechnology and the Environment
particles because smaller particles are “kicked” further by the solvent molecules
andmovemorerapidly.Withamulti-exponentialanalysisofthescatteredlight,a
particlesizedistributioncanbecalculated.Thediameterobtainedbythistechnique,
calledthehydrodynamicdiameter,isthatofaspherethatwouldmovewiththesame
velocity and to the same distance as the particle being measured. For nonspherical
nanoparticles, this diameter will depend on not only the physical dimensions of the
particle,butalsoonitssurfacestructureandoneffectsfromanydissolvedmate-
rialinthesample.ThesizecalculatedfromDLSmeasurementsisoftenlargerthan
thedimensionsmeasuredbyelectronmicroscopy.DLSinstrumentationisreadily
availableandrelativelystraightforwardtouse,andthetechniquecanbeappliedina
dynamic fashion to monitor changes in the degree of clustering or agglomeration of
nanoparticles in situ.
DLS also can be referred to as photon correlation spectroscopy (PLS) or quasi-
elastic light scattering (QELS). The newest instrumentation allows measurements
downto1nm.
DLSisusedinstudiestopredicttoxicityorenvironmentaleffects,andtocon-
rm the size distribution of material before use and to monitor changes. It has been
used to determine the particle size of TiO
2
andfullerenepriortotheiruseinexperi-
ments to determine the effect of ow on transport and deposition in porous media
[38], and to monitor the aggregation of zero-valent iron particles [39] and TiO
2
[40]
in laboratory experiments designed to investigate reasons for the limited mobility of
these in environmental settings.
5.2 WORKPLACE AIR MONITORING
Therstofvechallengesforthesafehandlingofnanotechnologyasidentiedby
scientistsintheeld[41]isto“developinstrumentstoassessexposuretoengineered
nanomaterialsinairandwater,withinthenext3to10years.”Theexposureofwork-
ers to engineered nanoparticles during their production and direct use is of particular
concern,andthechallengecitestheneedforinexpensivepersonalaerosolsamplers
capableofmeasuringandloggingthenumberofnanoparticulates,theirsurfacearea,
and overall mass concentration in order to assess exposure. As discussed in Chapter
9,nanoparticlescanenterthebodythroughrespiratory,dermal,andingestionexpo-
sureandthenbetransportedthroughintercellularpathways.Becausethephysical
characteristics of a nanoparticle (such as size, shape, structure, surface area, and
surface activity) determine the body’s response, knowing the chemical composition
andoverallairconcentrationssolelyintermsofanyoneoftheseparametersisnot
enough. Maynard [42] reviews the challenges and technologies for workplace moni-
toring as was current in 2005.
In some instances, the occupational setting may offer the advantages of limited
complexity and available reference material — when the engineered nanoparticles of
concern are available in adequate amounts for complete characterization, when there
is minimal variability in their physical properties, and when few interferences from
othersourcesintheworkplaceairareexpected.Intheseinstances,themeasure-
ment challenge can be separated into two distinct approaches: (1) physical and chemi-
cal characterization, which can be completed on the source material by appropriate
© 2009 by Taylor & Francis Group, LLC
Analyses of Nanoparticles in the Environment 113
methods already described; and (2) counting or mass measurements to determine par-
ticulate numbers and surface areas for exposure assessment. It should be emphasized,
however, that even in relatively controlled environments, the challenges for protective
monitoringareconsiderable.AsnotedinChapter9ofthisbook,thecurrentstateof
knowledge on the mechanisms of action and toxicology of specic nanomaterials is
verylimited.Thecriticalparametersorappropriaterangeformonitoringforworker
safetyisnotwellunderstoodformostnanomaterials;andgiventheuncertainties,the
design of worker safety monitoring programs that are protective and cost-effective
remains difcult at best. As presented in Section 5.4, governmental agencies on a
global basis have made monitoring for worker safety a research priority.
5.2.1 CONDENSATION PARTICLE COUNTER (CPC)
Condensation particle counters (CPCs) measure the number of particles in an air
sample. Commercially available models operate on the principle that small particles
serveascondensationnucleiforvapors.Aconstantowofairispulledthroughthe
meter,rstenteringachambersaturatedwithwater,alcohol,orotherorganicvapor.
Thesampleandvaporthenenteracooledchamberwherethevaporcondensesonto
theparticles,formingdropletslargeenoughtobedetectedoptically.Unitscurrently
onthemarketincludehand-heldandxedmonitors,withsomecapableofdetect-
ingparticlesdownto2.5nm[43].Thistechniqueprovidesnoinformationonactual
particle size, shape, or composition, and particles larger than nanoparticles will be
counted unless there is some pre-ltering or separation. This technology is useful
for air measurements where the particulates themselves have been characterized by
other techniques or for monitoring where the absolute number of particles, either
totalorbelowapredeterminedsizecutoff,willmeetthemonitoringobjective.
5.2.2 SURFACE AREA: TOTAL EXPOSURE
Asnotedabove,particlecountingmaynotbesufcienttoevaluatepotentialrisksof
exposuretonanoparticles.Foreachtypeofnanomaterial,thesurfaceareaofindi-
vidual particles can signicantly affect the activity of the material toward biological
tissues [44].
Developmentofareal-timeinstrumentthatcanmonitorexposureasopposedto
asingleparameterrepresentsanimportantadvancetowardensuringsafeworking
environments for the engineered nanoparticle industry. The electrical aerosol detector
(EAD) measures a unique aerosol parameter called aerosol diameter concentration,
or total aerosol length. This measurement (reported as mm/cm
3
) represents a number
concentration multiplied by average diameter, and thus is directly related to sur-
face area. The aerosol diameter concentration, when complemented by CPC data
forparticlenumber,canbeusedtocalculatetheaverageparticlesize.Continuous
measurements of aerosol diameter concentration with the EAD correlate well with
thesurfaceareaofdepositedparticlesandarebelievedtoprovideabetterestimateof
actual inhalation exposure than either the mass or number concentration of particles
could.EADhasbeenusedinambientairstudiesattheSt.LouisSupersite[45].
© 2009 by Taylor & Francis Group, LLC
114 Nanotechnology and the Environment
5.3 SAMPLING AND ANALYSIS OF WATERS
AND SOILS FOR NANOPARTICLES
The second subset of the challenge to develop instruments to assess exposure to
engineerednanomaterialsis“todevelopinstrumentsthatcantracktherelease,con-
ce
ntrationandtransformationofengineerednanoparticlesinwatersystems”[41].
Measurements of natural nanoparticles in environmental waters have been reported
by a variety of techniques, but there are few reports at this time of eld studies
designedtodetectengineerednanoparticles.
A separation technique called eld-ow fractionation (FFF) separates
nanoparticles from larger particles, permitting their direct analysis or collection
for detailed characterization.
AsshowninFigure5.4,eld-owfractionationissimilartothechromatographic
separations typical of environmental analyses for organic contaminants. The water
samplepassesthroughathinowchanneldesignedsothattheowwillbelaminar,
that is, not turbulent and faster in the center of the column than at the walls. The
bottomsideofthechannelisamembranethatwillallowwaterthroughbutnotthe
particlesofinterest.Asecondforceisappliedperpendiculartothechannelowto
generateacross-ow.Allparticlesinthesamplewillbepusheddownwardtoward
themembranes,butsmallerparticleswilldiffuseupwardtowardthecenterofthe
channeltoagreaterdegreeandwillbeinthefasterstreamlinesofthechannel
ow.Thesmallerparticlesinthesamplewillexitfromthechannelbeforethelarger
particles.
On
ce separated, natural particles in the nanometer size range can be directly
introduced into an inductively coupled mass spectrometer [46] for elemental analy
-
si
s, collected for ESEM analysis [47], and coupled to a light scattering instrument
forparticlesizemeasurements[48].Field-owfractionationwasappliedforsize
distribution analysis of trace concentrations of iron oxi/hydroxide colloids being
considered as potential carriers for the radionuclide migration from a nuclear waste
repository [49].
FIGURE 5.4 Flow eld fractionation. (From Postnova Analytics, Inc. With permission.)
© 2009 by Taylor & Francis Group, LLC
Analyses of Nanoparticles in the Environment 115
Field ow fractionation also has been applied to the analysis of nanoparticles in
soilandsedimentsystems.Engineeredzincnanoparticleshavebeenseparatedfrom
larger soil particles through the preparation of suspensions that are then shaken and
allowed to settle gravitationally. The supernatant, containing the less than 1-μm par-
ti
cle fraction, was then separated by eld-ow fractionation for further analysis [50].
Analysesofengineerednanoparticlesdirectlyinsoilorsedimentmatricesby
SEMorTEMimagingtechniquesispossiblewhenthematerialhassomeunique
property, such as uorescence or light absorption, or contains a rare metal or unique
organic compound [51]. Nanoparticles of natural origin are ubiquitous, and the
detection of engineered particles against background using these techniques, which
areatbesttime-consumingandcostly,isnotlikelytobeapracticalmeansofroutine
environmental assessments.
5.4 NANOTECHNOLOGY MEASUREMENT
RESEARCH AND FUTURE DIRECTIONS
Both within the United States and internationally, private and governmental organi-
zationshaverecognizedtheneedforimprovedanalyticaltoolsfornanotechnology.
TheAmericanSocietyforTestingandMaterials(ASTM) Committee E56 on Nano-
technology was formed in 2005 to develop standards and guidance for nanotechnol-
RJ\DQGQDQRPDWHULDOV7KH¿UVW$670VWDQGDUGSXEOLVKHGLQ-XO\Sre
cisely
denesthelanguagefornanotechnology[52].Thisshouldallowmoreconsistentand
effective technical communication within the diverse elds involved in nanotechnol-
og
y and with the public.
In late 2005, the International Organization for Standardization (ISO) estab-
li
shed a new technical committee, ISO T/C229 Nanotechnologies, with three working
groups. The United States is represented on the Measurement and Characterization
Workgroup,WG2.TheDraftBusinessPlanforT/C229[53]detailsthehigh-pri-
or
ity needs and strategies for this group. A limited number of standards relating
to nanoparticle measurements have been published, with several more in progress.
ISO/TR 27628:2007 contains guidelines on characterizing occupational nanoaerosol
exposures, with a discussion of applicable measurement terms. Specic information
is provided on methods for bulk aerosol characterization and single-particle analy
-
si
s.OtherstandardscurrentlynearcompletionincludeN270TS:Terminologyand
denitionsforcarbonnanomaterials;N271TS:Formatforreportingtheengineered
nanomaterials content of products; and N 272 TR: Guide to nanoparticles measure-
me
nt methods and their limitations.
5.4.1 UNITED STATES
5.4.1.1 NIOSH
In the United States, the National Institute for Occupational Safety and Health
(NIOSH) established the Nanotechnology Research Center (NTRC) in 2004 to coor-
di
nateandfacilitateresearchontheimpactofnanotechnologyintheworkplace.The
NTRC recognized that in order to evaluate risks, accurate measurement data would
© 2009 by Taylor & Francis Group, LLC
116 Nanotechnology and the Environment
be needed. Measurement method development objectives, as listed in Table 5.2, were
accordinglyincludedascriticaltopicsfortheirstrategicworkplacegoals.
The NTRC established several partnerships with other agencies, including
U.S. EPA, NIST, the Department of Defense (DOD) and the Department of Energy
(DOE),andASTM.Inaddition,theNTRCispartneringwithandinsomeinstances
supporting research at academic institutions, instrument manufacturers, and private
industry. Table 5.3 summarizes method analysis studies included in the research pro-
gramplannedfortheperiod2005through2009[54].
Accomplishments and publications for 17 completed and ongoing research
programsarelistedinthe2007NIOSHreportentitled“ProgresstowardSafe
Nanotechnology in the Workplace” [55]. “Project 1, Generation and Character-
izationofOccupationallyRelevantAirborneNanoparticles,”includesnumerous
accomplishments relevant to the characterization and workplace measurement of
carbon nanotubes and TiO
2
. Project 11, Nanoparticles in the Workplace, is designed
to develop partnerships with industry, academia, and other government agencies for
research and development of monitoring instrumentation and protocols. Project 13,
TheMeasurementandControlofWorkplaceNanoparticles,willprovideabasisfor
TABLE 5.2
NIOSH Goals for Nanoparticle Measurement
1. Evaluating methods of measuring mass of respirable particles in the air and determining if this
measurement can be used to measure nanomaterials
2. Developing and eld-testing practical methods to accurately measure airborne nanomaterials
in the workplace
3. Developing testing and evaluation systems to compare and validate sampling instruments
TABLE 5.3
NIOSH Research Agenda
Fiscal Year
NIOSH Nanoparticle Research Strategic Plan and Timeline
(Measurement and Analysis Programs)
2005 Surveillance Phase I: Identify and gather baseline information. Develop techniques for
online surface area measurement.
2006 Conduct measurement studies of nanoparticles in the workplace. Analyses of lter
efciency for nanomaterials.
2007 Evaluate surface area-mass metric results. Establish a suite of instruments and
protocols for nanomaterial measurements. Conduct measurement studies of
nanoparticles in the workplace. Further development of online and ofine nanoparticle
measurement methods.
2008–2009 Develop performance results for nanoparticle measurement instruments and methods.
Complete evaluation of viable and practical workplace sampling devices and methods
for nanoparticles (affordable, portable, effective). Quantication of systemic
nanoparticle concentrations in laboratory animals after pulmonary exposure to
nanospheres and nanobers.
© 2009 by Taylor & Francis Group, LLC
Analyses of Nanoparticles in the Environment 117
understandinghownanoparticlesarereleasedintheworkplaceandhowtheycanbe
monitoredandexposurecontrolled.ResearchProject14isanexposurestudyofTiO
2
in manufacturing and end-user facilities using a variety of monitoring techniques.
5.4.1.2 U.S. Government-Sponsored Research
The Project on Emerging Nanotechnologies of the Woodrow Wilson International
Center for Scholars in Arlington, Virginia, is developing an inventory of govern-
me
nt-sponsored research into the environmental, health, and safety implications
ofnanotechnology[56].Whiletheintentofthisinventoryistoincluderesearch
projects on an international basis, the current listing is dominated by projects sup-
ported by U.S. agencies. Included in these are several funded by the U.S. EPA, the
Department of Energy (DOE), the National Science Foundation (NSF), and NIOSH
that should provide information on environmental measurements. Current projects
included in this inventory that are of particular relevance to environmental measure-
mentsincludethoselistedinTable5.4.
5.4.1.3 National Institute of Standards and Technology (NIST)
In early 2006, the National Institute of Standards and Technology (NIST) launched a
newstate-of-the-artCenterforNanoscaleScienceandTechnology(CNST)[57].The
CNST is specically dedicated to developing the measurement methods and tools
needed to support all phases of the nanotechnology industry. While the Center’s
focusisnotspecicallytowardenvironmentalmethodsoranalyses,measurement
advances for discovery, development, and manufacturing of nanoparticles should
haveapplicabilityinmonitoringtheirpresenceandeffectsintheenvironment.
NIST has responsibility for the development and supply of standard reference
materials for analyses of various chemicals and materials. Academic laboratories
TABLE 5.4
U.S. Government Supported Research on Nanotechnology Environmental
Measurements
Project Title Sponsor Anticipated End Year
Biological Fate and Electron Microscopy Detection of
Nanoparticles during Wastewater Treatment
EPA 2010
Development of Detection Techniques and Diagnostics for
Airborne Carbon Nanotubes
DOE 2007
Fate and Transport of Carbon Nanotubes in Unsaturated and
Saturated Soils
EPA 2008
Identifying and Regulating Environmental Impacts of
Nanomaterials
NSF 2007
Monitoring and Characterizing Airborne Carbon Nanotube
Particles
NIOSH 2008
New Instruments for Real-Time, High Resolution
Characterization of Nanoparticles in the Environment
NSF 2007
© 2009 by Taylor & Francis Group, LLC
118 Nanotechnology and the Environment
as well as commercial facilities use these standard reference materials to verify the
accuracy of their data. NIST currently provides certied polystyrene spheres for
nanoparticle size analyses. NIST [57] also reports a recent development of a proto-
ty
pe atomic “ruler” for calibrating dimensional measurements of 100 nm and below.
Thisrulerwillbeabletodocumenttheaccuracyofscanningelectronoratomic
forcemicroscopydata.NISTnowistransferringthetechnologytoacommercial
standards supplier.
5.4.2 EUROPEAN UNION
TheEuropeanUnion(EU)launcheditslargesteverfundingprogramforresearch
andtechnologicaldevelopmentonJanuary1,2007.TheEUMemberStateshave
earmarked a total of €3.5 billion (approx. U.S. $4.5 billion) for funding nanotechnol-
og
yrelatedresearchovertheperiod2007to2013.Theprogramcallsforproposals
forawiderangeofactivitiesrelatedtotheriskassessmentofnanomaterials[58].
FirstamongveareaswhereproposalsareinvitedisNMP-2007-1.3-1,“Specic,
easytouseportabledevicesformeasurementandanalysis.”Basedonthebeliefthat
workplace exposure is the area of greatest concern, the objective of this work will be
“to develop and validate affordable, portable, adequate sampling and measurement
equipment for monitoring working environments (i.e., quantication and character
-
i
z
ationofairbornenanoparticlesinparticular).”
German governmental agencies, including the Federal Institute for Occupational
SafetyandHealth(BAuA),theFederalInstituteforRiskAssessment(BfR),and
theFederalEnvironmentAgency(UBA),havejointlydevelopedananotechnology
researchstrategyandarecurrentlyconductingalimitednumberofprojects[59].Two
ofthesearedesignedtotestinstrumentationormodifyandvalidateexistingmea
-
su
rementmethodstobeapplicableforworkplacemeasurementsofnanoparticles.
5.4.3 ASIA-PACIFIC
The Industrial Technology Research Institute (ITRI) of Chinese Taipei is under-
taking an international project awarded by the Asia-Pacic Economic Cooperation
(APEC)IndustrialScienceandTechnologyWorkingGroup(ISTWG)toassistinthe
establishment of the Technological Cooperative Framework on Nanoscale Analyti
-
cal
and Measurement Methods among APEC economies. This cooperative project
was formed to create an avenue for sharing advances in nanometer analytical mea-
su
rement methods and to promote the best available technology to meet the needs
fornanoscalestandards[60].TheUnitedStatesisoneofsixnationsparticipatingin
this project.
As part of the project, the NanoTechnology Research Center (also using the acro
-
ny
m NTRC) of ITRI is organizing an interlaboratory comparison study on nanopar-
ti
clecharacterization.Theaimofthecomparisonistoestablishtheeffectiveness
and comparability of different measurement methods across different laboratories
on nanometer-scale particles. This multi-year program will include a series of mea
-
su
rement challenges using standardized material, as shown in Table 5.5.
The results for 2005 interlaboratory comparison measurements of size and
diameter have been published [60]. The
NTRC p
rovided samples of polystyrene
© 2009 by Taylor & Francis Group, LLC
Analyses of Nanoparticles in the Environment 119
spheres with diameters of 30, 50, and 100 nm to participating laboratories. The study
generatedatotalof32datasetsfrom15participatinglaboratories.Particlesize
measurementsweremadeusingDLS,SEM,TEM,andSPMinstrumentation.The
results for the 30-nm particles were satisfactory from all measurements, while two
measurementsforthe50-nmparticlesandfourforthe100-nmsamplefelloutside
threestandarddeviationsofthemean.MeasurementstakenbyTEMforthe30-nm
and 100-nm particles were signicantly below the expected diameters and below the
resultsfromtheothertechniques.Samplesweredistributedforthe2006studies,and
16 laboratories have reported results, but these have not been made publicly available
atthetimeofwriting.
5.5 SUMMARY
Reliable and accurate measurements of nanoparticle physical and chemical proper-
ties have been recognized as critical elements required for meaningful assessments
of impact and risk. While numerous technologies do exist, many challenges to mea
-
su
ring engineered nanoparticles in the environment have yet to be addressed. The
combinationoftheirsmallsizeandtherangeofattributesthatmayfactorintotheir
activity requires a complex matrix of complementary analyses and methods, for
many critical parameters have yet to be devised for nanoparticles in environmental
settings. Environmental analyses of nanoparticles are far from routine or readily
availableatthispoint,buttheincreasedinterestandfocusofgovernmentalagencies
and research organizations allows for optimism.
REFERENCES
1. Powers, K.W., M. Palazuelos, B. Moudgil, and S. Roberts. 2007. Characterization of
the size, shape, and state of dispersion of nanoparticles for toxicological studies. Nano-
toxicology, 1:42–51.
2. U.S. Environmental Protection Agency. 2007. EPA Nanotechnology White Paper.U.S.
EPA 100/B-07/001.
3. Burleson, D.J., M.D. Driessen, and R.L. Penn. 2004. On the characterization of envi-
ron
mental nanoparticles. J. Env. Science Health, 39:2707–2753.
4. Durbin, T.D., J.M. Norbeck, D.R. Cocker, and T. Younglove. 2004. Particulate Matter
Mass Measurement and Physical Characterization — Techniques and Instrumentation
for Laboratory Source Testing. Final Report ARB Literature Searches.
TABLE 5.5
APEC Nanometer Measurement Interlaboratory
Comparison Studies for Nanoparticles
Year Characteristic
2005 Size/diameter
2006 Surface area, refractive index, light absorption/reection
2007 Number and distribution, conductivity, dispersion
© 2009 by Taylor & Francis Group, LLC
120 Nanotechnology and the Environment
5. Scalera, J. 2006. Detection and Characterization of Nanomaterials in the Environment.
Presented at Session 3 of
the EPA Symposium on Nanotechnology and the Environ-
ment. />html.
6.
Manseld,J.F.2000.Anintroductiontothetransmissionelectronmicroscopeand
what it can do. />7. Grassian, V., P.T. O’Shaughnessy, A. Adamcakova-Dodd, J.M. Pettibone, and P.S.
Thorne. 2007. Inhalation exposure study of titanium dioxide nanoparticles with a pri
-
ma
ryparticlesizeof2to5nm.
Environ Health Perspect.
,
115:397–402.
8. Lovern, S. and R. Klaper. 2006.
Daphnia Magna m
o
rtality when exposed to titanium
dioxide and fullerene (C60) nanoparticles.
Environ. Tox. Chem., 25:1132–1137.
9
.
Rothen-Rutishauser, B.M., S. Schurch, B. Haenni, N. Kapp, and P. Gehr. 2006.
Interac-
t
i
on of
ne particles and nanoparticles with red blood cells visualized with advanced
microscopic techniques.
Environ. Sci. Technol., 40:4353–4359.
10.Sipzner,L.,J.Stettin,Z.Pan,etal.2006.Thepenetrationoftitaniumdioxide
nanoparticles: from dermal broblasts to skin tissue. American Physics Associa
-
ti
on. />11. Utsunomiya,S.,K.Jensen,G.Keeler,andR.Ewing.2004.Directidenticationoftrace
metals in ne and ultrane particles in the Detroit urban atmosphere.
Environ. Sci.
Technol ., 38:2289–2297.
12. Rossi,M.P.,H.Ye,Y.Gogotsi,S.Babu,P.Ndungu,andJ C.Bradley.2004.Environ
-
m
e
ntal scanning electron microscopy study of water in carbon nanopipes.
Nano Lett.,
4:989–993.
13. Bogner,A.,G.Thollet,D.Bassett,P H.Jouneau,andC.Gauthier.2005.WetSTEM:a
new development in environmental SEM for imaging nano-objects included in a liquid
phase.
Ultramicroscopy,
1
04:290 –301.
14. Köllensperger, G., G. Friedbacher, A. Krammer, and M. Grasserbauer. 1999. Applica
-
t
i
on of atomic force microscopy to particle sizing.
Fres. J. Anal. Chem.,
3
63:323–332.
15. Baalousha, M. and J.R. Lead. 2007. Characterization of natural aquatic colloids (<5
nm) by ow eld fractionation and atomic force microscopy.
Environ. Sci. Technol.,
41:1111–1117.
16
.Doucet,F.,L.Maguire,andJ.Lead.2004.Sizefractionationofaquaticcolloidsand
particlesbycross-owltration:analysisbyscanningelectronandatomicforcemicros
-
copy.
Anal.Chim. Acta,
522:59–71.
17.
L
ead,J.R.,D.Muirhead,andC.T.Gibson.2005.Characterizationoffreshwater
natural aquatic colloids by atomic force microscopy (AFM).
Environ. Sci. Technol.,
39:6930–6936.
18.
Pacic Nanotechnology. 2007. Atomic Force Microscopes – Tutorial Page. http://www.
pacicnano.com/afm-tutorial.html.
19. Nanoscience Instruments. 2007. Nanoscience Education. oscience.
com/education/AFM.html.
20. Gard,E.,J.E.Mayer,B.D.Morrical,T.Dienes,D.P.Fergenson,andK.A.Prather.1997.
Real-time analysis of individual atmospheric aerosol particles: design and performance
of a portable ATOFMS.
Anal. Chem.
,
69:4083–4091.
21. Silva, P. and K. Prather. 2000. Interpretation of mass spectra from organic compounds
inaerosoltime-of-ightmassspectrometry.AmericanPhysicalSocietyMarch2006
Meeting.
Anal. Chem.,
7
2:3553–3562.
22.Wang,S.,C.A.Zordan,andM.V.Johnston.2006.Chemicalcharacterizationofindi
-
vi
dual, airborne sub-10-nm particles and molecules.
Anal. Chem.
,
78:1750–1754.
23. Sullivan, R.C. and K.A. Prather. 2005. Recent advances in our understanding of atmo
-
s
p
heric chemistry and climate made possible by on-line aerosol analysis instrumenta
-
t
i
on.
Anal. Chem.,
7
7:3861–3886.
© 2009 by Taylor & Francis Group, LLC
Analyses of Nanoparticles in the Environment 121
24. Kolb, C.E., S.C. Herndon, J.B. McManus, et al. 2004. Mobile laboratory with rapid
response instruments for real-time measurements of urban and regional trace gas and
particulate distributions and emission source characteristics.
Environ. Sci. Technol.,
38:5694–5703.
25
. Reilly, P.T.A., R.A. Gieray, W.B. Whitten, and J.M. Ramsey. 2000. Fullerene evolution
in ame-generated soot.
J. Am. Chem. Soc.,122:11596–11601.
26. TSI. 2004. Series 3800 Aerosol Time-of-Flight Mass Spectrometers with Aerodynamic
Focusing Lens Technology. />27.Sodeman,D.A.,S.M.Toner,andK.A.Prather.2005.Determinationofsingleparticle
mass spectral signatures from light-duty vehicle emissions.
Environ. Sci. Technol.,
39:4569–4580.
28.
Chianelli, R.R., M.J. Yácaman, J. Arenas, and F. Aldape. 1998. Atmospheric nanopar
-
t
i
cles in photocatalytic and thermal production of atmospheric pollutants.
J. Haz. Sub-
stances Res., 1:1–17.
29.Li,Q.,R.Xie,Y.W.Li,E.A.Mintz,andJ.C.Shang.2007.Enhancedvisiblelight
induced photocatalytic disinfection of
E. coli bynitrogendopedtitaniumoxide.Envi-
ron. Sci. Technol.,
41:5050–5056.
30. Kittelson, D.B., W.F. Watts, and J.P. Johnson. 2001. Fine Particle (Nanoparticles) Emis
-
s
i
ons on Minnesota Highways. Minnesota Department of Transportation.
31.Nziadchristos,L.,A.Polidori,H.Phuleria,M.Gillen,andC.Sioutasm.2007.Appli
-
ca
tionofadiffusionchargerforthemeasurementofparticlesurfaceconcentrationin
different environments.
Aerosol Sci. Technol., 41:511–580.
32. Kim,S.H.andM.R.Zachariah.2005.In-ightsizeclassicationof
c
arbon nanotubes
by gas phase electrophoresis.
Nanotechnology, 16:2149–2152.
33.Hsu,L Y.andH M.Chein.2007.EvaluationofnanoparticlesemissionsforTiO
2
nanopowder coating material. In
Nanoparticles and occupational health,
E
ds. A.D.
Maynard and D.Y.H. Pui, p. 157–163. Springer Netherlands.
34. Dekati. 2007. Specication Sheet: Dekati Low Pressure Impactor. ati.
com/cms/dlpi/specications.
3
5
. Wu, Y S., G.C. Fang, S Y.Chang, J Y. Rau, S H. Huang, and C K.Lin. 2006. Charac
-
t
e
risticstudyofionicspeciesinnano,ultrane,neandcoarseparticlesizemodeata
trafc sampling site. Toxicol. Indust. Health, 22: 27–37.
36. Dekati. 2007. Outdoor Air Electrical Low Pressure Impactor. ati.
com/cms/outdoor_air_elpi.
37. Kittelson, D.B., W.F. Watts, J.P. Johnson,
a
nd M.K. Drayton. 2001. Fine Particle
(Nanoparticle) Emissions on Minnesota Highways. Presented at the 7th Diesel Engine
Emissions Reduction (DEER) Workshop. />DEER2001.pdf.
38. Lecoanet,H.,J.Rottero,M.Weisner.2004.Laboratoryassessmentofthemobilityof
nanomaterialsinporousmedia.
Environ. Sci. Technol., 38:5764–5768.
39
. Phenrat, T., N. Saleh, K. Sirk, R. Tilton, and G. Lowry. 2007. Aggregation and sedi
-
m
e
ntation of aqueous nanoscale zerovalent iron dispersions.
Environ. Sci. Technol.,
41:284 –290.
40. DunphyGuzman,K.,M.Finnegan,andJ.Baneld.2006.Inuenceofsurfacepoten
-
t
ia
l on aggregation and transport of titania nanoparticles.
Environ. Sci. Technol.,
40:7688–7693.
41
. Maynard, A. 2006. Safe handling of nanotechnology.
Nature
4
44:267-269.
42. Maynard, A. 2005. Engineered Nanomaterials: Measurement in the Occupational Set
-
ti
ng. Project on Emerging Technologies. Presented at
ECETOC Nanomaterials,
B
arce-
lona, Spain.
43. BPAAirQualitySolutions,Inc.2007.NanoParticleCountersProductReviews.http://
www.particlecounters.org/nano/.
© 2009 by Taylor & Francis Group, LLC
122 Nanotechnology and the Environment
44. Oberdörster, G., E. Oberdörster, and J. Oberdörster. 2005. Nanotoxicology: an emerg-
in
g discipline evolving from studies of ultrane particles.
Environ. Health Perspect.,
113:823–839.
45. Han, H.S., S. Kaufman, J. Turner, W. Wilson, and D.Y. Pui. 2005. Electrical aero
-
s
o
ldetector(EAD)measurementsattheSt.LouisSupersite.Presentedat
AAAR PM
Supersites Program and Related Studies International Specialty Conference,Atlanta,
GA, 7–11 February. />46. Stolpe,B.,M.Hassellov,K.Andersson,andD.Turner.2005.HighresolutionICPMS
as an on-line detector for ow eld-ow fractionation: multi-element determination of
colloidalsizedistributionsinanaturalwatersample.
Anal. Chim. Acta, 5
35:109–121.
47. DeMomi,A.andJ.Lead.2006.Sizefractionationandcharacterizationoffreshwater
colloids and particles: split-ow thin cell and electron microscopy analyses.
Environ.
Sci. Technol., 4
0:6738–6743.
48. Baalousha, M., F.V.D. Kammer, M. Motelica-Heino, H.S. Hidal, and P. Le Coustumer.
2006. Size fractionation and characterization of natural colloids by ow-eld ow frac
-
tionation coupled to multi-angle laser light scattering.
J. Chromatogr,
1
104:272–281.
49.Bouby,M.,H.Geckeis,T.N.Manh,etal.2004.Laser-inducedbreakdowndetection
combined with asymmetrical ow eld-ow fractionation: application to iron oxi/
hydroxide colloid characterization.
J. Chromatogr,
1
040:97–104.
50. Gimbert,L.J.,R.E.Hamon,P.S.Casey,andP.J.Worsfold.2007.Partitioningandsta-
bility of engineered ZnO nanoparticles in soil suspensions using ow eld-ow frac
-
t
i
onation.
E
nviron. Chem., 4:8–10.
51. von der Kammer, F., T. Hoffman, and M. Hasselhov. 2006. Nanopollution: How to Gain
Knowledge on the Behavior and pthwaysof Engineered Nanoparticles in the Aquatic
Environment. Poster presentation,
SETAC 2006. www.univie.ac.at/env-geo/Publica-
tions/Poster/vdKammer_SETAC_2006_NANOPOLLUTION.pdf
$670StandardE2456-06,TerminologyforNanotechnology.
53. ISO. 2007. Business Plan ISO/TC 229 Nanotechnologies (Draft) ISO/TC 229 N230.
54. NIOSH.2005.StrategicPlanforNIOSHNanotechnologyResearch:FillingtheKnowl
-
edge Gap. Draft. Nanotechnology Research Program.
55. NIOSH. 2007. Progress toward Safe Nanotechnology in the Workplace. DHHS
(NIOSH) Publication No. 2007–123.
56. Woodrow Wilson International Center for Scholars. Nanotechnology Health and Envi
-
ronmental Effects: An Inventory of Government-Supported Research. http://nanotech
-
project.org/index.php?id=29.
57
.NIST.2006.FactSheetfromNIST:IntroducingtheNISTCenterforNanoscaleSci
-
e
n
ce and Technology. />htm.
58. European Commission. 2005. Seventh Framework Programme of the European Com
-
m
u
nity for Research and Technological Development including Demonstration Activi
-
t
i
es (FP7).
59. BAUA, BfR, UBA. 2006. Nanotechnology: Health and Environmental Risks of
Nanoparticles — Research Strategy (Draft).
60. Fu, W E. 2006. APEC Project: Technological Cooperative Framework on Nanoscale
Analytical and Measurement Methods: Project Overview. Presented at the
2006 APEC
Nanoscale Technology Forum.