Sediment and Contaminant Transport in Surface Waters - Chapter 4 pptx
Bạn đang xem bản rút gọn của tài liệu. Xem và tải ngay bản đầy đủ của tài liệu tại đây (1.85 MB, 71 trang )
103
4
Flocculation, Settling,
Deposition, and
Consolidation
Much of the suspended particulate matter in rivers, lakes, and oceans exists in
the form of ocs. These ocs are aggregates of smaller, solid particles that may
be inorganic or organic. The emphasis here is on the dynamics of aggregates that
are primarily inorganic — that is, ne-grained sediments. These are especially
prevalent in rivers, in the near-shore areas of lakes and oceans, and throughout
estuaries. Because they are ne-grained, these sediments have large surface-
to-mass ratios and hence adsorb and transport many contaminants and other
substances with them as they move through an aquatic system. Flocculation is a
dynamic process; that is, ocs both aggregate and disaggregate with time, and
their sizes and properties change accordingly. The net rate of change of oc
properties depends on the relative magnitudes of the rates of aggregation and
disaggregation, with the steady state being a dynamic balance between the two.
It is this dynamic nature of a oc that is particularly interesting and one of the
major concerns in the present chapter.
Section 4.1 considers the basic theory of the aggregation of suspended particles.
This is useful for a preliminary understanding of the experimental results on the
occulation of suspended particles presented in Section 4.2. As ocs are formed,
their sizes and densities change with time and are quite different from the sizes
and densities of the individual particles that make up a oc; this greatly modies
the settling speed of the oc. Experimental measurements on the settling speeds
of ocs are presented in Section 4.3. Based on the elementary theory of aggrega-
tion presented in Section 4.1 and especially the experimental data presented in
Sections 4.2 and 4.3, numerical models of the aggregation and disaggregation of
suspended particles have been developed; these are discussed in Section 4.4.
As sediments (both individual particles and ocs) are transported through
surface waters, they tend to settle to the bottom. The rate at which they deposit
on the bottom depends on the sediment concentration, the settling speeds of the
particles and ocs, and the dynamics of the uid. This is discussed in Section
4.5. Finally, as particles and ocs are deposited on the bottom, the bottom sedi-
ments consolidate; that is, the bulk density, water content, gas content, and ero-
sive strength of the bottom sediments change with depth and time. Information
on these processes is given in Section 4.6.
© 2009 by Taylor & Francis Group, LLC
104 Sediment and Contaminant Transport in Surface Waters
4.1 BASIC THEORY OF AGGREGATION
4.1.1 C
OLLISION FREQUENCY
A general formula for the time rate of change of a suspended particle/oc size
distribution will be developed later in Section 4.4. However, basic to this general
formula and to a preliminary understanding of the experimental work is a knowl-
edge of the collision frequency, N
ij
(the number of collisions occurring between
particles in size class i and particles in size class j per unit volume and per unit
time). If binary collisions are assumed, N
ij
can be written as
Nnn
ij ij i j
B (4.1)
where C
ij
is the collision frequency function (volume per unit time) for collisions
between particles i and j, and n
k
is the number of particles per unit volume in size
range k.
The quantities C
ij
depend on the collision mechanisms of Brownian motion,
uid shear, and differential settling. The original collision rate theories are due
to Smoluchowski (1917), and additional work has been performed by Camp and
Stein (1943). Ives (1978) presents the expressions for the different collision func-
tions as follows. For Brownian motion,
BB
M
ij b
ij
ij
kT
dd
dd
2
3
2
()
(4.2)
where k is the Boltzmann constant (1.38 × 10
−23
Nm/nK), T is the absolute tem-
perature (in Kelvin), µ is the dynamic viscosity of the uid, and d
i
and d
j
are the
diameters of the colliding particles. For uid shear,
BB
ij f i j
G
dd
6
3
() (4.3)
where G (s
−1
) is the mean velocity gradient in the uid. For a turbulent uid, G
can be approximated by (F/O)
1/2
where F is the energy dissipation and O is the kine-
matic viscosity (Saffman and Turner, 1956). For differential settling,
BB
P
P
M
RR
ij d i j si sj
fwij
ddw w
g
dd
4
72
2
()
()(
))
22 2
dd
ij
(4.4)
© 2009 by Taylor & Francis Group, LLC
Flocculation, Settling, Deposition, and Consolidation 105
where w
si
is the settling speed of the i-th particle/oc, S
f
is the density of a par-
ticle/oc, S
w
is the density of the water, and g is the acceleration due to gravity.
The rst equality is generally true, whereas the second equality is only valid
when the densities of all ocs are approximately the same and when Stokes law,
Equation 2.4, is valid.
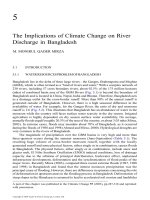
A comparison of collision functions for collisions of an arbitrary-size par-
ticle with a particle of 1 µm diameter is shown in Figure 4.1(a). For this compari-
son, the following data used were: T = 20°C = 293K, G = 200/s, S
f
=2.65 g/cm
3
,
and S
w
=1.0g/cm
3
. As can be seen, Brownian motion is only important for colli-
sions of a 1-µm particle with particles less than 0.1 µm. For collisions of a 1-µm
particle with particles between 0.1 and 50 µm, collisions are caused primarily by
uid shear, whereas collisions of a 1-µm particle with particles greater than 50
µm are caused primarily by differential settling. As the applied shear decreases,
C
f
will decrease and the range of diameters over which uid shear is dominant in
causing collisions will decrease. As the oc density decreases, C
d
and the effects
of differential settling will decrease. Figure 4.1(b) shows the collision functions
for collisions of an arbitrary-size particle with a particle of 25 µm. Again, uid
shear is the dominant mechanism for collisions of a 25-µm particle with other
particles up to 50 µm, whereas differential settling is more important for larger
particles. The effects of Brownian motion are negligible.
FIGURE 4.1(a) Collision function C as a function of particle size: collisions with a 1-µm
particle. C
f
is the collision function due to uid shear, C
d
is the collision function due to
differential settling, and C
b
is the collision function due to Brownian motion. For these
calculations, T = 298K, G = 200/s, and S
p
− S
w
=1.65 g/cm
3
.
© 2009 by Taylor & Francis Group, LLC
106 Sediment and Contaminant Transport in Surface Waters
4.1.2 PARTICLE INTERACTIONS
In the derivation of Equations 4.2 through 4.4 for the collision frequency func-
tions, it was assumed that forces between particles were negligible. For predict-
ing the rate of collisions between particles, this approximation is quite accurate.
For a more accurate analysis of the entire collision process, these forces (which
can be both attractive and repulsive) must be considered. It can be shown that
these forces somewhat modify the rates of collisions (Friedlander, 1977), but,
more importantly, they affect the probability of cohesion of particles during the
collision process. The VODL theory by Verwey and Overbeek (1948) and Dar-
jagin and Landau has been developed that includes these forces and assists in
understanding the cohesion of colliding particles. This theory is only briey sum-
marized here; for more details, extensions, and additional theories, see Hiemenz
(1986) and Stumm and Morgan (1996).
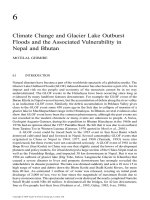
Figure 4.2 is a schematic of the potential energies between two interacting
particles. The forces between the two particles are proportional to the slopes of
the potential energy curves. The gure shows repulsive and attractive potential
energies whose magnitudes decrease as the distance between particles increases.
For small separations, on the order of twice the radius of the particles, more com-
plex interactions occur; these forces are generally strongly repulsive.
The attractive forces are of the van der Waals type. The resultant attractive
force is the summation of the pairwise interactions of the molecules making up
FIGURE 4.1(b) Collision function C as a function of particle size: collisions with a
25-µm particle. C
f
is the collision function due to uid shear, C
d
is the collision function
due to differential settling, and C
b
is the collision function due to Brownian motion. For
these calculations, T = 298K, G = 200/s, and S
p
− S
w
=1.65 g/cm
3
.
© 2009 by Taylor & Francis Group, LLC
Flocculation, Settling, Deposition, and Consolidation 107
the individual particles. It depends on the molecules making up the individual
particles but does not depend signicantly on external parameters.
Clay particles (as well as coated, nonclay particles) in solution are normally
charged due to unbalanced cations at their surfaces; this leads to a repulsive force
between particles. When ions are present in a system that contains an interface,
there will be a variation in the ion density near that interface; an electrical double
layer results. The net effect of this double layer is to reduce the repulsive force.
This force is a function of the charge or potential of the particle as well as the
ionic strength (salinity) of the solution. In particular, as the ionic strength of the
solution increases, this repulsive force decreases.
The net potential energy of two colliding particles is the sum of the repulsive
and attractive potentials. In Figure 4.2, the net potential energy is positive at large
distances and negative at small distances. A dashed curve has been added to show
schematically the bottom of the potential well. Because of the variations in the
repulsive and attractive potentials in magnitude and with distance, other forms
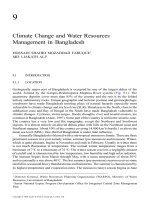
of potential energy curves also can occur. Possible potential energies for differ-
ent ionic strengths (low, medium, high) of the solution are shown in Figure 4.3.
For low ionic strength, the maximum potential energy is relatively large and
decreases slowly with increasing distance between particles. Because of the large
potential energy, the speed of particle aggregation is relatively low because the
particles cannot readily overcome this barrier. As the ionic strength increases, the
maximum potential energy decreases and the speed of aggregation of particles
should therefore increase. In some cases, there may be a secondary minimum (as
shown); this is seldom very deep but could possibly explain some weak forms of
occulation. For high ionic strengths, the potential energy is negative everywhere
and the rate of aggregation should therefore be quite high. As constructed, the
Repulsive
(electrostatic double layer)
Attractive
(van der Waals)
Distance
Net
Interaction
Potential Energy
2R
FIGURE 4.2 Schematic of potential energies between two interacting particles.
© 2009 by Taylor & Francis Group, LLC
108 Sediment and Contaminant Transport in Surface Waters
depths of the potential wells (the difference between the maximum and minimum
potential energies) are approximately the same.
4.2 RESULTS OF FLOCCULATION EXPERIMENTS
For aggregation to occur, particles must collide and, after collision, they must
then stick together. As described above, the rates at which particles collide are
reasonably well understood. However, as particles collide, usually only a small
fraction of the collisions actually results in cohesion of the particles; this process
is not well understood or well quantied. Because of this, experiments are needed
to determine the probability of cohesion and the parameters on which this prob-
ability depends. In addition, during transport, the disaggregation of ocs also can
occur. This disaggregation is due to uid shear and, most importantly for many
conditions, is due to collisions between ocs. The probability of disaggregation
and the parameters on which it depends cannot be predicted from present-day
theory and thus must be determined from experiments.
To quantify the rates of aggregation and disaggregation and determine the
parameters on which these processes depend, two types of occulation experiments
have been performed. In the rst type of experiment, a Couette occulator was used
to determine the effects of an applied uid shear on occulation; uid shear, sedi-
ment concentration, and salinity were varied as parameters. In these experiments,
differential settling of particles/ocs was inherently present. In the second type of
experiment, a disk occulator was used to isolate and hence determine the effects of
Potential Energy
Low
Medium
High
Distance
FIGURE 4.3 Potential energies between two interacting particles for different ionic
strengths.
© 2009 by Taylor & Francis Group, LLC
Flocculation, Settling, Deposition, and Consolidation 109
differential settling on occulation in the absence of an applied uid shear; sediment
concentration and salinity were varied as parameters. The emphasis in both sets of
experiments was to characterize occulation as a function of time and to determine
the effects of uid shear, sediment concentration, and salinity on this occulation.
4.2.1 FLOCCULATION DUE TO FLUID SHEAR
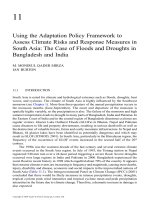
A typical Couette occulator is shown in Figure 4.4 (Tsai et al., 1987). It consists
of two concentric cylinders, with the outer cylinder rotating and the inner cylinder
stationary. In this way, a reasonably uniform velocity gradient can be generated in
the uid in the annular gap between the cylinders. The width of the gap is 2 mm.
The ow is uniform and laminar for shears up to 900/s, after which the ow is no
longer spatially uniform and eventually becomes turbulent for higher shears.
For the experiments reported here, the sediments were natural bottom sedi-
ments from the Detroit River inlet of Lake Erie. These were prepared by ltering
and settling so that the initial (disaggregated) size distribution had approximately
90% of its mass in particles less than 10 µm in diameter. The median diameter of
the disaggregated particles was about 4 µm. The experiments were performed at
different sediment concentrations; at shears of 100, 200, and 400/s; and in waters
of different salinities. Because U = µG and µ is approximately 10
−3
Ns/m
2
, these
shears correspond to shear stresses of 0.1, 0.2, and 0.4 N/m
2
. These shear stresses
are typical of conditions in the nearshores of surface waters. In open waters, they
would be less than this. Particle size distributions were periodically measured
during the tests using a Malvern particle size analyzer.
As shown by Camp and Stein (1943) and Saffman and Turner (1956), the
occulation rate in a laminar ow can be related to the rate in a turbulent ow
by replacing the laminar shear by an effective turbulent shear equal to (F/O)
1/2
,
where F is the average turbulent energy dissipation rate per unit mass and O is the
kinematic viscosity of water. This relation is valid as long as the size of the ocs
is less than the size of the turbulent eddies. In isotropic turbulence in open water,
Center Shaft End Piece
Intake
Port
Annulus
Stop
Cock
Bearing
Seal
2.5 cm
25.4 cm
2.3 cm
Hose
Gear
FIGURE 4.4 Schematic of Couette occulator. (Source: From Tsai et al., 1987. With
permission.)
© 2009 by Taylor & Francis Group, LLC
110 Sediment and Contaminant Transport in Surface Waters
this size is given by the Kolmogorov microscale of turbulence. For estuaries and
coastal seas, the eddies are on the order of a few millimeters or larger (Eisma,
1986). In the bottom benthic layer, the turbulence is no longer isotropic, but eddy
sizes are generally 1 mm or larger. Because the sizes of the ocs in the present
experiments are less than 400 µm, and generally much less, the above relation is
generally valid and the conditions in the occulator can be related to turbulent
ows in rivers, lakes, estuaries, and oceans.
In occulation experiments, some investigators have used a tank with some
sort of agitator or blade. Flows in this type of apparatus are turbulent but far from
uniform, with very high shears produced near the agitator and generally quite low
shears elsewhere. The high shears will dominate the aggregation–disaggregation
processes. Because of this, the effective shear will be much higher (by an unde-
termined amount) than the average shear, and therefore the use of the average
shear in correlating the experimental results is not accurate.
In the rst set of experiments described here (Tsai et al., 1987; Burban et al., 1989),
tests were conducted with identical sediments in fresh water, in sea water, and in an
equal mixture of fresh and sea water so as to mimic estuarine waters. In fresh water,
the rst tests were double shear stress tests and were done as follows. The sediments
in the occulator were initially disaggregated. The occulator was then operated at a
constant shear stress for about 2 hr. During this time, the sediments occulated, with
the median particle size initially increasing with time and then approaching a steady
state in which the median particle size remained approximately constant with time.
For the conditions in these experiments, this generally occurred in times of less than
2 hr. After this, the shear stress of the occulator was changed to a new value and
kept there for another 2 hr. Again, after an initial transient of less than 2 hr, a new
steady state was reached. The initial shears were 100, 200, and 400/s and these were
changed to 200, 400, and 100/s, respectively. For each shear, the experiments were
run at sediment concentrations of 50, 100, 400, and 800 mg/L.
For fresh water and a sediment concentration of 100 mg/L, the median particle
diameters as a function of time are shown in Figure 4.5. The initial diameters were
about 4 µm. For each shear, the particle size initially increased relatively slowly.
After about 15 minutes, the size increased more rapidly but then approached a steady
state in about an hour. After the change in shear stress, a transient occurred, after
which a new steady state was reached. For a particular shear stress, the median par-
ticle size for the second steady state is approximately the same as the median particle
size after the rst steady state. These results, along with results of other experiments
of this type, indicate that the steady-state median particle size for a particular shear
is independent of the manner in which the steady state is approached.
From Figure 4.5 it can be seen that both the steady-state oc size and the time
to steady state decrease as the shear increases. From observations of the ocs as
well as measurements of settling speeds (see Section 4.3), it can be shown that the
ocs formed at the lower shears are ufer, more fragile, and have lower effective
densities than do the ocs formed at the higher shears. The steady-state size dis-
tribution for each shear is shown in Figure 4.6.
© 2009 by Taylor & Francis Group, LLC
Flocculation, Settling, Deposition, and Consolidation 111
0
0
20
40
60
80
100
120
100 200
Time (min)
Median Floc Diameter (µm)
Stress change
100 s
–1
100 s
–1
200 s
–1
200 s
–1
400 s
–1
400 s
–1
FIGURE 4.5 Median oc diameter as a function of time for a sediment concentration
of 100 mg/L and different uid shears. Detroit River sediments in fresh water. Fluid
shears were changed at times marked by an . (Source: From Tsai et al., 1987. With
permission.)
0 10 100
0
10
20
30
100 s
–1
200 s
–1
400 s
–1
Floc Diameter (µm)
Percent by Volume
FIGURE 4.6 Steady-state oc size distribution for a sediment concentration of 100 mg/L
and different uid shears. Fresh water. (Source: From Tsai et al., 1987. With permission.)
© 2009 by Taylor & Francis Group, LLC
112 Sediment and Contaminant Transport in Surface Waters
In most experiments, single shear stress tests were done rather than dou-
ble shear stress tests. To illustrate the effects of sediment concentration on
occulation, results for single shear tests in fresh water, a uid shear of 200/s,
and sediment concentrations of 50, 100, 400, and 800 mg/L are shown in Fig-
ure 4.7. For other shears and sediment concentrations, the results are similar and
demonstrate that, as the sediment concentration increases, both the steady-state
oc diameter and the time to steady state decrease. This dependence on sedi-
ment concentration is qualitatively the same as the dependence on uid shear
(compare Figures 4.5 and 4.7).
Tests similar to those described above were done with the same sediments in
sea water. The sediment concentrations ranged from 10 to 800 mg/L and the shears
varied from 100 to 600/s. Results of one set of experiments at an applied shear of
200/s and different sediment concentrations are shown in Figure 4.8. In general,
as for fresh water, an increase in uid shear and sediment concentration causes a
decrease in the steady-state oc size and a decrease in the time to steady state.
For tests with a 50/50 mixture of fresh water and sea water (Burban et al.,
1989), results for the steady-state oc size and the time to steady state were
approximately the average of those for fresh water and sea water. This indicates
that these quantities in estuarine waters of arbitrary salinity between that of fresh
water and sea water are approximately weighted averages of these same quantities
for fresh and sea waters.
0
0
20
40
60
80
100
120
100 15050
Time (min)
Median Floc Diameter (µm)
50 mg/L
100 mg/L
400 mg/L
800 mg/L
FIGURE 4.7 Median oc diameter as a function of time for a uid shear of 200/s and differ-
ent sediment concentrations. Fresh water. (Source: From Tsai et al., 1987. With permission.)
© 2009 by Taylor & Francis Group, LLC
Flocculation, Settling, Deposition, and Consolidation 113
For a more general investigation of the effects of salinity (ionic strength),
occulation tests also were performed for the same sediment in sea water, fresh
water, and de-ionized water (Lick and Huang, 1993). Results are shown in Fig-
ure 4.9. For all tests, the applied shear and concentration were identical. The
ionic strength is greatest for the sea water, less for fresh water, and least for
de-ionized water. As the ionic strength increases, the particles aggregate more
rapidly, whereas the steady-state oc size decreases. The more rapid aggregation
as the ionic strength increases is consistent with the VODL theory described in
Section 4.1 (see Figure 4.3). However, VODL theory does not assist in describing
steady-state conditions or the approach to steady state. From Figure 4.9 as well
as from a comparison of Figures 4.7 and 4.8, it can be seen that the steady-state
oc sizes are somewhat greater for fresh water than for sea water, but the differ-
ences are not large. All these results are consistent with the experimental results
described above.
From these gures as well as other data, it can be demonstrated that (1) changes
(e.g., increases) in sediment concentration, uid shear, or salinity have similar
qualitative effects on the steady-state median oc size and the time to steady state,
and (2) the effects of sediment concentration and uid shear can be approximately
quantied in terms of the product of the sediment concentration and uid shear.
0
0
40
80
120
160
200
40 80 100
10 mg/L
50 mg/L
100 mg/L
400 mg/L
800 mg/L
Time (min)
Median Floc Diameter (µm)
FIGURE 4.8 Median oc diameter as a function of time for a uid shear of 200/s and differ-
ent sediment concentrations. Sea water. (Source: From Burban et al., 1989. With permission.)
© 2009 by Taylor & Francis Group, LLC
114 Sediment and Contaminant Transport in Surface Waters
As an example of this last statement, for Detroit River sediments in fresh water,
the data for the steady-state median diameter can be approximated as
d
s
=9.0(CG)
−0.56
(4.5)
where d
s
is in micrometers, C is the sediment concentration (g/cm
3
), and G is the
uid shear (s
−1
). For these same sediments in sea water, the steady-state median
diameter can be approximated as
d
s
=10.5(CG)
−0.40
(4.6)
These results are shown in Figure 4.10.
A time to steady state, T
s
, can be dened as the time for the median oc
diameter to reach 90% of its steady-state value. Consistent with the idea that d
s
is a function of the product of CG, it can also be conjectured that T
s
is a function
of CG. This is demonstrated in Figure 4.11, where T
s
(in minutes) is plotted as a
function of CG for both fresh and sea waters. In this case, the experimental data
can be approximated by
T
s
= 12.2(CG)
−0.36
(4.7)
T
s
=4.95(CG)
−0.44
(4.8)
for fresh water and sea water, respectively.
100
50
10
5
3
0 50 100
De-ionized
Water
Sea Water
Floc Diameter (µm)
Time (minutes)
Fresh
Water
FIGURE 4.9 Median oc diameter as a function of time for a uid shear of 400/s and a
sediment concentration of 100 mg/L. Experiments in sea water, fresh water, and de-ionized
water. (Source: From Lick and Huang, 1993. With permission.)
© 2009 by Taylor & Francis Group, LLC
Flocculation, Settling, Deposition, and Consolidation 115
Figures 4.7 and 4.8 show that the curves for d
s
(t) are similar in shape. This
fact and the above relations suggest that the median diameter as a function of time
can be described by the self-similarity relation,
d
d
f
t
T
ss
¤
¦
¥
³
µ
´
(4.9)
10
–2
10
–1
1.010
–3
10
100
1000
d
s
(
µm
)
Fresh Water
d
s
=
9.0
(
CG
)
–0.56
Sea Water
d
s
= 10.5 (CG)
–0.4
gm
______
cm
3.
s
CG
( )
FIGURE 4.10 Steady-state median oc diameter as a function of the product of sedi-
ment concentration and uid shear, CG, for both fresh water and sea water. (Source: From
Lick et al., 1993. With permission.)
FIGURE 4.11 Time to steady state as a function of the product of sediment concentra-
tion and uid shear, CG, for both fresh water and sea water. (Source: From Lick et al.,
1993. With permission.)
© 2009 by Taylor & Francis Group, LLC
10
–2
10
–1
1.010
–3
10
100
1000
T
s
(min)
Fresh Water
T
s
=
12.2
(
CG
)
–0.36
Sea Water
T
s
= 4.65 (CG)
–0.44
gm
______
cm
3
.
s
CG
( )
116 Sediment and Contaminant Transport in Surface Waters
From the experimental data, this relation can be shown to be approximately valid
for all values of uid shear and sediment concentration for this sediment.
4.2.2 FLOCCULATION DUE TO DIFFERENTIAL SETTLING
As the uid shear applied to ocs decreases, the frequency of collisions between
ocs due to uid shear also decreases. As this occurs, the sizes of the ocs, the
settling speeds of the ocs, and hence the frequency of collisions due to differen-
tial settling will all increase. As a result, the primary mechanism for particles to
collide then becomes differential settling rather than uid shear.
To study the effects of differential settling on the occulation of ne-grained
sediments in the absence of uid shear, disk occulators have been designed,
constructed, and used (Lick et al., 1993). Two of these occulators are shown in
Figure 4.12. The diameters of the small and large disks are 0.3 and 1.0 m, respec-
tively, whereas the widths are 2.8 cm and 3.5 cm, respectively. The small disk is
rotated by rollers, whereas the large disk is rotated by gears that connect the axis
of the disk to a motor. Most experiments were done in the small disk; the large
disk was primarily used for experiments at low sediment concentrations. For the
same conditions, tests in both disks were consistent with each other.
To initiate the experiments, the sediments were disaggregated and then, at a
specied concentration, introduced into a disk. This disk was then slowly acceler-
ated until it rotated at a constant rate. After an initial transient of less than 2 min
(during which time uid shear is present but is very small), the uid in the disk
thereafter rotates as a solid body, and hence no applied uid shear is present. The
particles settle in the water, aggregate with time due to differential settling, and
form ocs. Because of the rotation, the ocs stay in suspension. The rotation rate
(approximately 2 rpm) (1) is fast enough that only a very small fraction of the
ocs settle onto the walls during any rotation period, and (2) is slow enough that
centrifugal forces are negligible.
FIGURE 4.12 Schematic of disk occulators. (Source: From Lick et al., 1993. With
permission.)
© 2009 by Taylor & Francis Group, LLC
Flocculation, Settling, Deposition, and Consolidation 117
Floc sizes were measured at various time intervals by withdrawing a sample
from the disk and then inserting this sample into a Malvern particle sizer. This
procedure was only possible for oc median diameters approximately equal to
or less than 200 µm. The reasons for this are that (1) the Malvern particle sizer
used at that time could only measure oc diameters up to 500 µm and, when an
appreciable fraction of the oc diameters became greater than that, this usually
corresponded to a median diameter of about 200 µm; (2) despite great care, oc
breakage during sampling became severe for the large fragile ocs; and (3) the
large ocs settled very rapidly and were difcult to capture. For these reasons,
the size measurements using the Malvern particle sizer were generally limited to
median diameters approximately equal to or less than 200 µm.
As the median oc size increased beyond this, measurements of oc size
were made from photographs of the sediment suspension. The oc size distri-
butions were determined from these photographs, and oc median sizes were
then calculated. For oc diameters approximately equal to 200 µm, good agree-
ment between the Malvern and the photographic technique was obtained. At low
concentrations, the determination of the oc median size became problematic
because of the small number of large ocs present in a disk (sometimes only one
or two in the entire disk).
Tests were done for Detroit River sediments in both fresh and sea waters at
solids concentrations of 1, 2, 5, 10, 25, 50, 100, and 200 mg/L. For fresh water
and for concentrations of 50, 100, and 200 mg/L, the results for the median diam-
eters as a function of time are shown in Figure 4.13. The general character of the
variation of median diameter with time is the same as for the Couette occulator
tests where uid shear is dominant. That is, there is an initial time period during
which the median diameter of the ocs is small and changes relatively slowly. As
the ocs increase in size, the collision rate increases, and the median size changes
0 102030 40
0
100
200
300
400
500
600
200 mg/L
100 mg/L
50 mg/L
Time (hr)
d
m
(µm)
FIGURE 4.13 Median oc diameter as a function of time in fresh water during settling
at different concentrations. (Source: From Lick et al., 1993. With permission.)
© 2009 by Taylor & Francis Group, LLC
118 Sediment and Contaminant Transport in Surface Waters
more rapidly. Still later, as the concentration of large ocs increases, disaggrega-
tion becomes more signicant. A steady state is then approached where the rate of
disaggregation is equal to the rate of aggregation. For other sediment concentra-
tions, the variations of median diameter with time were similar in character.
In the experiments, a steady state was reached in all cases. The steady-state
median oc size and the time to steady state depend on the concentration and
are shown as functions of concentration in Figures 4.14 and 4.15. Both d
s
and T
s
decrease as the concentration increases. For fresh water, at the lowest concentra-
tion of 2 mg/L, the median diameter is about 2 cm, and the time to reach steady
state has increased to about 25 days. From Figures 4.14 and 4.15, it can be seen
that both log d
s
and log T
s
are linear functions of log C; that is, both d
s
and T
s
are
proportional to a power of C. These relations are shown in the gures.
From the above data, it can be seen that d
s
and T
s
are much greater in the dif-
ferential settling tests than in the uid shear tests. The reason for the slower rate of
occulation is that, in the absence of an applied shear, the collision rate between
small particles is relatively small.
The transition in effects between situations when uid shear is dominant and
when differential settling is dominant is of signicance. To investigate this, the
uid shear experiments of Burban et al. (1989) at a concentration of 100 mg/L and
uid shears of 100, 200, and 400/s were extended to lower shears of 50, 25, and
10/s (Lick et al., 1993). These results, along with the differential settling results
(G = 0) and the previous results of Burban et al. (all at 100 mg/L), are shown in
Figure 4.16. As the applied uid shear approaches zero, the oc size increases
10
100
1
0.1
1.0
10
d
s
(mm)
Fresh water
Sea water
1000
Sea Water
d
s
= 10C
–0.7
Fresh Water
d
s
= 20C
–0.85
Concentration (mg/L)
FIGURE 4.14 Steady-state median oc diameter during settling as a function of sedi-
ment concentration for fresh water and sea water. (Source: From Lick et al., 1993. With
permission.)
© 2009 by Taylor & Francis Group, LLC
Flocculation, Settling, Deposition, and Consolidation 119
rapidly. However, there is a smooth transition in d
s
from the uid-shear-dominated
region to the region where differential settling is dominant.
To investigate the effects on occulation of organic matter contained in or on
the particles, experiments were done in the disk occulators using Detroit River
sediments with the organic matter removed and then comparing these results with
FIGURE 4.15 Time to steady state for oc during settling as a function of sediment con-
centration for fresh water and sea water. (Source: From Lick et al., 1993. With permission.)
0 200 400
10
100
1000
G (s
–1
)
d
s
(µm)
FIGURE 4.16 Steady-state median oc diameter at a concentration of 100 mg/L as a
function of shear for fresh water. (Source: From Lick et al., 1993. With permission.)
© 2009 by Taylor & Francis Group, LLC
110100 1000
1.0
10
100
T
s
(hours)
Sea Water
T
s
= 200 C
–0.85
Fresh Water
T
s
= 1.2 × 10
3
C
–1
Concentration (mg/L)
120 Sediment and Contaminant Transport in Surface Waters
the above results where organic matter (approximately 2%) was naturally present
(Lick et al., 1993). It was demonstrated that the removal of organic matter causes
the steady-state median diameters and the times to steady state to decrease. The
effect is not large at the higher sediment concentrations but becomes more signi-
cant as the concentration decreases. As with erosion rates (Section 3.3), this effect
is consistent with the general concept that the presence of organic matter causes
sediments to behave in a more cohesive manner.
4.3 SETTLING SPEEDS OF FLOCS
For small spherical particles with known density, the settling speed and diameter
are related by Stokes law. However, most aggregated particles are not spherical;
more than that, the average density of a oc is less, often much less, than the solid
particles in the oc and depends on parameters such as the uid shear, sediment
concentration, salinity of the water, and properties of the particle (e.g., particle size,
mineralogy, and organic content). In addition, the ow eld is modied due to ow
through the oc as well as around the oc. For these reasons, the settling speed of a
occulated particle is not related to oc diameter as in Stokes law and, in fact, may
not even have a unique relation to the diameter, as will be shown below.
Settling speeds of ocs have been measured for both fresh water and sea
water as a function of uid shear and sediment concentration (Burban et al., 1990;
Lick et al., 1993); some of these results are shown here. These speeds were often
quite small, on the order of 10
−2
cm/s or less. Because of this, great care was taken
in these experiments to eliminate thermally driven currents and vibrations and,
hence, to measure the settling speeds accurately. Measurements of settling speeds
were made in a carefully insulated square tube approximately 1 m long and 10 cm
wide. The tube was insulated with styrofoam on all sides, top, and bottom and
kept away from windows and drafts. Experiments were usually performed in the
late afternoon and evening when the air temperature was about 20°C and rela-
tively constant. To reduce vibrations and the associated convective instabilities,
the settling tube and camera/microscope assembly used to observe the ocs were
both rigidly mounted on the concrete oor and kept separate from each other. A
pipette was used to introduce the sample from the occulator into the settling
tube. The ocs then settled in the tube. After a short initial transient, their speeds
were essentially constant. The settling speed of a oc was determined by measur-
ing the distance between two successively observed positions of the oc and then
dividing by the time interval between observations.
4.3.1 FLOCS PRODUCED IN A COUETTE FLOCCULATOR
For sediments from the Detroit River, the settling speeds of ocs produced in a
Couette occulator at different applied uid shears, sediment concentrations, and
salinities were measured by Burban et al. (1990). Typical results are shown in Fig-
ure 4.17 (fresh water, a sediment concentration of 100 mg/L, and applied shears
© 2009 by Taylor & Francis Group, LLC
Flocculation, Settling, Deposition, and Consolidation 121
of 100, 200, and 400/s). For each concentration and uid shear, the data can be
approximated by the equation (solid line)
w
s
=a d
m
(4.10)
where a and m are parameters that depend on the uid shear and sediment con-
centration. From measurements such as this, it was shown that the settling speeds
of ocs depended on the conditions in which they were produced. For the same
diameter, ocs produced at higher uid shears and sediment concentrations gen-
erally have higher settling speeds (and hence oc densities) than do ocs pro-
duced at lower uid shears and sediment concentrations.
The dependencies of the settling speeds of ocs on uid shear and sediment
concentration are qualitatively the same in both fresh and sea waters. For the
same uid shear, sediment concentration, and oc diameter, the settling speeds of
ocs in sea water are somewhat greater than the settling speeds of ocs in fresh
water, but generally by no more than 50%. However, the median diameter of a oc
is a function of CG; for the same CG, the median diameter for ocs in fresh water
is greater than that for ocs in sea water (Figure 4.10). Because of this effect, the
settling speeds of the median-diameter ocs in fresh water are somewhat greater
than those of the median-diameter ocs in sea water. As a rst crude approxima-
tion, the settling speeds of ocs formed under the same conditions are about the
same in both fresh and sea waters.
The fact that settling speeds of ocs in both fresh and sea waters are very
similar, together with the fact that ocs are only a little smaller in sea water
than in fresh water (Burban et al., 1989), is further evidence that the dependence
of occulation on salinity is unlikely as a cause in the formation of a turbidity
10
1
10
2
10
3
Floc Diameter (µm)
400 s
–1
200 s
–1
100 s
–1
10
–3
10
–2
10
–1
Settling Speed (cm/s)
FIGURE 4.17 Floc settling speeds as a function of diameter for a sediment concentration of
100 mg/L and different uid shears. (Source: From Burban et al., 1990. With permission.)
© 2009 by Taylor & Francis Group, LLC
122 Sediment and Contaminant Transport in Surface Waters
maximum in estuaries; see Eisma (1986) for a similar conclusion. Of much more
importance in causing changes in occulation in an estuary are the changes in
shear stress (turbulence) and sediment concentration, both generally decreasing
as the ocs are transported from the river out into the estuary. However, the net
effect of the changes in these parameters on settling speeds is difcult to deter-
mine a priori without knowing specic values of these parameters. To be specic
and to illustrate the maximum change in settling speed within the present range
of parameters, consider the changes in oc size and settling speed as conditions
change in an estuary from (1) fresh water, a uid shear of 400/s, and a sediment
concentration of 400 mg/L, to (2) sea water, a uid shear of 100/s, and a sediment
concentration of 10 mg/L. From the above data and from Burban et al. (1989,
1990), it follows that for (1), the median oc diameter is 20 µm and the corre-
sponding settling speed is 9 × 10
−3
cm/s, whereas for (2), the median oc diameter
is 172 µm and the settling speed is 5 × 10
−3
cm/s. It can be seen that although the
oc size changes considerably, the change in settling speed is relatively small.
This example indicates that changes in the settling speeds of ocs as they are
modied and transported through an estuary are rather small. Of more impor-
tance than occulation in causing the observed turbidity maximum in estuaries
are the hydrodynamics of the stratied ow caused by the intrusion of sea water
and the fresh water owing over the resulting sea water wedge. This is discussed
in Section 6.6.
4.3.2 FLOCS PRODUCED IN A DISK FLOCCULATOR
The settling speeds of ocs produced in disk occulators also have been measured
(Lick et al., 1993). The sediments were from the Detroit River. In the experiments,
sediment concentration and salinity were varied as parameters. For oc diameters
less than 1 mm, the same measurement techniques as described above were used.
Flocs larger than 1 mm were quite fragile and were very difcult to capture and
measure. These large ocs were only present at small sediment concentrations,
and only a few of them were present at any one time. They generally moved inde-
pendently of one another and seldom collided with each other or with the wall
of the disk. For these ocs, an alternate procedure for measuring their settling
speeds was used, and was as follows. A oc in a rotating disk can be observed to
move in an almost circular orbit whose radius varies slowly with time but whose
center is displaced by a constant distance r
o
from the center of the disk. In this
situation, it has been demonstrated (Tooby et al., 1977) that the settling speed w
s
of an isolated particle in a rotating disk is given by
w
s
= Xr
o
(4.11)
where X is the rotation rate of the disk. For ocs less than 1 mm in diameter, com-
parisons between w
s
from this relation and measurements of w
s
in a settling tube
were made; good agreement between the two was obtained. For ocs greater than
1 mm, settling speeds were therefore calculated from Equation 4.11. For these
© 2009 by Taylor & Francis Group, LLC
Flocculation, Settling, Deposition, and Consolidation 123
ocs, their orbiting motion could be readily observed, and the center of the orbit
and hence r
0
could then be readily determined.
For fresh water, the results are shown in Figure 4.18(a). For ocs less than 1
mm in diameter (all of which were produced at 50, 100, and 200 mg/L), the data
can be reasonably approximated by
w
s
=ad
m
= 0.268 d
1.56
(4.12)
For these ocs, there was no signicant effect of sediment concentration on the
settling speeds. The effect is probably small and, for this narrow range of concen-
trations, is probably masked by the experimental scatter. For ocs larger than 1
mm (which were produced at 2, 5, and 10 mg/L), the settling speeds fall below the
line given by Equation 4.12. Reasons for this may be that (1) the ocs have not yet
reached their steady-state density; and (2) for these ocs, the Reynolds numbers
are from 10 to 100 and therefore signicantly greater than the limiting Reynolds
number for Stokes ow of about 0.5; this decreases the settling speed below that
for laminar ow around the oc (Figure 2.5).
By comparison of Figure 4.18(a) with Figure 4.17, it can be seen that the set-
tling speeds of ocs produced by differential settling are signicantly greater
w
s
= 0.268d
1.56
10
2
10
2
10
3
10
3
10
10
4
10
4
Floc Diameter d (µm)
5
10
50
100
200
Settling Speed w
s
(µm/s)
Concentration (mg/L)
FIGURE 4.18(a) Settling speeds of ocs formed by settling at different concentrations:
fresh water. (Source: From Lick et al., 1993. With permission.)
© 2009 by Taylor & Francis Group, LLC
124 Sediment and Contaminant Transport in Surface Waters
than the settling speeds of ocs produced by uid shear. This is primarily due to
the larger sizes of the ocs produced by settling. However, it also can be seen that
the dependence of w
s
on d is quite different, with the slope of log w
s
for the set-
tling experiments (m = 1.56) being signicantly greater than the slopes of log w
s
for the shear experiments (the values of m were between 0.25 and 1.0, depended
on sediment concentration and uid shear, but had an average value of about 0.6).
For the same diameter, the settling speed of a oc produced by differential set-
tling is greater than that for a oc produced by uid shear.
For sea water, the results for settling speeds are shown in Figure 4.18(b). The
same general trends as for fresh water are evident. For ocs less than 1 mm in
diameter, the data can be approximated by
w
s
=0.145 d
1.58
(4.13)
For ocs greater than 1 mm (which were produced at 1, 2, and 5 mg/L), the set-
tling speeds fall below this line, as for fresh water. From Figures 4.18(a) and (b), it
can be seen that, for the same diameter, the settling speeds of ocs in fresh water
are somewhat greater than those of ocs in sea water, but not by much.
An effective density for settling can be dened from Stokes law as
1
2
5
50
100
200
Concentration (mg/L)
w
s
= 0.145d
1.58
10
2
10
2
10
3
10
3
10
10
4
10
4
Floc Diameter d (µm)
Settling Speed w
s
(µm/s)
FIGURE 4.18(b) Settling speeds of ocs formed by settling at different concentrations:
sea water. (Source: From Lick et al., 1993. With permission.)
© 2009 by Taylor & Francis Group, LLC
Flocculation, Settling, Deposition, and Consolidation 125
$
RR R
M
M
fw s
m
gd
w
a
g
d
18
18
2
2
(4.14)
Because m is less than 2, this demonstrates the decrease in density of a oc as the
diameter of the oc increases.
4.3.3 AN APPROXIMATE AND UNIFORMLY VALID EQUATION
FOR THE
SETTLING SPEED OF A FLOC
The above results were for the settling speed as a function of diameter for all
ocs produced (not just median-size ocs) and measured in steady-state condi-
tions at a specied shear and sediment concentration. In Section 4.2 (Figure 4.10
as an example), data for the steady-state median sizes of ocs as a function of
CG were presented. By combining these results, one can then determine settling
speeds of median steady-state ocs at specied shears and sediment concentra-
tions. As an example, for Detroit River sediments in fresh water and a sediment
concentration of 100 mg/L, the settling speed of the median steady-state oc is
shown as a function of shear in Figure 4.19. As the uid shear increases from
0 200 400
10
100
1000
G (s
–1
)
w
s
(d
m
) (µm/s)
FIGURE 4.19 Settling speeds of steady-state median diameter oc produced at a con-
centration of 100 mg/L as a function of shear.
© 2009 by Taylor & Francis Group, LLC
126 Sediment and Contaminant Transport in Surface Waters
zero, the settling speed rst decreases rapidly and then increases slowly. Similar
curves are obtained for different sediment concentrations. For different sediment
concentrations, the curves of w
s
(d) are similar in shape, and w
s
(d) decreases in
magnitude as the sediment concentration decreases.
In general, the settling speed of the steady-state median size oc is a func-
tion of the diameter of the oc but also depends on the uid shear and sediment
concentration, with the dependence on concentration being least. Because the
diameter of the oc is also a function of C and G, all three parameters (d, C, and
G) are not independent; only two of the three are independent. As a result, the
settling speed can be written as w
s
(d, C), w
s
(d, G), or w
s
(C, G). For convenience,
the settling speed will here be approximated as w
s
(d, G).
The available data on settling speeds, and especially the conditions under
which they were produced, are rather meager. On the basis of the data by Burban
et al. (1990) and Lick et al. (1993) and as a rst approximation, the following
equation for w
s
is suggested:
ww wwe
s
cG
cc
()
0
(4.15)
ww d
G
s0
0
156
268
l
lim .
.
(4.16)
where w
e
= 80 µm/s and c = 0.04 s. The above equations are approximate but are
consistent with the data shown in Figures 4.17, 4.18(a), and 4.19 for ocs in fresh
water. An analogous formula can be determined for ocs in sea water; the appro-
priate parameters are now w
0
=0.145d
1.58
, w
e
= 60 µm/s, and c = 0.04 s.
4.4 MODELS OF FLOCCULATION
4.4.1 G
ENERAL FORMULATION AND MODEL
Experimental results demonstrate that the formation of ocs is a dynamic process,
with the oc size distribution at any particular time determined by the rates at
which individual ocs aggregate and disaggregate. In general, these rates are not
equal so that the median size of the ocs either increases or decreases, depending
on whether aggregation or disaggregation is dominant. The steady state is deter-
mined as a dynamic equilibrium between aggregation and disaggregation.
The rate of aggregation depends on the rate at which collisions occur and on
the probability of cohesion after collision; the rate of disaggregation depends on
collisions between particles, on uid shear, and on the probability of disaggrega-
tion due to collisions. A quite general formula for the time rate of change of the
particle size distribution that includes the above mechanisms can be written as
follows. Denote the number of particles per unit volume in size range k by n
k
. The
time rate of change of n
k
is then given by (Lick and Lick, 1988)
© 2009 by Taylor & Francis Group, LLC
Flocculation, Settling, Deposition, and Consolidation 127
dn
dt
Annn A n
B
k
ij ij i j k ik ik i
iijk
k
c
££
1
2
1
BB
nnBn
nCn nCn
kjkjj
jk
kikiki jkjijiji
c
£
G
BGB
1
iijki
c
c
c
£££
111
(4.17)
The rst term on the right-hand side of the above equation is the rate of forma-
tion of ocs of size k by cohesive collisions between particles of size i and j. The
second term represents the loss of ocs of size k due to cohesive collisions with
all other particles. Binary collisions have been assumed. The quantities A
ij
are the
probabilities of cohesion of particles i and j after collision. They depend on the
properties of the particles in a oc, cannot be determined at present on the basis
of theoretical arguments, but can be approximated from experimental results. The
quantities C
ij
are the collision frequency functions for collisions between particles
i and j and depend on the collision mechanisms of Brownian motion, uid shear,
and differential settling (Section 4.1).
The third term on the right-hand size of Equation 4.17 represents the loss of
ocs of size k due to disaggregation by uid shear, and the fourth term represents
the gain of ocs of size k due to the disaggregation of ocs of size j > k due to
shear. In general, the coefcient B
k
should be a function of the uid shear, oc
diameter, and effective density of the oc, as well as depend on the particular sed-
iment. Numerous analyses (Matsuo and Unno, 1981; Parker, 1982; Clark, 1982;
Hunt, 1984) have attempted to determine this quantity from basic theoretical con-
siderations. However, this quantity is still not well understood or quantied. The
quantity H
jk
is the probability that a particle of size k will be formed after the
disaggregation of a particle of size j. Its value depends on the manner of breakup
of the particle of size j, many of which are possible. If it is assumed that each oc
can break up into two smaller ocs of size i and j such that i+j=k and that there
is no preferred mode of breakup, then
G
jk
j
2
1
(4.18)
The second-to-last term on the right-hand side of Equation 4.17 represents the
disaggregation of ocs of size k due to collisions with all other particles. The last
term represents the gain of ocs of size k after disaggregation due to collisions
between all particles i and j, where j is greater than k. Binary collisions have been
assumed. The quantity C
ik
is the probability of disaggregation of a particle of size
k after collision with a particle of size i.
© 2009 by Taylor & Francis Group, LLC