Sediment and Contaminant Transport in Surface Waters - Chapter 6 potx
Bạn đang xem bản rút gọn của tài liệu. Xem và tải ngay bản đầy đủ của tài liệu tại đây (2.98 MB, 64 trang )
215
6
Modeling Sediment
Transport
In previous chapters, many of the basic and most signicant sediment transport
processes were discussed. In the present chapter, these ideas are applied to the
modeling of sediment transport. In Section 6.1, a brief but general overview of
sediment transport models is given. In Section 6.2, transport as suspended load
and/or bedload is discussed with the purpose of describing a unied approach
for modeling erosion. Simple applications of sediment transport models are then
described in Section 6.3. More complex applications of sediment transport mod-
els to rivers, lakes, and estuaries are presented in Sections 6.4 through 6.6; the
purpose is to illustrate some of the signicant and interesting characteristics of
sediment transport in different types of surface water systems as well as to illus-
trate the capabilities and limitations of different models.
6.1 OVERVIEW OF MODELS
Numerous models of sediment transport exist. They differ in (1) the number
of space and time dimensions used to describe the transport and (2) how they
describe and quantify various processes and quantities that are thought to be sig-
nicant in affecting transport. Some of the processes and quantities that may be
signicant include (1) erosion rates, (2) particle/oc size distributions (i.e., the
number of sediment size classes), (3) settling speeds, (4) deposition rates, (5) oc-
culation of particles, (6) bed consolidation, (7) erosion into suspended load and/
or bedload, and (8) bed armoring. In practice, most sediment transport models
do not include accurate descriptions of all of these processes. The nal choice
of space and time dimensions, what processes to include in a model, and how to
approximate the processes that are included is a compromise between the signi-
cance of each process; an understanding of and ability to quantify each process;
the desired accuracy of the solution; the data available for process description,
for specication of boundary and initial conditions, and for verication; and the
amount of computation required.
6.1.1 DIMENSIONS
In the modeling of sediment transport, it is necessary to describe the transport
of sediments in the overlying water as well as the dynamics (erosion, deposition,
consolidation) of the sediment bed. In reality and for generality, these descriptions
© 2009 by Taylor & Francis Group, LLC
216 Sediment and Contaminant Transport in Surface Waters
should be three-dimensional in space as well as time dependent. However, if this
is done, the resulting models are quite complex and computer intensive and some-
times may be unnecessary. Simpler models can be obtained by reducing the number
of space dimensions and sometimes by assuming a steady state.
For the problems considered here, two or three space dimensions as well as
time dependence are generally necessary. Because of this, steady-state and one-
dimensional models will not be considered. For the transport of sediments in the
overlying water, it will be shown later in this chapter that, in many cases, two-
dimensional, vertically integrated transport models give results that are almost
identical to three-dimensional models and are therefore often sufcient to accu-
rately describe sediment transport. For the most complex problems, three-dimen-
sional, time-dependent transport models are necessary.
In many models, erosion and deposition are described by simple parameters
that are constant in space and time. A model of sediment bed dynamics is then not
necessary. However, as emphasized in Chapter 3, erosion rates are highly vari-
able in the horizontal direction, in the vertical direction (depth in the sediment),
and with time (due to changes in sediment properties caused by erosion, deposi-
tion, and consolidation). Because of this and for quantitative predictions, a three-
dimensional, time-dependent model of sediment bed properties and dynamics is
usually necessary.
6.1.2 QUANTITIES THAT SIGNIFICANTLY AFFECT SEDIMENT TRANSPORT
6.1.2.1 Erosion Rates
Because erosion is a fundamental process that dominates sediment transport and
because of its high variability in space and time, it is essential to understand
quantitatively and be able to predict this quantity throughout a system as a func-
tion of the applied shear stress and sediment properties. In general, for sediments
throughout a system, erosion rates cannot be determined from theory and must
therefore be determined from laboratory and eld measurements. This was dis-
cussed extensively in Chapter 3.
In models, various approximations to describe erosion rates have been used.
At its simplest, the erosion rate is approximated as a resuspension velocity, v
r
, that
is constant in space and time. This parameter then is estimated by adjusting v
r
until results of the overall transport model agree with eld observations. In this
approximation, v
r
is strictly an empirical parameter, does not reect the physics
of sediment erosion, and has no predictive ability.
A widely used and more justiable approximation for erosion rates is to
assume that
E=a(U – U
c
)(6.1)
where a and U
c
are constants. This is a linear approximation to Equations 3.22
and 3.23. The parameters a and U
c
are usually empirical parameters chosen by
© 2009 by Taylor & Francis Group, LLC
Modeling Sediment Transport 217
parameterization based on comparisons of calculated and measured suspended
sediment concentrations. For small erosion rates or for small changes in erosion
rates, the above equation may be a justiable approximation because, over a small
range, any set of data can be approximated as a straight line. However, the choices
for a and U
c
are crucial, and these parameters should be obtained from laboratory
and eld data — not from model calibration.
In the limit of ne-grained sediments, the amount of erosion for a particular
shear stress is limited so that the concept of an erosion potential, F, is valid (Section
3.1). This amount of erosion occurs over a limited time, T, typically on the order
of an hour, so that an approximate erosion rate can be determined from F/T; after
this time, E = 0 until the shear stress increases. Several sediment transport mod-
els (e.g., SEDZL) have used this concept. However, for real sediments, sediment
properties often change rapidly with depth and time; the SEDZL model does not
include this variability (except for bulk density). Because of this, it is only quanti-
tatively valid for ne-grained sediments that have uniform properties throughout;
however, it will give qualitatively correct results for other types of sediments.
When sediment properties change rapidly and in a nonuniform manner in
time and space (which is most of the time), the most accurate procedure for deter-
mining erosion rates is by using Sedume for existing in situ sediments and a
combination of laboratory tests with Sedume and consolidation and bed armor-
ing theories to predict the erosion rates of recently deposited sediments as they
consolidate with time. Equation 3.23 can then be used to approximate the erosion
rates as a function of shear stress. The use of Sedume data and space- and time-
variable sediment properties are incorporated into the SEDZLJ transport model.
Although Sedume determines erosion rates as a function of the applied
shear stress, an additional difculty in the modeling of sediment transport is the
accurate determination of the bottom shear stress. As a rst approximation, this
stress is the same as the shear stress used in the modeling of the hydrodynam-
ics (Section 5.1). However, as stated there, the hydrodynamic shear stress is due
to frictional drag and form drag. Only the former is thought to contribute to the
shear stress causing sediment resuspension. This distinction between friction and
form drag is signicant when sand dunes are present, and the two stresses then
can be determined independently. For ne-grained, cohesive sediments, dunes
and ripples tend not to be present, form drag is thought to be negligible, and the
total drag is essentially the same as frictional drag.
6.1.2.2 Particle/Floc Size Distributions
In Chapter 2, it was emphasized that large variations in particle sizes typically
exist in real sediments throughout a surface water system, often by two to three
orders of magnitude. However, as an approximation in many sediment transport
models, only one size class is assumed. This is quite often necessary when only
meager data for model input and verication are available or when knowledge
and/or data are insufcient to accurately characterize the transport processes.
© 2009 by Taylor & Francis Group, LLC
218 Sediment and Contaminant Transport in Surface Waters
This assumption also may be reasonable when changes in environmental condi-
tions in space and time are relatively small.
However, this assumption is not valid when there are large variations in envi-
ronmental conditions and/or when occulation is signicant, for example, (1) dur-
ing large storms or oods, (2) when there are large spatial and temporal changes
in ow velocities, or (3) when calculations over long time periods or large spatial
distances are required. For these cases as well as others, several size classes are
necessary for the accurate determination of suspended sediment concentrations
and especially the net and gross amounts of sediment eroded as a function of
space and time. Three size classes are often necessary and sufcient.
6.1.2.3 Settling Speeds
Modelers often state that settling speeds used in their models were obtained from
laboratory and/or eld data. However, as noted in Chapter 2, the values for set-
tling speeds for sediments in a system generally range over several orders of mag-
nitude. The appropriate value to use for an effective settling speed is therefore
difcult to determine or even dene. To illustrate this, the value for the settling
speed determines where and to what extent suspended sediments deposit and
accumulate on the bottom. For settling speeds that differ by an order of magni-
tude, the location where they deposit also will differ by an order of magnitude,
for example, from a few kilometers downstream in a river to tens of kilometers
downstream. Because a wide range of settling speeds is possible depending on the
particle/oc properties and the ow regime, a wide range of settling speeds is also
necessary in a model for a valid approximation to the vertical ux, transport, and
deposition of sediments throughout a system.
In most models, the actual value that is used for the settling speed is deter-
mined by parameterization, that is, by adjusting its value until the calculated and
observed values of suspended sediment concentration agree. As noted previ-
ously in Section 1.2, non-unique solutions can result by use of this procedure. As
another example of this difculty, consider the specication of settling speeds as
illustrated in several texts on water quality modeling (e.g., Thomann and Muel-
ler, 1987; Chapra, 1997). In these texts, the almost universal choice for a settling
speed is 2.5 m/day; this seems to be based on earlier articles by Thomann and
Di Toro (1983) and O’Connor (1988). From Stokes law, this settling speed corre-
sponds to a particle size of about 5 µm. By comparison, median particle sizes for
sediments in the Detroit River, Fox River, and Santa Barbara Slough are 12, 20,
and 35 µm, respectively (Section 2.1), whereas cores from the Kalamazoo River
show median sizes as a function of depth that range from 15 to 340 µm (Section
3.2). For the latter ve values of particle size, the corresponding settling speeds
(from Stokes law) are 11, 31, 95, 18, and 9000 m/day, respectively.
The settling speed of 2.5 m/day was not determined from laboratory or eld
measurements but was estimated based on previous modeling exercises. The cor-
responding particle diameter of 5 µm seems quite low compared to those for
real sediments. It is also somewhat surprising that one settling speed seems to
© 2009 by Taylor & Francis Group, LLC
Modeling Sediment Transport 219
work for a variety of problems. The fact is that a settling speed of 2.5 m/day is
not unique or necessary; that is, a wide range of settling speeds can be used and
will give the observed suspended sediment concentration, as long as the erosion
rate (or equivalent) is modied appropriately, just as is indicated by Equation 1.2.
However, if this is done, as stated in Section 1.2 and summarized by Equation 1.2,
multiple solutions are then possible and a unique solution cannot be determined
from calibration of the model using the suspended solids concentration alone.
The amounts and depths of erosion/deposition will vary, depending on the choice
of settling speed. The depth of erosion/deposition is an important quantity that a
water quality model should be able to predict accurately; it should not depend on
a somewhat arbitrary choice of settling speed.
When three or more size classes are assumed, the average settling speed for
each size class can be used. When three size classes and their average settling
speeds are determined from laboratory and/or eld data, the uncertainty of param-
eterization is substantially decreased. Whenever possible, this should be done.
6.1.2.4 Deposition Rates
Deposition rates and the parameters on which they depend are discussed in Sec-
tion 4.5. Because of limited understanding of this quantity, the rates that are used
in modeling are usually parameterized using Equation 4.61 or a similar equation.
A better approach is suggested in Section 4.5.
6.1.2.5 Flocculation of Particles
In the above sections, the effects of occulation have not been explicitly stated.
However, as described in Chapter 4, occulation can modify oc sizes and settling
speeds by orders of magnitude. Because of this, occulation must be considered
in the accurate modeling of particle/oc size distributions, settling speeds, and
deposition rates when ne-grained sediments are present. The quantitative under-
standing of the occulation of sedimentary particles is relatively new, and the
quantitative determination of many of the parameters necessary for the modeling
of occulation has been done for only a few types of sediments. Because of this,
most sediment transport models do not include occulation. A few exceptions will
be noted in the following. Now that a simple model of occulation is available (see
Section 4.4), variations in oc sizes, settling speeds, and deposition rates due to
occulation now can be efciently included in overall transport models.
6.1.2.6 Consolidation
When coarse-grained particles are deposited, little consolidation occurs and the
bulk density of the sediments is almost independent of space and time. In this case,
erosion rates are dependent only on particle size. However, when ne-grained par-
ticles are deposited, considerable consolidation of the sediments can occur, the bulk
density usually (but not always) increases with depth and time, and the erosion
rate (which is a sensitive function of the bulk density of the sediments, Section 3.3)
© 2009 by Taylor & Francis Group, LLC
220 Sediment and Contaminant Transport in Surface Waters
usually decreases with sediment depth and time. As indicated in Section 4.6, the
presence and generation of gas in the sediments have signicant effects on consoli-
dation and erosion rates but usually are not measured or even considered. Modeling
of consolidation can be done, but the accuracy of this modeling depends on labora-
tory experiments of consolidation (Section 4.6).
6.1.2.7 Erosion into Suspended Load and/or Bedload
Most water quality transport models assume there is suspended load and ignore
bedload. If sediments are primarily coarse, noncohesive sediments, some sedi-
ment transport models consider bedload only. If sediments include both coarse-
grained and ne-grained particles, both suspended load and bedload may be
signicant and need to be considered. This often is done by treating suspended
load and bedload as independent quantities. However, upon deposition, both the
suspended load and bedload can modify the bulk properties and hence the ero-
sion rates of the surcial sediments. This, in turn, affects the suspended load and
bedload; that is, suspended load and bedload are interactive quantities and should
be treated as such. This is discussed in the next section.
6.1.2.8 Bed Armoring
Bed armoring can signicantly affect erosion rates, often by one to two orders of
magnitude. A model of this process is described in the following section, whereas
applications of this model to illustrate some of the characteristics of bed armoring
are given in Sections 6.3 and 6.4.
6.2 TRANSPORT AS SUSPENDED LOAD AND BEDLOAD
6.2.1 S
USPENDED LOAD
The three-dimensional, time-dependent conservation of mass equation for the
transport of suspended sediments in a turbulent ow is
t
t
t
t
t
t
t
t
t
t
t
t
C
t
uC
x
vC
y
wwC
z
x
D
C
x
s
H
() () [( )]
¤¤
¦
¥
³
µ
´
t
t
t
t
¤
¦
¥
³
µ
´
t
t
t
t
¤
¦
¥
³
µ
´
y
D
C
yz
D
C
z
S
Hv
(6.2)
where C is the mass concentration of sediments, t is time, x and y are horizon-
tal coordinates, z is the vertical coordinate (positive upwards), u and v are the
sediment (uid) velocities in the x- and y-directions, w is the uid velocity in
the z-direction, w
s
is the settling speed of the sediment relative to the uid and
is generally positive, D
H
is the horizontal eddy diffusivity, D
v
is the vertical eddy
diffusivity, and S is a source term.
© 2009 by Taylor & Francis Group, LLC
Modeling Sediment Transport 221
In many cases, a two-dimensional, vertically integrated, time-dependent con-
servation equation is sufcient. For this case, vertical integration of the above
equation gives
t
t
t
t
t
t
t
t
t
t
Ô
Ư
Ơ
à
t
t
() () ()hC
t
UC
x
VC
y
D
x
h
C
x
H
yy
h
C
y
Q
t
t
Ô
Ư
Ơ
à
Đ
â
ă
ả
á
ã
(6.3)
where C is now the suspended sediment concentration averaged over depth, h
is the local water depth, U and V are vertically integrated velocities dened by
Equations 5.53 and 5.54, D
H
is assumed constant, and Q is the net ux of sedi-
ments into suspended load from the sediment bed that is, Q is calculated as
erosion ux into suspended load, E
s
, minus the deposition ux from suspended
load, D
s
, or
Q=E
s
D
s
(6.4)
Two-dimensional calculations based on these latter two equations are valid
when the sediments are well mixed in the vertical. When this is not the case, an
additional calculation to approximate the vertical distribution of C is sometimes
made so as to more accurately determine the suspended concentration near the
bed and hence to more accurately determine the deposition rate. This is done by
assuming a quasi-steady, one-dimensional balance between settling and vertical
diffusion. A rst approximation to the vertical distribution of sediments can then
be shown to be
Cz C
wz
D
o
s
v
() exp
Ô
Ư
Ơ
à
(6.5)
where C
o
is the near-bed concentration at z = 0. This equation can be integrated
over the water depth to give a relation between the average suspended sediment
concentration and C
o
. The concentration C
o
then can be determined at any loca-
tion using this relation and C(x,y,t) from Equation 6.3.
When different-size classes are considered, the above equations apply to each
size class; the terms S and Q then must include transformations from one size
class to another, for example, due to occulation or precipitation/dissolution.
6.2.2 BEDLOAD
For the description of bedload transport, many procedures and approximate semi-
empirical equations are available (Meyer-Peter and Muller, 1948; Bagnold, 1956;
Engelund and Hansen, 1967; Van Rijn, 1993; Wu et al., 2000). The procedure
described by Van Rijn (1993) is used here.
The mass balance equation for particles moving in bedload (similar to Equa-
tion 6.3) can be written as
â 2009 by Taylor & Francis Group, LLC
222 Sediment and Contaminant Transport in Surface Waters
t
t
t
t
t
t
hC
t
hq
x
hq
y
Q
bb bbx
bby
b
(6.6)
where C
b
is the sediment concentration in bedload, q
bx
and q
by
are the horizontal
bedload uxes in the x- and y-directions, h
b
is the thickness of the bedload layer,
and Q
b
is the net vertical ux of sediments between the sediment bed and bed-
load. The horizontal bedload ux is calculated as
q
b
=u
b
C
b
(6.7)
where u
b
is the bedload velocity in the direction of interest. The bedload velocity
and thickness can be calculated from the empirical relation
uT gd
bs
§
©
¶
¸
15 1
06
05
.()
.
.
R (6.8)
hddT
b
3
06 09
*
(6.9)
where d
*
is the nondimensional particle diameter dened as d
*
=d[(S
s
−1)g/O
2
]
1/3
,
d is the particle diameter, and S
s
is the density of the sedimentary particle. The
transport parameter, T, is dened as
T
c
c
TT
T
(6.10)
In Equation 6.7, q
b
is the ux (mass/area/time) of sediment in bedload. To
obtain the mass/time of sediment being transported in bedload, q
b
must be multi-
plied by the area of the bedload layer — that is, by h
b
× width of the layer.
The net ux of sediments between the bottom sediments and bedload, Q
b
, is
calculated as the erosion of sediments into bedload, E
b
, minus the deposition of
sediments from bedload, D
b
, and is
Q
b
=E
b
–D
b
(6.11)
where D
b
is given by
D
b
=p w
s
C
b
(6.12)
and p is the probability of deposition.
In steady-state equilibrium, the concentration of sediments in bedload, C
e
, is
due to a dynamic equilibrium between erosion and deposition, that is,
E
b
=p w
s
C
e
(6.13)
© 2009 by Taylor & Francis Group, LLC
Modeling Sediment Transport 223
From this, p can be written as
p
E
wC
b
se
(6.14)
The equilibrium concentration has been investigated by several authors; the for-
mulation by Van Rijn (1993) will be used here and is
C
T
d
e
s
0 117.
*
R
(6.15)
Once E
b
, w
s
, and C
e
are known as functions of particle diameter and shear stress,
p can be calculated from Equation 6.14. It then is assumed that this probability is
also valid for the nonsteady case so that the deposition rate can be calculated in
this case, also. This procedure guarantees that the time-dependent solution will
always tend toward the correct steady-state solution as time increases.
The equilibrium concentration, C
e
, is based on experiments with uniform
sediments. In general, the sediment bed contains, and must be represented by,
more than one size class. In this case, the erosion rate for a particular size class is
given by f
k
E
b
, where f
k
is the fraction by mass of the size class k in the surcial
sediments. It follows that the probability of deposition for size class k is then
given by
p
fE
wfC
E
wC
k
kb
sk k ek
b
sk ek
(6.16)
As in Equation 6.14, it is implicitly assumed in this equation that there is a dynamic
equilibrium between erosion and deposition for each size class k.
6.2.3 EROSION INTO SUSPENDED LOAD AND/OR BEDLOAD
As bottom sediments are eroded, a fraction of these sediments is suspended into
the overlying water and transported as suspended load; the remainder of the
eroded sediments moves by rolling and/or saltation in a thin layer near the bed
— that is, in bedload. The fraction of the eroded sediments going into each of the
transport modes depends on particle size and shear stress.
For ne-grained particles (which are generally cohesive), erosion occurs both
as individual particles and in the form of small aggregates or chunks of particles.
The individual particles generally move as suspended load. The aggregates tend
to move downstream near the bed but generally seem to disintegrate into small
particles in the high-stress boundary layer near the bed as they move downstream.
These disaggregated particles then move as suspended load. This disaggrega-
tion-after-erosion process is not quantitatively understood. For this reason, it is
© 2009 by Taylor & Francis Group, LLC
224 Sediment and Contaminant Transport in Surface Waters
assumed here that ne-grained sediments less than about 200 µm are completely
transported as suspended load.
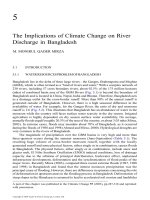
Coarser, noncohesive particles (dened here as those particles with diameters
greater than about 200 µm) can be transported as both suspended load and bed-
load, with the fraction in each dependent on particle diameter and shear stress.
For particles of particular size, the shear stress at which suspended load (or sedi-
ment suspension) is initiated is dened as U
cs
. This shear stress can be calculated
from (Van Rijn, 1993)
T
R
M
R
cs
w
s
w
s
w
d
for d m
wfor
¤
¦
¥
³
µ
´
a
14
400
1
04
2
2
*
(. ) ddm
ª
«
¬
400M
(6.17)
The variation of U
cs
as a function of d is shown in Figure 6.1 and can be compared
there with U
c
(d).
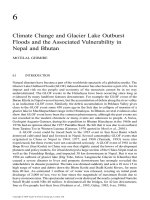
For U > U
cs
, sediments are transported as both bedload and suspended load,
with the fraction of suspended load to total load transport increasing from 0 to 1
as U increases. Guy et al. (1966) have quantitatively demonstrated this by means
of detailed ume measurements of suspended load and bedload transport for sedi-
ments ranging in median diameter, d
50
, from 190 to 930 µm. They found that the
fraction of suspended load transport to total load transport, q
s
/q
t
, increases as the
ratio of shear velocity (dened as u
w*
/TR) to settling velocity increases. This
"
"
"
$
!
#
FIGURE 6.1 Critical shear stresses for erosion and suspension of quartz particles.
© 2009 by Taylor & Francis Group, LLC
Modeling Sediment Transport 225
fraction is shown as a function of u
*
/w
s
in Figure 6.2. Their data can be approxi-
mated by
q
q
for
uw w
s
t
cs
scsws
a
0
4
TT
TRln( / ) ln( / / )
ln( )
*
lln( / / )
*
*
TR
TT
cs w s
cs
s
s
w
for and
u
w
for
u
w
ª
«
4
14
¬
(6.18)
This approximation is shown as a straight line in the gure.
By multiplying the total erosion ux of a particular size class by q
s
/q
t
, the ero-
sion ux of that size class into suspended load, E
s
, can be calculated. The erosion
ux into bedload, E
b
, can be calculated by multiplying the total erosion ux of the
size class by (1 − q
s
/q
t
). Erosion uxes for any size class k can be calculated as
E
q
q
fE
E
q
q
fE
sk
s
t
k
bk
s
t
k
,
,
()
()
¤
¦
¥
³
µ
´
¹
º
»
1
ffor
E
E
for
ck
sk
bk
ck
TT
TT
q
¹
º
»
,
,
,
,
0
0
(6.19)
10
–1
10
0
10
1
u
*
/w
s
q
s
/q
t
0.1
0
0.2
0.3
0.4
0.5
0.6
0.7
0.8
0.9
1.0
FIGURE 6.2 Suspended ux as a fraction of total ux. Straight line is approximation by
Equation 6.18. Data from Guy et al. (1966). (Source: From Jones and Lick, 2001a.)
© 2009 by Taylor & Francis Group, LLC
226 Sediment and Contaminant Transport in Surface Waters
6.2.4 BED ARMORING
A decrease in sediment erosion rates with time can occur due to (1) the consoli-
dation of cohesive sediments with depth and time, (2) the deposition of coarser
sediments on the sediment bed during a ow event, and (3) the erosion of ner
sediments from the surcial sediment, leaving coarser sediments behind, again
during a ow event. As far as the rst process is concerned, the existing in situ
changes in erosion rates with depth can be determined by Sedume measure-
ments from sediment cores. The time-dependent consolidation of sediments and
decrease of erosion rates of sediments after deposition can be determined approx-
imately from laboratory consolidation studies along with theoretical analyses
(Section 4.6).
Here the concern is with bed armoring due to processes (2) and (3). To
describe and model these processes, it is necessary to assume that a thin mix-
ing layer, or active layer, is formed at the surface of the bed. The existence and
properties of this layer have been discussed by several researchers (Borah et al.,
1983; Van Niekerk et al., 1992; Parker et al., 2000). The presence of this active
layer permits the interaction of depositing and eroding sediments to occur in a
discrete layer without the deposited sediments modifying the properties of the
undisturbed sediments below. Van Niekerk et al. (1992) have suggested that the
thickness, T
a
, can be approximated by
Td
a
c
2
50
T
T
(6.20)
where d
50
is the median particle diameter. This formulation takes into account
the deeper penetration of turbulence into the bed with increasing shear stress. In
calculations, d
50
is often approximated by the average diameter of the sediments
in the surcial layer.
In the modeling of sediment bed dynamics, the thickness of the active layer is
specied by the above equation and remains constant until conditions change dur-
ing the erosion/deposition process. When sediments are eroded from this layer, an
equal amount of sediment must be transferred into this layer from the layer below
to keep the thickness of the active layer constant; this transfer generally modies
the properties of the active layer. When sediments are deposited into the active
layer, an equal amount of sediment is transferred from the active layer into the
layer below; a small change in properties of this lower layer may then occur.
6.3 SIMPLE APPLICATIONS
Bed armoring and different particle size distributions can have large (orders of
magnitude) effects on sediment transport. Three examples are presented here to
illustrate this and also to demonstrate the modeling of sediment transport when
these effects are signicant. The examples are concerned with transport, particle
size redistribution, and coarsening in (1) a straight channel, (2) an expansion region,
© 2009 by Taylor & Francis Group, LLC
Modeling Sediment Transport 227
and (3) a curved channel. An example that illustrates the effects of aggregation and
disaggregation on the vertical transport and distribution of ocs is also given.
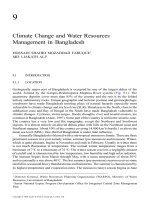
6.3.1 TRANSPORT AND COARSENING IN A STRAIGHT CHANNEL
Little and Mayer (1972) made an elegant study of the transport and coarsening
of sediments in a straight channel. In their experiments, a ume 12.2 m long and
0.6 m wide was used and was lled with a distribution of sand and gravel sedi-
ments. The mean size of the sediment particles was about 1000 µm, but there was
a wide distribution of sizes around this mean (Figure 6.3). Clear water was run
over the sediment bed at a ow rate of 0.016 m
3
/s. The eroded sediment was col-
lected at the outlet of the ume, and the sediment transport rate was determined
from this. Due to bed armoring, the transport rate decreased with time. When the
rate had decreased to about 1% of its value at the beginning, the experiment was
ended. This occurred in 75.5 hr.
The experiment was approximated by means of SEDZLJ. In the model-
ing, erosion rates from Sedume data, multiple sediment size classes, a uni-
ed treatment of suspended load and bedload, and bed armoring were included
(Jones and Lick, 2000, 2001a). The hydrodynamics and sediment transport were
approximated as two-dimensional and time dependent; 13 elements with a down-
stream dimension of 100 cm and a cross-stream dimension of 60 cm were used to
discretize the domain. The sediment bed was assumed to be three-dimensional
and time dependent and consisted of nine size classes that were selected to accu-
rately represent the sediment bed in the experiment (Figure 6.3). Data from the
Roberts et al. (1998) Sedume studies on quartz were used to dene the erosion
Fraction Finer
Particle Diameter (µm)
Model
10
2
10
3
10
4
1
0.8
0.6
0.4
0.2
0
Experiment
FIGURE 6.3 Particle size distributions for experiment and model at the beginning of the
experiment. (Source: From Jones and Lick, 2001a.)
© 2009 by Taylor & Francis Group, LLC
228 Sediment and Contaminant Transport in Surface Waters
rates and critical shear stresses for these sediments (Table 6.1). The coefcient of
hydrodynamic friction, c
f
, was set such that the measured shear stress of 1.0 N/m
2
was reproduced in the model. The active layer was held at a constant thickness of
0.5 cm, which is consistent with Equation 6.20.
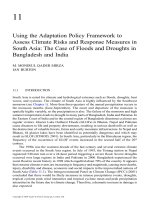
The experimental and calculated transport rates (kg/m/s) at the outlet of the
ume are plotted in Figure 6.4 as a function of time and decrease by about two
orders of magnitude during the course of the experiment. The model shows good
agreement with the experimental data for the entire time. The average particle
size in the active layer of the model and erosion/deposition rates at the end of
the ume are plotted in Figure 6.5 as a function of time. In the rst few hours,
TABLE 6.1
Sediment Size Class Properties
Particle Size
Initial bed
percentage by mass w
s
(cm/s) U
c
(N/m
2
) U
cs
(N/m
2
)
125 2 0.9 0.15 0.15
222 8 2.25 0.24 0.26
432 23 5.2 0.33 0.45
1020 32 11.30 0.425 2.12
2000 11 18.01 0.93 5.36
2400 8 20.18 0.97 6.73
3000 6 23.07 1.2 8.79
4000 6 27.25 1.6 12.26
6000 4 34.13 2.48 19.2
10
–1
10
–2
10
–3
10
–4
10
–5
10
–6
01020
Time (hours)
Transport Rate (kg/m/s)
30 40 50
Model
Experiment
60 70
FIGURE 6.4 Measured and calculated transport rates for ow in a straight channel as a
function of time. (Source: From Jones and Lick, 2001a.)
© 2009 by Taylor & Francis Group, LLC
Modeling Sediment Transport 229
there is a rapid increase in the average particle size from 1600 to 2500 µm; this
is followed by a much slower rate of increase to a little above 2500 µm by the
end of the experiment. Associated with this increase in particle size is a more
than three-orders-of-magnitude decrease in the erosion rate. The reason for this
decrease is that the ner particle sizes are eroded from the sediment bed, whereas
the coarser particles are left behind, thereby increasing the average particle size
of the bed and decreasing the erosion rate. As a result, the suspended and bed-
load concentrations decrease rapidly with time and are responsible for the rapid
decrease in the deposition rate. Figure 6.6 demonstrates that initially the transport
is almost equally bedload and suspended load, but as the bed coarsens, the trans-
port becomes almost exclusively due to bedload. In general, the calculated results
show good overall agreement with the data and trends observed in the Little and
Mayer experiments.
6.3.2 TRANSPORT IN AN EXPANSION REGION
To more fully understand the effects of bed coarsening and different particle size
distributions, the transport in an expansion region was also modeled and analyzed
by means of SEDZLJ (Jones and Lick, 2001a, b). The expansion region (Fig-
ure 6.7(a)) begins with a 2.75-meter wide channel that extends 10 m downstream.
At this point, a 28.8° expansion begins and extends 5 m further downstream,
where the channel then has a constant width of 8.25 m. The depth of water is 2 m
throughout. An inlet ow rate of 2.5 m
3
/s and a zero sediment concentration were
specied at the entrance to the channel, whereas an open boundary condition of
10
–2
10
–3
10
–4
Erosion/Deposition Rate (cm/s)
10
–5
10
–6
0 10203040
Time (hours)
50
4000
3500
3000
2500
2000
1500
Average Particle Size (µm)
1000
500
0
60 70
10
–7
Average particle size
Erosion rate
Deposition rate
FIGURE 6.5 Average particle size in the active layer, erosion rate, and deposition rate at
the end of the ume as a function of time. (Source: From Jones and Lick, 2001a.)
© 2009 by Taylor & Francis Group, LLC
230 Sediment and Contaminant Transport in Surface Waters
no reected waves was used at the end of the channel. A no-slip condition was
specied at the sidewalls.
Calculations were made (1) for a sediment bed consisting of particles with a
uniform size of 726 µm and (2) for a bed initially consisting of a 50/50 mixture
of two particle size classes (432 µm and 1020 µm) with an average particle size of
726 µm. In each case, calculations were made with and without bedload transport
present. When no bedload transport was present, it was assumed that all of the
eroded sediment went into suspended load. In all examples, the quartz erosion
data by Roberts et al. (1998) were used; the sediment bulk densities were assumed
to be 1.8 g/cm
3
.
For the rst case of sediments with a uniform size of 726 µm, it was assumed
that w
s
=8.6 cm/s, U
c
= 0.36 N/m
2
, and U
cs
= 1.22 N/m
2
. For a constant ow rate of
2.5 m
3
/s, a water depth of 2 m, and a surface sediment roughness of 726 µm, the coef-
cient of friction is 0.0034. For this c
f
, Figure 6.7(a) shows the steady-state velocity
vectors and shear stress contours. The maximum velocity is 69 cm/s, whereas the
maximum shear stress is 1.6 N/m
2
and drops below 0.2 N/m
2
downstream.
In the calculations, after an initial transient of about 20 min, a quasi-steady
state was approached where sediments were still eroding and depositing but doing
so at a reasonably constant rate. Because all particles have the same size, no bed
armoring occurred. For the case with bedload, Figure 6.7(b) shows the suspended
sediment concentration prole at this time. The maximum suspended concentra-
tion is 70 mg/L; this rapidly decreases as the expansion begins, the ow velocity
decreases, and the suspended sediments go into bedload and then deposit on the
10
–1
10
–2
10
–3
10
–4
10
–5
0102030
Time (hours)
Transport Rate (kg/m/s)
40 50 60 70
10
–6
Total transport rate
Bedload transport
Suspended load transport
FIGURE 6.6 Calculated suspended load and bedload transport rates as a function of
time. (Source: From Jones and Lick, 2001a.)
© 2009 by Taylor & Francis Group, LLC
Modeling Sediment Transport 231
bed further downstream. Figure 6.7(c) shows the bedload concentration at this
same time. The maximum bedload concentration is approximately 58,000 mg/L,
within 1% of the value predicted by Van Rijn’s (1993) empirical equation. It
should be noted that the thickness of the bedload is only 0.3 cm (approximately
4 particle diameters). The bedload concentration and transport rapidly decrease
in the downstream direction as the shear stress drops below U
c
(about 0.36 N/m
2
).
The net change in bed thickness after 20 min is shown in Figure 6.7(d). In the
center of the upstream channel, there is about 10 cm of net erosion. These eroded
sediments then deposit as the expansion begins and the shear stress decreases
below the critical shear stress for suspension (1.22 N/m
2
); further downstream,
below the critical shear stress for erosion (0.36 N/m
2
); a maximum deposition of
15 cm occurs. This pattern of large and rapid variations in erosion/deposition is
usual where rapid changes in ow velocities occur, especially for bedload.
For this same case without bedload, the erosion rates are the same as above
because the particle size is constant. However, now all the material that was
originally eroding into bedload is assumed to go into suspended load. Calcula-
tions show that, as a result, the maximum suspended sediment concentration is
now much higher than before and increases to more than 1300 mg/L, a factor of
almost 20 greater than with bedload. Because this case does not include bedload
sediments that stay near and deposit on the bottom more readily, sediments are
transported further before depositing. Just before the beginning of the expansion,
the local net erosion increases to more than 100 cm, whereas just downstream of
the expansion, the local deposition increases to more than 100 cm.
The second case (with and without bedload) was assumed to have a sediment
bed initially consisting of 50% 432-µm and 50% 1020-µm particles and therefore
Distance (m)
01020
Distance (m)
Reference Velocity Vector
40 cm/s
30
8
0.2
1
1.2
1.6
1.4
0.8
0.6
0.4
7
6
5
4
3
2
1
0
FIGURE 6.7 Transport in an expansion region. Particle size of 726 µm. Calculations
include bedload. (a) Velocity vectors and shear stress contours (N/m
2
). (Source: From
Jones and Lick, 2001a.)
© 2009 by Taylor & Francis Group, LLC
232 Sediment and Contaminant Transport in Surface Waters
Distance (m)
01020
Distance (m)
30
8
(b)
20
40
60
70
7
6
5
4
3
2
1
0
Distance (m)
01020
Distance (m)
30
8
(c)
40000
50000
30000
20000
10000
7
6
5
4
3
2
1
0
Distance (m)
01020
Distance (m)
30
8
(d)
1
5
7
6
5
4
3
2
1
0
15
–10
0
FIGURE 6.7 (CONTINUED) Transport in an expansion region. Particle size of 726
µm. Calculations include bedload. (b) Suspended sediment concentration (mg/L); (c) bed-
load sediment concentration (mg/L); and (d) net change in sediment bed thickness (cm).
(Source: From Jones and Lick, 2001a.)
© 2009 by Taylor & Francis Group, LLC
Modeling Sediment Transport 233
with an average particle size of 726 µm, the same as above. However, as erosion
and deposition occur, the fraction of particles in each size class and the aver-
age particle size will change in space and time. For particles with a diameter of
432 µm, it was assumed that w
s
=5.2 cm/s, U
c
= 0.33 N/m
2
, and U
cs
= 0.45 N/m
2
.
For the 1020 µm particles, w
s
= 11.3 cm/s, U
c
= 0.425 N/m
2
, and U
cs
= 2.12 N/m
2
.
For the calculation with bedload transport, the suspended sediment concen-
tration after 20 min is shown in Figure 6.8(a). The maximum concentration of
30 mg/L is not only smaller than the previous case with bedload (70 mg/L) as
shown in Figure 6.7(a) but is also further upstream. The bedload concentration
(Figure 6.8(b)) has a maximum concentration (34,000 mg/L) that is lower than
in the previous case (58,000 mg/L), but the shape of the contours is similar. The
reason for the similarity in shape is the strong dependence of the bedload concen-
tration and transport on local shear stress.
30
8
(a)
7
6
5
4
3
Distance (m)
Distance (m)
2
1
0
0102030
20
10
1
Distance (m)
01020
Distance (m)
30
8
(b)
1000
20000
30000
10000
7
6
5
4
3
2
1
0
FIGURE 6.8 Transport in an expansion region. Initial particle size distribution of 50%
432 µm and 50% 1020 µm. Calculations include bedload. (a) Suspended sediment con-
centrations (mg/L); (b) bedload sediment concentrations (mg/L). (Source: From Jones and
Lick, 2001a.)
© 2009 by Taylor & Francis Group, LLC
234 Sediment and Contaminant Transport in Surface Waters
The reason for the differences between the two cases becomes apparent when
the average particle size of the active layer for the second case is examined (Fig-
ure 6.8(c)). At the inlet, the average particle size remains at its original value of
726 µm. The reason is that there is erosion of all particle sizes and, with clear water
inow, there is no deposition of different particle sizes from upstream that could
change the composition of the sediment bed. The eroded 1020-µm particles are
deposited a short distance downstream; the eroded 432-µm particles tend to stay
suspended longer and are transported further downstream. As a result, the sedi-
ment bed rapidly coarsens to more than 1000 µm and the erosion rate decreases in
the inlet and beginning of the expansion region. In the latter part of the expansion
1000
8
(c)
7
6
5
4
3
Distance (m)
Distance (m)
2
1
0
0102030
900
700
500
500
Distance (m)
010
0.5
0
1
1
1.5
1.5
20
Distance (m)
30
8
(d)
7
6
5
4
3
2
1
0
FIGURE 6.8 (CONTINUED) Transport in an expansion region. Initial particle size dis-
tribution of 50% 432 µm and 50% 1020 µm. Calculations include bedload. (c) Average
particle size (µm) in the active layer; and (d) net change in sediment bed thickness (cm).
(Source: From Jones and Lick, 2001a.)
© 2009 by Taylor & Francis Group, LLC
Modeling Sediment Transport 235
region, the ner 432-µm particles that were eroded upstream can now deposit; the
average particle size therefore decreases below the initial average particle size of
726 µm to about 450 µm. Figure 6.8(d) shows the net change in bed thickness dur-
ing this time. In the channel, the coarsening of the bed occurs rapidly, allowing
little net erosion there. The magnitudes of the maximum erosion and deposition
are now only 1.5 cm at the upstream and expansion regions, respectively.
In the present case, the erosion and deposition rates decrease with time due
to bed coarsening so that little net transport occurs as time increases. In a more
realistic situation, there would be a ux of sediments from upstream that would
modify the results shown here. However, the qualitative behavior of the sediment
bed would be essentially the same.
When this case is run without bedload, the same trends as in the previous
case are observed. The maximum suspended load concentration is increased by
greater than an order of magnitude. Coarsening still takes place, but to a smaller
degree. This means higher overall erosion rates, which in turn increase the sus-
pended load concentration.
These examples illustrate the major changes in suspended and bedload sedi-
ment concentrations, erosion rates, and sediment transport due to changes in par-
ticle size distributions and the inclusion of bedload and bed armoring. All are
signicant and need to be included in sediment transport modeling.
6.3.3 TRANSPORT IN A CURVED CHANNEL
Another example that quantitatively illustrates interesting and signicant fea-
tures of sediment transport is the transport and coarsening in a curved channel.
In experiments by Yen and Lee (1995), 20 cm of noncohesive, nonuniform-size
sand were placed in a 180° curved channel with 11.5-m entrance and exit lengths;
these sediments were then eroded, transported, and deposited by a time-varying
ow. The inner radius of the curved part of the channel was 4 m, and the channel
width was 1 m. The water depth was 5.44 cm, and the base ow was 0.02 m
3
/s.
For each experiment (ve in all), the ow increased linearly from the base to a
maximum (which was different for each run) and then decreased linearly back
to the base ow.
As with ow in an annular ume (see Chapter 3), the primary ow in the
curved part of the channel is in the direction of the centerline of the channel;
however, there are small secondary currents due to centrifugal forces. These are
radially outward along the upper surface, downward along the outer bank, inward
along the bottom, and upward along the inner bank. The net result is a helical
motion for uid elements and suspended particles as they traverse around the
bend. As with the annular ume, the shear stresses increase in the radial direction
and are greater near the outer wall than at the inner wall. Because of these second-
ary currents and stress variations, the sediment transport is considerably modied
in the bend of the channel as compared with the straight parts of the channel.
Results of ve different experimental runs were reported. The sediments
were noncohesive and mostly ne to coarse sands. Their particle size distribution
© 2009 by Taylor & Francis Group, LLC
236 Sediment and Contaminant Transport in Surface Waters
is shown in Table 6.2. For the ow rates in the experiments, only the 0.25-mm
particles (which were a small part of the total) had the potential to travel as sus-
pended load. The remainder could only travel as bedload. For the rst run (the
experiment that is summarized here), the experimental runtime was 180 min,
the peak ow rate was 0.075 m
3
/s, and the time during the experiment that the
0.25-mm particles could be resuspended was 157 min.
For these experiments, the hydrodynamics and sediment transport were
treated as three-dimensional and time dependent and were modeled by means of
EFDC, with modications to the sediment bed dynamics as in SEDZLJ (James et
al., 2005). Bed armoring was not included in the modeling. Because only a small
fraction of the sediment could be resuspended, the transport was insensitive to the
assumptions for resuspension. However, the transport was sensitive to the descrip-
tion of bedload. Because of this, ve different bedload formulations (Meyer-Peter
and Muller, 1948; Bagnold, 1956; Engelund and Hansen, 1967; Van Rijn, 1993;
and Wu et al., 2000) were used and compared for Run 1. The formula by Wu et
al. (2000) gave the best comparisons between the model and experiments and was
used thereafter in all the calculations. Eight size classes were used in the results
shown here.
In the experiments, measurements were made of surface elevation and surcial
particle size distribution at 165 locations along different cross-sections of the chan-
nel. These quantities for Run 1 are shown in Figures 6.9(a) and 6.10(a). Figure 6.9 is
a plot of %z/h
0
in the channel, where %z is the change in elevation and h
0
is the origi-
TABLE 6.2
Particle Size Distribution
d (mm) 0.25 0.42 0.84 1.19 2.00 3.36 4.76 8.52
Percent in size class 6.6 10.6 25.4 15.1 20.1 13.0 4.9 4.5
15
14
13
12
11
012
–1.5
–2.0
∆z/h
0
–1.0
–0.5
0
0.5
1.0
3456
y (m)
x (m) x (m)
(a) (b)
14
13
12
11
0123456
FIGURE 6.9 Transport in a curved channel. Change in sediment bed thickness, ∆z/h
0
:
(a) measured and (b) calculated. (Source: From James et al., 2005.)
© 2009 by Taylor & Francis Group, LLC
Modeling Sediment Transport 237
nal undisturbed depth of the water (5.44 cm). Figure 6.10 is a plot of d/d
0
, where d
is the local surcial average particle size and d
0
is the overall average particle size.
Consistent with the hydrodynamics, net erosion and larger particle sizes are evident
toward the outer edge, whereas net deposition and ner particle sizes are shown
toward the inner edge.
Calculated results for these same quantities are shown in Figures 6.9(b) and
6.10(b). The calculated results compared with the measured show somewhat less
erosion near the outer wall and more deposition near the inner wall as well as
greater size gradation; however, the calculated results are qualitatively correct
and reasonably accurate.
6.3.4 THE VERTICAL TRANSPORT AND DISTRIBUTION OF FLOCS
As ocs are transported vertically by settling and turbulent diffusion, their sizes
and densities are modied by aggregation and disaggregation. In the upper part
of the water column, uid turbulence and sediment concentrations are relatively
low; this leads to an increase in oc sizes and higher settling speeds. In the lower
part of the water column, especially near the sediment-water interface, uid tur-
bulence and sediment concentrations tend to be high; this leads to smaller oc
sizes and lower settling speeds.
As a rst approximation to illustrate and quantify these effects, calculations
were made for a one-dimensional, time-dependent description of this transport
(Lick et al., 1992). In this case, the appropriate transport equation is the simpli-
cation of the conservation of mass equation, Equation 6.2, to one direction. For
ocs of size class i with concentration C
i
, this equation becomes
t
t
t
t
t
t
t
t
¤
¦
¥
³
µ
´
C
tz
wC
z
D
C
z
S
i
si i v
i
i
() (6.21)
15
14
13
12
11
012
0.5
d/d
0
1.0
1.5
2.0
2.5
3.0
3456
y (m)
x (m) x (m)
(a) (b)
14
13
12
11
0123456
FIGURE 6.10 Transport in a curved channel. Particle size distribution of surcial layer,
d/d
0
: (a) measured and (b) calculated. (Source: From James et al., 2005.)
© 2009 by Taylor & Francis Group, LLC
238 Sediment and Contaminant Transport in Surface Waters
where z is distance measured vertically upward from the sediment-water inter-
face; w
si
is the settling speed of the i-th component and is a function of oc size
and density; D
v
is the eddy diffusivity; and S
i
is the source term due to occula-
tion and is given by m
i
dn
i
/dt, where dn
i
/dt is determined as described in Section
4.4. There is an equation of this type for each oc size class. All equations are
coupled through the source term, S
i
, and all equations must therefore be solved
simultaneously.
The steady-state distribution of oc sizes and concentrations is illustrated
here. Consider rst the case of a steady state with no occulation. In this case,
each component in the above equation can be treated separately. A solution to this
equation is then:
CC
wz
D
F
w
s
vs
¤
¦
¥
³
µ
´
0
exp (6.22)
where C
0
is a reference concentration and F is an integration constant that cor-
responds to a constant ux of sediment in the negative z-direction. It can be seen
that the concentration decays exponentially above the bottom with a decay dis-
tance of z* = D
v
/w
s
. For the case of zero ux, C = C
0
exp (−w
s
z/D
v
).
When occulation occurs, simple analytic solutions are no longer possible.
In this case, Equation 6.21 was solved numerically for each size class in a time-
dependent manner until a steady state was obtained. For the example illustrated
here, parameters chosen were a water depth of 10 m, an initial sediment concen-
tration of 5 mg/L independent of depth, and zero ux of sediment at the sedi-
ment-water and air-water interfaces. Turbulent shear stresses were assumed to
be relatively low in most of the water column (approximately 0.04 N/m
2
) and
to increase rapidly in the bottom meter to a maximum of 0.16 N/m
2
near the
sediment-water interface. Ten size classes of ocs were assumed. A variable grid
was used in the numerical calculations for increased accuracy near the sediment-
water interface. Results for the steady-state concentration and median oc size
are shown as a function of depth in Figure 6.11. It can be seen that the concen-
tration increases from less than 1 mg/L at the top of the water column to about
20 mg/L at the sediment-water interface. The median diameter of the ocs is
approximately 1000 µm at the top of the column but decreases to about 64 µm at
the sediment-water interface due to increased shear and also increased sediment
concentration as the sediment-water interface is approached.
In this calculation, zero ux conditions at the sediment-water and air-water
interfaces were assumed. A more realistic bottom boundary condition would
specify erosion and deposition uxes at the sediment-water interface, uxes that
would depend on the local turbulent shear stress and suspended sediment concen-
tration and would be different for each size class. In general, this would require
the coupling of the problem described here to a more general three-dimensional
uid and sediment transport calculation.
© 2009 by Taylor & Francis Group, LLC
Modeling Sediment Transport 239
6.4 RIVERS
Sediment transport in rivers varies widely within and between rivers, depending on
bathymetry, ow rates, sediment properties, and sediment inow. The transports in
the Lower Fox and Saginaw rivers are discussed here to illustrate various interest-
ing features of sediment transport in rivers and the modeling of this transport.
6.4.1 SEDIMENT TRANSPORT IN THE LOWER FOX RIVER
An introduction to the PCB contamination problem in the Lower Fox River was
given in Section 1.1, and the hydrodynamics were discussed in Section 5.2. The
emphasis here is on sediment erosion, deposition, and transport. The specic area
that was modeled was from the DePere Dam to Green Bay (bathymetry shown in
Figure 5.2). Much of the contaminated sediments is buried here, especially in the
upstream area that was previously dredged and is now lling in.
Flow rates during a typical year vary from 30 to 280 m
3
/s. In 1989, extensive
measurements of ow rates and suspended sediment concentrations were made.
The highest ow rate during that year (about 425 m
3
/s) was well above normal and
was a once-in-5-years ow event. Several sediment transport events during that
year were modeled (Jones and Lick 2000, 2001a); the period with the highest ow
(from May 22 to June 20) is discussed here.
32
0
10
8
6
4
2
0
510
Concentration (mg/L)
Median Diameter (µm)
Depth (m)
15 20 25
64 126 256 512 1024 2048
C
d
m
FIGURE 6.11 Steady-state sediment concentration and median oc diameter as a func-
tion of depth. (Source: From Lick et al., 1992. With permission.)
© 2009 by Taylor & Francis Group, LLC