Sediment and Contaminant Transport in Surface Waters - Chapter 7 doc
Bạn đang xem bản rút gọn của tài liệu. Xem và tải ngay bản đầy đủ của tài liệu tại đây (1.24 MB, 33 trang )
279
7
The Sorption
and Partitioning
of Hydrophobic
Organic Chemicals
To understand and predict the transport and fate of hydrophobic organic chemicals
(HOCs) in surface waters and bottom sediments, knowledge of the rates of sorp-
tion to and from solid sedimentary particles and the partitioning of these chemicals
between solid particles and water is necessary. In early work, it was often assumed
that adsorption and desorption occurred rapidly and that chemical equilibrium
between the solids and water was attained in a very short time (e.g., see reviews by
Sawhney and Brown, 1989; DiToro et al., 1991; Baker, 1991). This equilibrium was
quantied by means of a partition coefcient, K
p
(L/kg), dened as
K
C
C
p
s
w
(7.1)
where C
s
(kg/kg) is the mass of HOC sorbed to the sediment divided by the mass
of the sediment, and C
w
(kg/L) is the mass of HOC dissolved in the water divided
by the volume of water. However, early sorption experiments were generally short
term, hours to a few days, and were misleading; long-term experiments later dem-
onstrated that both adsorption and desorption processes are often quite slow, with
time scales of days to months or even longer before equilibrium is attained (e.g.,
Karickhoff and Morris, 1985; Coates and Elzerman, 1986). By comparison, the
time of transport of a sediment particle in a river or lake may be as short as
minutes to a few hours. Because of this, the assumption of chemical equilibrium
in surface waters may not be a good approximation in many real situations, and
therefore time-dependent sorption processes must be considered in detail.
In the rst section of this chapter, experiments that illustrate basic and impor-
tant characteristics of this time-dependent sorption as well as steady-state parti-
tioning are presented and qualitatively analyzed. These experiments, as well as
others, demonstrate that sorption times are long, that sorption processes depend
on the HOC, and that these processes are signicantly modied by colloids from
the water, colloids from the sediments, organic content of the sediments, and
particle and oc size and density distributions. The effects of these parameters on
© 2009 by Taylor & Francis Group, LLC
280 Sediment and Contaminant Transport in Surface Waters
the steady-state partitioning of an HOC between sedimentary particles and water
are discussed subsequently. In this rst set of experiments, linear isotherms (i.e.,
K
p
values, which are constant and independent of dissolved HOC concentration at
constant temperature) were obtained. However, nonlinear and interactive effects
on isotherms are often observed and have been reported in the literature; experi-
ments and analyses that delineate these processes are also presented.
For a quantitative understanding of sorption dynamics and also an accurate
ability to predict the sorption, transport, and fate of HOCs in aquatic systems,
quantitative models of the time-dependent sorption processes are needed. In
Section 7.2, a quite general but complex model of time-dependent sorption is
described rst; this model includes effects of particle and oc size and density
distributions. A simpler, less accurate, but computationally efcient model is then
presented. This model is sufcient to describe major characteristics of the sorp-
tion experiments. However, for more accurate descriptions of the experimental
results, the general model is needed. Results with this latter model are then com-
pared with experimental results.
The discussion in this chapter primarily concerns the sorption of HOCs to
suspended particles. The sorption and ux of HOCs in bottom sediments are dis-
cussed in Chapter 8.
7.1 EXPERIMENTAL RESULTS AND ANALYSES
7.1.1 B
ASIC EXPERIMENTS
Results of several experiments are presented here that illustrate the basic char-
acteristics of time-dependent adsorption, desorption, and short-term adsorption
followed by desorption processes for one HOC, and the effects of different HOCs
on adsorption and desorption (Jepsen et al., 1995; Tye et al. 1996; Borglin et al.,
1996). From these experiments, sorption rates as well as partitioning of the HOC
to suspended sedimentary particles can be determined as a function of time. All
experiments were long term and were usually continued until chemical equilib-
rium was attained. All sediments used in this set of experiments were subsam-
ples of the same batch of natural sediments from the Detroit River. The median
particle size was 7 µm, and the organic carbon content was 1.42%. All HOCs
used were carbon-14 labeled in order to simplify the analytical procedures and
to enhance sensitivity. Filtration of the sediment-water mixtures separated opera-
tionally dened sediment-sorbed and dissolved fractions of the HOC at a particle
size of 1 µm. Details of the experimental procedures and additional results can be
found in the articles referenced.
The adsorption experiments were batch-mixing experiments. To initiate the
experiments, a dissolved HOC and clean sediments (i.e., no sorbed HOC) at con-
centrations from 2 to 10,000 mg/L were mixed together with water in amber Qor-
pak glass jars. The jars were then rotated on a rolling table to ensure continuous
mixing of the contents until they were sampled. The experiments were conducted
for different periods of time up to 6 months. One sample jar was prepared for each
© 2009 by Taylor & Francis Group, LLC
The Sorption and Partitioning of Hydrophobic Organic Chemicals 281
sample point. Results of the experiments were reported as the logarithm of the
partition coefcient as a function of time.
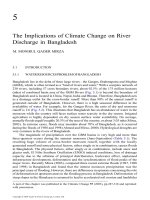
Typical results of experiments with hexachlorobenzene (HCB), sediments, and
Optima pure water are shown in Figure 7.1, where log K
p
is plotted as a function
of time for sediment concentrations of 2, 10, 100, 500, 2000, and 10,000 mg/L.
As the HOC is adsorbed to the sediment, log K
p
varies relatively rapidly at small
time but more slowly as time increases and a steady state is approached. The
time to steady state varies from less than 1 day (for a sediment concentration of 2
mg/L) to about 30 days (for a sediment concentration of 10,000 mg/L). The mea-
sured steady-state partition coefcient depends somewhat on sediment concentra-
tion; that is, log K
p
= 4.0 for a sediment concentration of 2 mg/L and decreases
monotonically to 3.78 at a sediment concentration of 10,000 mg/L, a factor of 1.66
for K
p
. Experiments of this type were performed with Optima pure water as well
as with ltered tap water, with different-size fractions of the original sediments,
with organically stripped sediments, and with three PCB congeners. All gave
results qualitatively similar to those shown in Figure 7.1.
The desorption experiments used a purge-and-trap procedure. Sediments to
which an HOC was sorbed, typically for 3 to 12 months (a time sufcient for sorp-
tion equilibrium to be attained), were mixed with water in a ask. The mixture
was kept suspended and continuously purged with water-saturated compressed
air. The air bubbled through the suspension and exited through a resin column
that trapped the HOC. The HOC then was extracted from this column using a
methanol solution and sonication. The experiments continued until essentially all
the HOC had desorbed from the sediments.
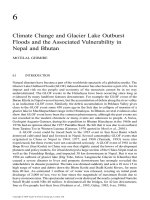
Typical results of desorption experiments with HCB and pure water at
different sediment concentrations are presented in Figure 7.2. The percent of
020
4.5
4.0
3.5
3.0
2.5
Time (days)
Log K
p
40 60
mg/L
2
10
100
500
2000
10000
FIGURE 7.1 Adsorption experiments with HCB and pure water. Log K
p
as a function
of time with sediment concentration as a parameter. (Source: From Jepsen et al., 1995.
With permission.)
© 2009 by Taylor & Francis Group, LLC
282 Sediment and Contaminant Transport in Surface Waters
the HCB initially adsorbed to the particles that has subsequently desorbed is
shown as a function of time. Within experimental error (a few percent), all of
the HCB initially sorbed to the sediments is desorbed with time, indicating
that the adsorption and desorption processes are reversible. The desorption
rate is greatest at the beginning and then decreases as the HCB is desorbed and
its concentration goes to zero. The rate is slightly dependent on sediment con-
centration; the time for 90% desorption is on the order of 50 days (at 100 mg/L)
to 100 days (at 10,000 mg/L). The desorption times for this type of experiment
are signicantly longer than the adsorption times for the adsorption experi-
ments described above (compare Figures 7.1 and 7.2). However, it should be
noted that the desorption experiments (purge-and-trap) are inherently different
from the adsorption experiments (batch-mixing). Hence, there is no direct and/
or simple relation between adsorption and desorption times for these experi-
ments. This is discussed further below and in the next section. Experiments
of this type have been performed with pure water as well as with ltered tap
water, with different-size fractions of the original sediment, with organically
stripped sediments, and with two PCB congeners. Qualitatively similar results
were obtained in all cases.
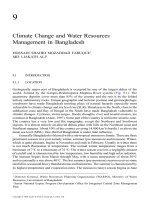
In addition to adsorption and desorption experiments, several short-term
adsorption followed by long-term desorption experiments were performed. In
these experiments, the HOC was adsorbed to sediments for either 2 days or 5 days
(batch-mixing experiments); in this short period of time, sorption equilibrium
was not attained. This was followed by desorption, which lasted until essentially
100
80
Percent of HCB Desorbed
60
40
20
0
0 50 100 150 200
Time (Days)
100 mg/L
500 mg/L
2000 mg/L
10000 mg/L
250 300
FIGURE 7.2 Desorption experiments with HCB and pure water. Percent of the initially
sorbed HCB that has desorbed as a function of time. Sediment concentration as a param-
eter. (Source: From Borglin et al., 1996. With permission.)
© 2009 by Taylor & Francis Group, LLC
The Sorption and Partitioning of Hydrophobic Organic Chemicals 283
all the HOC had desorbed (purge-and-trap experiments). For experiments with
HCB in pure water and at a sediment concentration of 500 mg/L, results for
desorption are shown in Figure 7.3 and are there compared with the standard
desorption experiment (where HCB had been adsorbed for 120 days and there-
fore equilibrated before desorption began). For 2- and 5-day adsorption times,
the desorption times are proportional to the adsorption times but are longer. For
each experiment, essentially all the HCB that was sorbed to the sediment during
the adsorption phase of the experiment is desorbed, again indicating reversibility
of the processes. Experiments also were performed at sediment concentrations
of 100 and 10,000 mg/L; the results were similar in character.
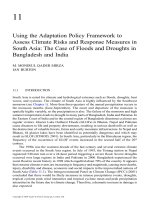
The results shown in Figures 7.1 through 7.3 are all for HCB. For other HOCs,
the results are qualitatively the same but depend quantitatively on the partition
coefcient of the HOC. To illustrate this, results of adsorption experiments are
shown here for three PCB congeners: a monochlorobiphenyl (MCB), a dichloro-
biphenyl (DCB), and a hexachlorobiphenyl (HPCB). For each of these HOCs and
for HCB, log K
p
is shown in Figure 7.4 as a function of time at a sediment concen-
tration of 2000 mg/L. The times to steady state increase as the steady-state value
of K
p
increases. For the PCBs, it was shown that the times to steady state depend
on the sediment concentration in a similar manner as for HCB.
Results of desorption experiments (percent desorbed as a function of time)
are shown in Figure 7.5 for HCB, MCB, and HPCB at a sediment concentration
of 2000 mg/L. Desorption times increase as K
p
increases; for each HOC, they
are proportional to adsorption times (Figure 7.4) but are longer. All the MCB
100
80
Percent of HCB Desorbed
60
40
20
0
0 50 100 150 200
Time (Days)
2 Day adsorption
5 Day adsorption
120 Day adsorption
250 300
FIGURE 7.3 Short-term adsorption followed by desorption experiments. Sediment con-
centration is 500 mg/L. Percent of initially sorbed HCB that has desorbed as a function of
time. (Source: From Borglin et al., 1996. With permission.)
© 2009 by Taylor & Francis Group, LLC
284 Sediment and Contaminant Transport in Surface Waters
and HCB desorbed completely during the experiments; HPCB was at 80% des-
orption at 200 days and was still desorbing when the experiment concluded at
230 days.
2.0
2.5
3.0
3.5
4.0
0 204060
Time (days)
Log K
p
MCB
DCB
HCB
HPCB
4.5
5.0
FIGURE 7.4 Partition coefcients for the adsorption of HCB and three PCB congeners
(MCB, DCB, and HPCB). Log K
p
as a function of time. Experimental data are shown as
open and closed symbols, whereas the modeling results are shown as solid lines. (Source:
From Lick et al., 1997. With permission.)
Percent Desorbed
Time (Days)
100
80
60
40
20
0
0 50 100 150 200 250 300
MCB
HCB
HPCB
FIGURE 7.5 Desorption experiments with HCB, MCB, and HPCB. Percent desorbed as
a function of time. (Source: From Borglin et al., 1996. With permission.)
© 2009 by Taylor & Francis Group, LLC
The Sorption and Partitioning of Hydrophobic Organic Chemicals 285
7.1. 2 PARAMETERS THAT AFFECT STEADY-STATE SORPTION AND PARTITIONING
The experiments described above, as well as similar ones, demonstrate that (1)
sorption times are long (days to months or even longer), (2) desorption times are
longer than adsorption times (but adsorption and desorption experiments are
inherently different), (3) adsorption and desorption are reversible processes, (4)
sorption times and the measured partition coefcients depend on the sediment
concentration, and (5) sorption times depend on the partition coefcient. These
statements have been difcult to quantify and interpret because of seemingly con-
tradictory experimental results and analyses reported in the literature. To assist in
the clarication and quantication of these statements, various factors that affect
the steady-state sorption and partitioning processes are reviewed and discussed
here. The most signicant of these factors are colloids from the sediments, col-
loids from the water, and the organic content of the sediments (Lick and Rapaka,
1996). The dynamics of sorption, including the effects of particle and oc size
and density distributions, are discussed in Section 7.2.
7.1.2.1 Colloids from the Sediments
Colloids are here operationally dened as particles or ocs less than 1 µm in diam-
eter. In pure water, no colloids are present. However, they are always present in
natural waters but vary widely in amount and character. In addition, because there
is a wide distribution of particle sizes in natural sediments (inevitably including
some particles less than 1 µm in diameter), colloids are inherently present in any
sample of natural sediments; they are a natural part of the sediments, and their
amount in the water is more or less proportional to the amount of sediments in
suspension.
In the adsorption experiments with results as shown in Figure 7.1, pure water
was used and there were therefore no colloids from the water. However, because
natural sediments were used, colloidal particles from the sediments were present.
In these experiments, HCB was truly dissolved in the water and also adsorbed
to the solid sedimentary particles greater than 1 µm in diameter, to the colloidal
particles, and to colloidal particles that had occulated such that the oc diameter
was greater than 1 µm (i.e., no longer colloidal). For these experiments, it was
demonstrated that the mass of HCB adsorbed to the occulated colloidal matter
was generally small in comparison with the HCB adsorbed to the solid particles,
and it was therefore ignored.
To interpret and quantify the steady-state partition coefcients as shown in
Figure 7.1, especially the dependence of K
p
on sediment concentration, consider
the following. During ltration to separate C
s
and C
w
and hence to determine K
p
from Equation 7.1, the amount of HCB retained on the lter consists of the HCB
sorbed to the sediment particles greater than 1 µm, m
Hs
, whereas the amount of
HCB in the ltrate consists of the truly dissolved HCB, m
Hd
, plus the amount of
© 2009 by Taylor & Francis Group, LLC
286 Sediment and Contaminant Transport in Surface Waters
HCB sorbed to the colloidal matter from the sediments, m
Hdc
. It follows that the
measured partition coefcient in this case is given by
K
m
m
mm
V
m
m
m
V
m
pm
Hs
d
Hd Hdc
Hs
sed
Hd Hd
¤
¦
¥
³
µ
´
se
1
cc
Hd
s
w
Hdc
Hd
p
Hdc
Hd
m
C
C
m
m
K
m
m
¤
¦
¥
³
µ
´
¤
¦
¥
³
µ
´
1
1
(7.2)
where m
sed
is the mass of sediments, V is the volume of water, and K
p
is the true
partition coefcient as dened in Equation 7.1.
A partition coefcient for the colloidal matter can be dened as
K
m
m
m
V
c
Hdc
dc
Hd
(7.3)
where m
dc
is the mass of colloidal particles from the sediments. In general, m
dc
should be proportional to the mass of the sediments; that is, m
dc
= Bm
sed
, where B is
the fraction of colloidal particles in the sediments. It follows from the above that
m
m
K
m
V
K
m
V
KC
Hdc
Hd
c
dc
c
sed
c
A
A
(7.4)
where C is the sediment concentration. By substituting this expression into Equa-
tion 7.2, one obtains
K
K
KC
pm
p
c
1 A
(7.5)
It can be seen that K
pm
depends on the sediment concentration and reduces to K
p
as the sediment concentration decreases to zero. From this and Figure 7.1, it fol-
lows that log K
p
is approximately equal to 4.0 ± 0.1, or K
p
= 10,000 L/kg.
If it is further assumed that the partition coefcient for the colloidal matter is
approximately the same as that for the sediments, the above equation reduces to
K
K
KC
pm
p
p
1 A
(7.6)
© 2009 by Taylor & Francis Group, LLC
The Sorption and Partitioning of Hydrophobic Organic Chemicals 287
This expression is similar to that derived by Wu and Gschwend (1986). From
this equation and the data in Figure 7.1, B can be estimated and is approximately
0.005, a reasonable number for the fractional mass of colloidal particles in natural
sediments. With this, the above equation is consistent with the results in Fig-
ure 7.1. By comparison of K
p
for 2 mg/L and 10,000 mg/L, the maximum effect of
colloids from the sediments on K
p
in these experiments is a factor of about 1.66.
As with these experiments, most sorption experiments have been performed
with suspended sediments at relatively low concentrations of 10
4
mg/L or less.
The extension of these results to high concentrations, such as may occur in sur-
face waters during large oods or storms but especially in consolidated bottom
sediments, was questionable. Because of this difculty, adsorption experiments
with HCB and pure water were done at sediment concentrations from 10
2
mg/L
up to 6.25 × 10
5
mg/L, concentrations approaching those of consolidated sedi-
ments (Deane et al., 1999).
Measured partition coefcients for HCB and Detroit River sediments (with
3.2% organic carbon and different from that above) are shown in Figure 7.6(a) as
a function of time and for sediment concentrations of 10
2
, 10
3
, 10
4
, 5×10
4
, 10
5
,
and 6.25 × 10
5
mg/L. At the largest sediment concentration, the effect on K
p
is
a factor of about 5 compared with K
p
at 100 mg/L. For each of these concentra-
tions, the colloidal fraction, B, was determined by means of a submicron particle
sizer and also by the difference in mass between the ltrates from a 1-µm and a
0.1-µm lter (Table 7.1). With this data, Equation 7.6 then was used to determine
4.2
4.0
3.8
3.6
3.4
Log K
pm
(L/kg)
3.2
3.0
2.8
2.6
0 50 100 150 200
10
2
mg/L
10
3
mg/L
10
4
mg/L
10
5
mg/L
5 × 10
4
mg/L
6.25 × 10
5
mg/L
Time (days)
FIGURE 7.6(a) Partition coefcients as a function of time during adsorption at different
sediment concentrations: measured partition coefcients. (Source: From Deane et al., 1999.
With permission.)
© 2009 by Taylor & Francis Group, LLC
288 Sediment and Contaminant Transport in Surface Waters
4.2
4.0
3.8
3.6
3.4
Log K
pm
(L/kg)
3.2
3.0
2.8
0 50 100
Time (days)
150 200
10
2
mg/L
10
3
mg/L
10
4
mg/L
10
5
mg/L
5 × 10
4
mg/L
6.25 × 10
5
mg/L
FIGURE 7.6(b) Partition coefcients as a function of time during adsorption at differ-
ent sediment concentrations: partition coefcients corrected for colloidal effects. (Source:
From Deane et al., 1999. With permission.)
TABLE 7.1
Colloidal Fractions in Highly Suspended Sediment Concentration
Experiments
Sediment
Concentration
(mg/L)
Colloidal Fraction
Measured by
Submicron Particle
Sizer
Colloidal Fraction
Measured by
0.1 µm Filtration
Detroit River 10
2
0.00057 0.00062
10
3
0.00046 0.00039
10
4
0.00039 0.00035
5 r 10
4
0.00008 0.00012
10
5
0.00011 0.00017
6.25 r 10
5
0.00006 0.00016
Stripped Detroit River 10
3
0.00572 0.00613
10
4
0.00540 0.00500
5 r 10
4
0.00470 0.00430
10
5
0.00325 0.00415
6.25 r 10
5
0.00070 0.00150
Santa Barbara Mountain 10
2
0.00232 0.00236
10
3
0.00221 0.00248
10
4
0.00190 0.00215
5 r 10
4
0.00057 0.00071
10
5
0.00040 0.00036
6.26 r 10
5
0.00027 0.00037
© 2009 by Taylor & Francis Group, LLC
The Sorption and Partitioning of Hydrophobic Organic Chemicals 289
the true partition coefcient. These corrected partition coefcients are shown in
Figure 7.6(b). The general trends of K
p
with time are the same as in Figure 7.6(a)
except that now all partition coefcients at the different sediment concentrations
approach the same value of log K
p
= 4.1, or K
p
= 12,600 L/kg. This equilibrium
value of K
p
is independent of sediment concentration.
These results, along with previous experimental results, demonstrate that
the steady-state measured partition coefcient after correction for effects of
colloids from the sediments is independent of sediment concentration, even
at very high sediment concentrations approaching those of consolidated sedi-
ments. This true equilibrium partition coefcient therefore can be used as the
appropriate partition coefcient in studies of consolidated sediments and satu-
rated soils.
7.1.2.2 Colloids from the Water
Colloids are always present in natural waters, even without resuspension of bot-
tom sediments — for example, in slowly moving streams or even in tap water.
HOCs naturally sorb to these colloids as well as to colloids from resuspended
sediments. Because of this sorption capability, colloids from the water can signi-
cantly affect the adsorption, desorption, and partitioning processes. They can do
this in two different ways. First, HOCs sorbed to colloids are, in general, experi-
mentally considered part of the dissolved chemical component, C
w
. This increases
the value of C
w
and hence reduces the value of the partition coefcient from its
value in pure water (i.e., water without colloids). Second, colloids can affect the
sorption and partitioning processes through aggregation of the colloids into ocs
that are greater than 1 µm in diameter. As this happens, the chemical adsorbed
to these ocs is then generally considered part of the solid component, C
s
. This
increases the value of the partition coefcient from its value in the absence of
colloid occulation.
To illustrate the effects of colloids from the water, consider experiments by
Jepsen and Lick (1996) where Santa Barbara tap water was ltered with a 0.2-µm
pore-size lter and then mixed with HCB. After 5 days, the HCB-water mixture
was ltered with a 1-µm lter just prior to the addition of sediments. Results
for log K
p
as a function of time with sediment concentration as a parameter are
shown in Figure 7.7.
As in other experiments, the measured K
p
at steady state is a function of
the sediment concentration but is a stronger function of C than that shown in
Figure 7.1. For this set of experiments, it was demonstrated that the main reason
for this dependence was the inclusion, in the determination of K
p
, of the HCB
adsorbed to the occulated colloidal matter from the water. A partition coefcient
independent of this occulated colloidal matter can be determined as follows.
The total amount of HCB retained on the lter at steady state consists of the sum
of the HCB on the sediments and the HCB sorbed to the occulated colloidal
matter, m
Hf
. It follows that the measured K
p
is given by
© 2009 by Taylor & Francis Group, LLC
290 Sediment and Contaminant Transport in Surface Waters
K
mm
m
C
m
mC
m
mC
pm
Hs Hf
sed
w
Hs
sed w
Hf
sed w
(7.7)
The last term can be rewritten as
m
mC
mV
mm
m
mC
Hf
sed w
Hf
sed Hd
Hf
Hd
(7.8)
From these two equations, K
pm
can be written as
KK
m
mC
pm p
Hf
Hd
(7.9)
The rst term on the right is the partition coefcient in the absence of occulated
colloidal matter from the water. The second term is due to this occulated mat-
ter. The ratio of m
Hf
to m
Hd
was determined independently by means of mixing
experiments with just the chemical, water, and the colloids inherent in the water,
but with no sediments; it was shown to have a value of 0.087 for the ltered tap
water used in the experiments. With this value of m
Hf
/m
Hd
, the above equation
gives results that are in good agreement with those shown in Figure 7.7.
This equation shows the correction to K
p
due to occulated colloids from
the water. In general, the effect on the measured partition coefcient of colloids
10
5
4
3
2
050
Time (days)
Log K
p
100 150
100
500
2000
10000
mg/L
FIGURE 7.7 Adsorption experiments with HCB. Log K
p
as a function of time with
sediment concentration (mg/L) as a parameter. (Source: From Jepsen and Lick, 1996.
With permission.)
© 2009 by Taylor & Francis Group, LLC
The Sorption and Partitioning of Hydrophobic Organic Chemicals 291
from the sediments and of the occulated colloidal matter from the water can be
described by
K
K
KC
m
mC KC
pm
p
p
Hf
Hd
p
11AA()
(7.10)
With this correction, the partition coefcients shown in both Figures 7.1 and 7.7
all reduce to a single value, independent of sediment concentration. For these
experiments, the effects of colloids from the tap water, Equation 7.9, were greater
than the effects of colloids from the sediments, Equation 7.6. This is probably true
for most natural waters at low sediment concentrations. At high sediment concen-
trations, as in Figure 7.6, the effects of colloids from the sediment are greater.
In addition to its effect on equilibrium partitioning, the occulation of col-
loids may affect the sorption rates. Because of the small sizes of (unocculated)
colloids, the sorption of a chemical to colloids is probably very rapid, so this
should not affect the overall rates of sorption to the suspended sediments. How-
ever, the sorption of a chemical to aggregated colloids may be relatively slow,
and this will affect the measured sorption rates. The time-dependent occulation
of colloids and the subsequent operational shift of the sorbed chemical from the
dissolved to the solid compartment may also signicantly affect the observed
sorption rates. These effects have been qualitatively observed but have only been
partially quantied (Jepsen et al., 1995).
7.1.2.3 Organic Content of Sediments
The sorption of HOCs, in general, is considered to be primarily to the organic
matter in the sediments. This has been demonstrated by many investigators and
is illustrated by results from long-term adsorption (Jepsen et al., 1995; Tye et al.,
1996) and desorption experiments (Borglin et al., 1996). These experiments were
performed with natural Detroit River sediments (1.42% o.c.) and with these same
sediments stripped of their organic matter. The equilibrium K
p
values for the
stripped sediments were lower by a factor of about 16 compared to the natural
sediments. It could not be ascertained whether the remaining sorption after strip-
ping was due to sorption to the mineral surfaces of the sediments or due to sorption
of HCB to a small amount of organic matter still remaining in the sediments. The
adsorption and desorption times also were dependent on the presence of organic
matter; for the stripped sediments, they were smaller by factors of 5 to 10.
As with much of the literature on this subject, the above discussion has
implicitly assumed that HOCs sorb to the organic matter in the sediments and that
this organic matter has universal, homogeneous sorption properties; for example,
partition coefcients are commonly normalized to total organic carbon (TOC).
However, recent investigations (Ghosh et al., 2003; Accardi-Dey and Gschwend,
2002, 2003; Lohmann et al., 2005) have indicated that different types of organic
matter may sorb HOCs in different amounts and at different rates. In particular,
investigators have identied two types of organic matter with differing sorption
© 2009 by Taylor & Francis Group, LLC
292 Sediment and Contaminant Transport in Surface Waters
properties: (1) amorphous organic matter (AOM) and (2) carbonaceous geosor-
bents (CG) such as black carbon, coal, and kerogen. Partition coefcients for CG
may be one to two orders of magnitude greater than for AOM. This indicates that
partition coefcients and the rates of sorption are determined not only by the total
amount of organic matter but also by the amounts of each type of organic matter.
A recent review of this topic is given by Cornelissen et al. (2005).
7.1.2.4 Sorption to Benthic Organisms and Bacteria
In assessing sediment contamination and the effects of HOCs on organisms,
equilibrium partitioning (EqP) of HOCs among the solids, water, and benthic
organisms is often assumed. For example, EqP has been applied to set sedi-
ment quality criteria for benthic organisms in sediments with PAHs. However, it
has been demonstrated that HOC concentrations in benthic organisms are often
one to two orders of magnitude less than expected based on EqP (Hellou et al.,
2002; Kraaij et al., 2002; Guthrie-Nichols et al., 2003). Reasons for this are the
nite rates of sorption to organisms as well as to sediments — even slower for
consolidated bottom sediments than for suspended sediments. This nite rate of
sorption also has been demonstrated for bacteria (Lunsman and Lick, 2005); in
these experiments, the time-dependent sorption of three HOCs to Rhodococcus
rhodochrous was investigated. It was demonstrated that the sorption depended
on whether the bacteria were living (different depending on whether they were
growing or nongrowing) or dead as well as on the state of aggregation (occula-
tion) of the bacteria.
7.1. 3 N ONLINEAR ISOTHERMS
For the experiments with HCB, MCB, DCB, and HPCB described above, C
s
was
proportional to C
w
at constant temperature for HOC concentrations that varied
over four orders of magnitude; that is, the isotherms were linear and K
p
was con-
stant over this range. However, there are numerous reports of nonlinear isotherms
in the literature. Some of the reasons for this nonlinearity were investigated (Jep-
sen and Lick, 1999) and are discussed here.
The HOCs mentioned above have a range of K
p
values from approximately
10
3
to 10
5
L/kg, but all are characterized by having low solubilities, from 1 µg/L to
a few mg/L. Because of these low solubilities and because the maximum amount
of an HOC that can be sorbed to a sediment depends on the solubility as well as
the partition coefcient of the HOC, only a relatively small amount of any of these
HOCs can be sorbed to the sediment. This amount may be inadequate to cause
nonlinear effects.
To investigate this hypothesis, long-term sorption experiments were done
with additional HOCs with higher solubilities (tetrachlorobiphenyl, TCB; tetra-
chloroethylene, PCE; pentachlorophenol, PCP; and octanol), whereas previous
sorption experiments with HCB, MCB, DCB, and HPCB were extended to higher
values of C
w
so as to obtain values of C
w
as close to the HOC’s solubility limit
© 2009 by Taylor & Francis Group, LLC
The Sorption and Partitioning of Hydrophobic Organic Chemicals 293
as possible. The results of these experiments are presented here in terms of C
oc
and K
oc
. C
oc
is the mass of an HOC sorbed to the sediments divided by the mass
of organic carbon in the sediments and is dimensionless (i.e., kg of chemical/kg
of organic carbon); K
oc
, a partition coefcient normalized to the organic carbon
content of the sediments, is dened as
K
C
C
oc
oc
w
(7.11)
and has units of liters per kilogram (L/kg). The solubility, S (kg/L), is the maxi-
mum amount of the HOC that can be in solution (i.e., the maximum value of C
w
);
the maximum value of C
oc
is therefore K
oc
S. For K
oc
S << 1, it follows that C
oc
<<
1; the maximum amount of chemical that can be sorbed is therefore much smaller
than the amount of organic carbon that is associated with the sediments. For
K
oc
S=0(1), C
oc
= 0(1), and the amounts of sorbed chemical and organic carbon
are comparable. Dene K
o
oc
as the value of K
oc
at low values of C
w
, where C
s
is a
linear function of C
w
. Values of K
o
oc
, S, and K
o
oc
S for all HOCs tested are given in
Table 7.2. For the chemicals listed, K
o
oc
S varies over a large range, from much less
than 1 (2 r 10
−3
for HCB) to much greater than 1 (36.5 for octanol).
As a representative HOC that demonstrates nonlinear effects, consider PCE.
For PCE, K
o
oc
is 1.1×10
3
L/kg, the solubility is 1.5 × 10
−4
kg/L, and K
o
oc
S is there-
fore 0.165; K
o
oc
S is smaller than 1 but of the same order of magnitude as 1. Experi-
mental results for C
oc
as a function of C
w
are shown in Figure 7.8 for two organic
carbon concentrations (1.95 and 3.3%) and two sediment concentrations (100 and
1000 mg/L). It can be seen that C
oc
is independent of organic carbon and sediment
concentrations. At low concentrations of C
w
, C
oc
is a linear function of C
w
and
C
oc
/C
w
= K
o
oc
. As C
w
increases, C
oc
is no longer a linear function of C
w
and con-
tinually decreases below its linear value; K
oc
therefore also decreases below K
o
oc
.
These deviations of C
oc
and K
oc
begin when C
oc
is approximately 10
−2
(i.e., when
TABLE 7.2
Partition Coefficients and Solubilities of Chemicals
Chemical
K
o
oc
(L/kg)
S
(10
–6
kg/L) K
o
oc
S
Hexachlorobenzene
4 r 10
5
0.005 0.002
Monochlorobiphenyl
1.25 r 10
5
5.1 0.64
Dichlorobiphenyl
4 r 10
5
0.055 0.022
Tetrachlorobiphenyl
1.8 r 10
6
0.045 0.081
Hexachlorobiphenyl
6.3 r 10
6
0.001 0.0063
Tetrachloroethylene
1.1 r 10
3
150 0.165
Pentachlorophenol
2.6 r 10
3
11 0.03
Octanol
8.1 r 10
4
450 36.5
© 2009 by Taylor & Francis Group, LLC
294 Sediment and Contaminant Transport in Surface Waters
the mass of PCE sorbed to the sediment is approximately 10
−2
of the mass of the
organic carbon associated with the sediments) and continually increase until the
solubility limit is reached. When C
w
= S, C
oc
is about 0.08 and K
oc
has decreased
from K
o
oc
by a factor of about 2.
For all the HOCs tested, experimental results for C
oc
as a function of C
w
were
similar in character to those for PCE. In particular, C
oc
was a linear function of
C
w
for small values of C
oc
but began to decrease below its linear value when C
oc
was approximately 10
−2
. The similarity of the experimental results suggests non-
dimensionalizing, or normalizing, the values of C
w
and plotting C
oc
as a function
of K
o
oc
C
w
. The results for C
oc
as a function of K
o
oc
C
w
for all the HOCs tested are
shown in Figure 7.9(a). As with PCE, for each HOC and as long as C
w
is less
than S, C
oc
is a linear function of K
o
oc
C
w
until C
oc
is approximately l0
−2
; after
this, C
oc
deviates from this linear relation, with the deviation increasing as K
o
oc
C
w
increases.
Once C
oc
is determined as a function of C
w
, K
oc
can be calculated from Equa-
tion 7.11. It is informative to normalize K
oc
by K
o
oc
and to plot K
oc
/K
o
oc
as a func-
tion of K
o
oc
C
w
(Figure 7.9(b)). The data for all HOCs essentially fall on the same
curve, and therefore K
oc
/K
o
oc
is primarily a function of K
o
oc
C
w
. For each HOC, the
extent of the reduction of K
oc
/K
o
oc
from one depends on K
o
oc
C
w
but is limited by
the solubility of the HOC. For HCB and HPCB, K
o
oc
S << 1 and K
oc
/K
o
oc
is always
essentially 1; for octanol, K
o
oc
S >> 1 and the maximum reduction in K
oc
/K
o
oc
is the
largest of the HOCs tested, a factor of about 100; other HOCs with intermediate
values of K
o
oc
S have intermediate reductions in K
oc
/K
o
oc
.
3.3%, 1000 mg/L
3.3%, 100 mg/L
1.95%, 100 mg/L
Organic Carbon (%) and
Sediment Concentration (mg/L)
10
0
10
–9
10
–8
10
–7
10
–6
10
–5
10
–4
10
–3
C
oc
(kg/kg)
10
–1
10
–2
10
–3
10
–4
10
–5
10
–6
C
w
(kg/L)
FIGURE 7.8 Tetrachloroethylene isotherm. C
oc
as a function of C
w
for different organic
carbon contents and sediment concentrations. The solid line is the linear isotherm.
(Source: From Jepsen and Lick, 1999. With permission.)
© 2009 by Taylor & Francis Group, LLC
The Sorption and Partitioning of Hydrophobic Organic Chemicals 295
The reduction of K
oc
from its value at low chemical concentrations, K
o
oc
, can
be attributed to the saturation by the HOC of the organic carbon in the sediments
such that fewer adsorption sites are available to the HOC as C
oc
increases. Ana-
lytic approximations for this reduction can be derived as follows. The desorption
rate for an HOC, to a rst approximation, is proportional to the concentration
of the HOC on the solid and can be expressed as k
2
C
oc
, where k
2
is a desorption
HCB
MCB
DCB
TCB
HPCB
PCE
PCP
Octanol
10
–6
10
–5
10
–4
10
–3
10
–2
10
0
10
–1
10
1
10
2
10
0
C
oc
(kg/kg)
10
–1
10
–2
10
–3
10
–4
10
–5
10
–6
K
o
oc
C
w
(a)
HCB
MCB
DCB
TCB
HPCB
PCE
PCP
Octanol
10
–6
10
–5
10
–4
10
–3
10
–2
10
0
10
–1
10
1
10
2
K
o
oc
C
w
1.5
1
0.5
0
K
oc
K
o
oc
(b)
FIGURE 7.9 Partitioning for all HOCs tested: (a) C
oc
as a function of K
o
oc
C
w
(the solid
line is the linear isotherm), and (b) K
oc
/K
o
oc
as a function of K
o
oc
C
w
. (Source: From Jepsen
and Lick, 1999. With permission.)
© 2009 by Taylor & Francis Group, LLC
296 Sediment and Contaminant Transport in Surface Waters
coefcient. The adsorption rate is proportional to the dissolved HOC concentra-
tion and can be expressed as k
1
C
w
(l − F), where k
1
is an adsorption coefcient and
F is the fraction of the volume already occupied by the chemical and therefore not
available for further sorption. At equilibrium, the rates of adsorption and desorp-
tion are equal and therefore
k
2
C
oc
=k
1
C
w
(1 – F)(7.12)
Rearranging gives
C
C
k
k
KK
oc
w
oc
o
oc
1
2
11() ()EE
(7.13)
where K
o
oc
=k
1
/k
2
.
Various assumptions can be made to relate F to C
oc
. For low HOC concen-
trations when F << 1, the simplest and a quite reasonable approximation is that
F = BC
oc
, where B is a constant. The above expression then can be written as
C
C
KC
oc
w
oc
o
oc
()1 A (7.14)
and is equivalent to the well-known Langmuir equation. From this it follows that
C
KC
KC
oc
oc
o
w
oc
o
w
1 A
(7.15)
K
KKC
oc
oc
o
oc
o
w
1
1 A
(7.16)
and it follows that both C
oc
and K
oc
/K
o
oc
are functions of K
o
oc
C
w
, as implied in
Figures 7.9(a) and (b). For B = 30, plots of Equations 7.15 and 7.16 are shown in
Figures 7.9(a) and (b), respectively. Reasonably good agreement between theory
and experiments is demonstrated.
A better assumption for F is that
E
A
1e
C
oc
(7.17)
For low values of BC
oc
, this is equivalent to F = BC
oc
. Substitution of Equation
7.17 into Equation 7.13 leads to
CKCe
oc oc
o
w
C
w
A
(7.18)
© 2009 by Taylor & Francis Group, LLC
The Sorption and Partitioning of Hydrophobic Organic Chemicals 297
K
K
e
oc
oc
o
C
oc
A
(7.19)
These are both better approximations to the data at larger values of K
o
oc
C
w
than
Equations 7.15 and 7.16.
For octanol, neither of the above approximations for F ts the data for C
oc
well over the entire range of C
w
(Figure 7.9(a)). The best t to the data for octanol
seems to be two straight lines, that is, C
oc
=K
oc
C
w
for low values of C
w
(say, less
than C
*
w
) and, at higher values,
C
C
C
C
oc
oc
w
w
m
**
¤
¦
¥
³
µ
´
(7.20)
where C
*
oc
=K
o
oc
C
*
w
and m is a constant. It follows that
K
K
C
C
oc
oc
o
w
w
m
¤
¦
¥
³
µ
´
*
1
(7.21)
for C
w
>C
*
w
. For m = 0.5, these approximations are shown in Figures 7.9(a) and (b)
as the dot-dash line. This approximation for C
oc
as a function of C
w
is reminiscent
of a Freundlich isotherm, except, of course, that Equation 7.20 is only valid for
C
w
>C
*
w
and not for the entire range of C
w
. For C
w
<C
*
w
, the isotherms are linear.
Nonlinear isotherms also can be caused by interactive effects between the
HOC and a co-solvent (Jepsen and Lick, 1999). To investigate this, long-term
experiments were rst done with HOCs, all of which had low solubilities. For
mixtures of these HOCs, no interactive effects were observed. Experiments
then were performed with HCB–octanol, HCB–ethanol, octanol–ethanol, and
HOC–methanol mixtures. For these mixtures, signicant reductions in the
partition coefcient occurred as the co-solvent concentration increased. This
reduction was explained quantitatively by a partitioning of the primary HOC
between the co-solvent, organic matter in the sediment, and water. The agreement
between theory and experiment was quite good.
7.2 MODELING THE DYNAMICS OF SORPTION
To more quantitatively understand the laboratory experiments described and ref-
erenced above and also to be able to accurately predict the sorption, transport,
and fate of HOCs in surface waters, quantitative models of sorption dynamics
are needed. For this purpose, a description of a general model (Lick and Rapaka,
1996) is given in Section 7.2.1. This will later be shown to give quite accurate
descriptions of the dynamics of the experiments described in the previous sec-
tion. However, this model is quite complex and requires considerable auxiliary
data and computer time. Because of this, a general calculation of the transport
© 2009 by Taylor & Francis Group, LLC
298 Sediment and Contaminant Transport in Surface Waters
of contaminants in surface waters with this model is impracticable. A simplied
model is therefore needed (Lick et al., 1997) and is described in Section 7.2.2.
This simplied model is then used to analytically describe major characteristics
of the experiments described above. In Chapter 8, it is used in transport calcula-
tions. In Section 7.2.3, results of numerical calculations with the general model
are presented and compared with experimental results on sorption.
In the discussion, the emphasis is on the nonequilibrium dynamics of the
sorption. The general model includes diffusion of the HOC through the pores
within a particle/oc, quasi-equilibrium HOC partitioning locally within a par-
ticle/oc, approximate particle and oc size and density distributions, and effects
of organic content and chemical properties. As discussed above, colloids from the
water and from the sediments have signicant effects on sorption rates and equi-
librium partitioning. Although the effects of colloids on equilibrium partitioning
are understood reasonably well and have been quantied, our knowledge of their
effects on the dynamics of sorption is inadequate. Because of this, the effects of
colloids on sorption dynamics are not considered here.
7. 2 .1 A DIFFUSION MODEL
In the present modeling, the transport of an HOC within a particle/oc (hereafter
generally referred to as a particle for simplicity) is assumed to occur by diffusion
of the dissolved chemical through the pores of the particle; this transport is then
modied by adsorption of the HOC to organic substances within the particle and
possibly to mineral surfaces of the particle. In general, this diffusion/reaction
process must be described by partial differential equations for the concentrations
of the chemical dissolved in the pore waters of the solid as well as in the solid.
However, if it is assumed that the time for adsorption within the particle/oc is
relatively fast by comparison with the time for diffusion, a local quasi-equilibrium
assumption can be made (this is discussed in more detail in Section 8.2). In this
case, the transport of the chemical within the particle can be described by a single
time-dependent diffusion equation with no reaction term but with an effective dif-
fusion coefcient given by (Berner, 1980; Wu and Gschwend, 1986)
D
D
K
D
K
m
sp
m
sp
¤
¦
¥
³
µ
´
1
1
1
F
F
R
F
FR()
(7.22)
where D
m
is the molecular diffusion coefcient in the uid within the particle
without consideration of any reaction but corrected for tortuosity, K is the porosity
of the particle, and S
s
is the mass density of the solid in the particle. The second
equality is valid for chemicals with large partition coefcients such that (1 − K)
S
s
K
p
/K >> 1.
© 2009 by Taylor & Francis Group, LLC
The Sorption and Partitioning of Hydrophobic Organic Chemicals 299
If it is assumed that the particle/oc is a homogeneous, porous sphere with
radius R, the governing equation for the contaminant concentration within the
sphere, C
s
(r,t), is
t
t
t
t
t
t
¤
¦
¥
³
µ
´
C
t
D
r
r
r
C
r
ss
2
2
(7.23)
where r is the distance in the radial direction, t is time, and D is assumed constant.
For the small particles considered here, the ow around the particle is slow and
the thickness of the uid boundary layer through which mass transfer occurs is
relatively small. As a result, the transfer of the chemical from the water to the
surface of the particle is a relatively fast process. It follows that the concentration
of the chemical at the surface of the particle, C
s
(R,t), is essentially in equilibrium
with the chemical dissolved in the water, that is,
C
s
(R,t)=K
p
C
w
(t) (7.24)
For the desorption experiments, C
w
is small and C
s
(R,t) is therefore approximately
zero. For the adsorption experiments, C
w
changes with time due to adsorption of
the dissolved chemical by the particles. This variation with time can be calcu-
lated from the mass conservation equation for the sediment–contaminant–water
mixture, which is
m
V
CC C
s
w
(7.25)
where m is the total mass of chemical in volume V and C
s
(t) is the average con-
centration of the chemical in the particles.
In many cases, the effects of particle/oc size and density distributions on
sorption dynamics are signicant and must be included in the modeling for accu-
rate results. The concentrations of the sediments in each size range, C
k
, depend
on the particle/oc size and density distributions and will vary with time because
of occulation. When different-size fractions are considered, it is convenient to
introduce X
k
, the fraction of sediments by mass in the k-th size range, that is,
X
C
C
k
k
(7.26)
In measurements of particle/oc size distributions, the quantity actually mea-
sured is the volume fraction, Y
k
, where Y
k
is the volume of the ocs in the k-th
size range divided by the total volume of the ocs. X
k
and Y
k
are related by
X
k
= '
k
Y
k
(7.27)
where '
k
= (2.6 − 1.6 K
k
)/(2.6 − 1.6 K) and it has been assumed that the density of
the particles composing the oc is 2.6 g/cm
3
. For the cases considered here, the
© 2009 by Taylor & Francis Group, LLC
300 Sediment and Contaminant Transport in Surface Waters
size and density distributions are not wide, and the variation in '
k
is less than 2.
Because of this and because of our meager knowledge of the values of K
k
, it will
be assumed that '
k
= 1 and therefore that X
k
=Y
k
.
For each size fraction, the appropriate generalization of Equation 7.24 is
C
sk
(R
k
,t)=K
p
C
w
(t) (7.28)
where C
sk
and R
k
are the chemical concentration and radius, respectively, for the
sediments in the k-th size range. Equation 7.25 is still valid, except that now
Ct C tX
s
k
sk
k
() ()3 (7.29)
where C
sk
is the average concentration of the chemical in particles in the k-th size
range.
7. 2 .2 A S IMPLE AND COMPUTATIONALLY EFFICIENT MODEL
The sorption model described above (hereafter referred to as the diffusion model)
is quite complex, requires data on occulation, and also requires extensive com-
puter time when it is used as part of a general transport model. Some calculations
with this model are illustrated in Section 7.2.3. For more practical purposes, a
simplied and computationally efcient, but still reasonably accurate, model has
been developed and is as follows. The major simplications are that (1) the dif-
fusion of C
s
within a particle is approximated as a mass transfer process between
the particle and the surrounding water, and (2) changes in particle and oc size
and density distributions are not included. For sediments consisting of single-size
particles, the time-dependent change of the average value of C
s
within the par-
ticle, C
s
, is then approximated by
dC
dt
kC KC
s
spw
() (7.30)
where k is a mass transfer coefcient (s
−1
). The quantity (C
s
–K
p
C
w
) is a forc-
ing function that is proportional to the difference between C
s
and its equilibrium
value, K
p
C
w
, and is zero when the HOC sorbed to the particle/oc is in chemical
equilibrium with the HOC dissolved in the water. This model will be referred to
as the mass transfer model.
The coefcient k is not known from basic principles or directly from experi-
mental results but is chosen so as to obtain good agreement between the solutions
of the above equation and the diffusion equation, Equation 7.23. For this purpose,
consider the case of desorption from a particle with a sorbed concentration of C
s
to a dissolved HOC concentration in the water of zero. Integration of Equation
7.30 then gives
© 2009 by Taylor & Francis Group, LLC
The Sorption and Partitioning of Hydrophobic Organic Chemicals 301
C
s
= C
o
e
kt
(7.31)
where C
o
is the initial value of C
s
. The time for 75% desorption of C
o
is given by
t
k
1 386.
(7.32)
For the diffusion equation (Equation 7.23), the time for 75% desorption is given
approximately by (Carslaw and Jaeger, 1959)
t
d
D
0 0225
2
. (7.33)
where d is the diameter of the particle. For the results of the diffusion and mass
transfer models to agree at t
+
, Equations 7.32 and 7.33 must agree, and therefore
k is determined by
k
D
d
D
dK
m
p
Ô
Ư
Ơ
à
Đ
â
ă
ả
á
ã
0 0165
0 0165 1
1
2
2
.
.
F
F
R
(7.34)
with D from Equation 7.22.
To determine the accuracy of this approximation, desorption calculations
were made with both the diffusion and the mass transfer models (Lick et al.,
1997). Results are shown in Figure 7.10 for the desorption of HCB (K
p
=10
4
L/kg
and D=2ì10
14
cm
2
/s, a reasonable value for D, as shown below) for a particle
with a diameter of 15 àm. There is reasonable agreement between the results
of the two models for all time, and they coincide for 75% desorption. The mass
transfer model is much more computationally efcient than the diffusion model,
usually by more than an order of magnitude, because it is not necessary to solve
the diffusion equation (Equation 7.23) for a particle/oc as a function of r and t.
For a mixture of particles of different size classes, Equations 7.30 and 7.34 are
assumed to be valid for each size class.
For analytic purposes, an exponential desorption time is convenient and
can be dened from Equation 7.31 as kt
*
d
=1 (t
*
d
is the time for C
s
to desorb to
e
1
= 0.368 of its initial value). Equation 7.34 indicates that this time is given by
t
dK
D
d
sp
m
*
.
Ô
Ư
Ơ
à
Đ
â
ă
ả
á
ã
0 0165 1
1
2
F
F
R
(7.35)
â 2009 by Taylor & Francis Group, LLC
302 Sediment and Contaminant Transport in Surface Waters
For large K
p
, this states that t
*
d
is proportional to K
p
. This dependence of t
*
d
on K
p
is consistent with Figure 7.5, where desorption times for MCB, HCB, and HPCB
are approximately in the ratio of 1:5:33, which is also the ratio of the K
p
values.
In contrast to the experimental results as shown in Figure 7.2, there is no obvious
dependence of t
*
d
on sediment concentration in the above equation. This sediment
concentration effect depends on particle and oc size and density distributions
and is discussed below.
For the adsorption problem, C
w
is not zero but is nite and varies throughout
the experiment, often by orders of magnitude; its time dependence is governed by
Equation 7.25. Substitution of Equation 7.25 into Equation 7.30 gives
dC
dt
kKCCkK
m
V
s
ps p
()1 (7.36)
At the beginning of the adsorption experiments, C
s
= 0. With this condition, the
solution to the above equation is
CC e
ss
kKCt
p
§
©
¶
¸
c
1
1()
(7.37)
where C
se
=K
p
m/(1+K
p
C)V and is the value of C
s
in the steady state as t ne.
This equation indicates an exponential adsorption time, t
*
a
, given by
"
!
FIGURE 7.10 Desorption of HCB from suspended sediments as calculated by the diffu-
sion and mass transfer models. Shown is the percent of sorbed HCB that has desorbed as
a function of time. For this calculation, D=2×10
−14
cm
2
/s, log K
p
= 4.0, and the particle
diameter was 14.56 µm. (Source: From Lick et al., 1997. With permission.)
© 2009 by Taylor & Francis Group, LLC
The Sorption and Partitioning of Hydrophobic Organic Chemicals 303
t
kKC
dK
a
p
sp
*
()
.
Ô
Ư
Ơ
à
Đ
â
ă
ả
á
1
1
0 0165 1
1
2
F
F
R
ãã
DKC
mp
()1
(7.38)
This adsorption time is signicantly different from the desorption time given by
Equation 7.35 and, for the same conditions, is always smaller than t
*
d
. The reason
for the difference between t
*
a
and t
*
d
is, of course, that the adsorption and desorp-
tion experiments are inherently different from each other and, in particular, they
are not mirror images of each other. In the desorption experiments, the particle
is desorbing into a dissolved chemical concentration of zero. In the adsorption
experiments, the particle is adsorbing from a dissolved chemical concentration
that is not constant but is decreasing with time, often by an order of magnitude
or more.
For small-enough sediment concentrations, K
p
C << 1. In this case, the above
equation indicates that t
*
a
is proportional to K
p
. However, for most adsorption
experiments described above, K
p
C is not small; t
*
a
, therefore, is not directly pro-
portional to K
p
but instead is a weak function of K
p
. This is consistent with the
results of the adsorption experiments shown in Figure 7.4, where the ratios of the
t
*
a
for MCB, DCB, HCB, and HPCB are approximately 1:1.5:1.5:3.0, signicantly
different from the ratio of K
p
values and the times for desorption.
Both of the above equations for t* indicate that t* is proportional to d
2
, where
d is an effective oc size for diffusion of the HOC within the oc. In general, this
effective oc size depends on the oc size and density and is a complex func-
tion of the sediment concentration and uid shear (Chapter 4); it is different in
the adsorption and desorption experiments. This is discussed further below in
numerical calculations with the general model.
Comparison of Equations 7.38 and 7.35 clearly indicates that adsorption times
are less than desorption times, in agreement with experiments. However, the ratio
of these two times, 1 + K
p
C, needs to be modied by the effects of differences in
oc sizes between the adsorption and desorption experiments.
7.2.3 CALCULATIONS WITH THE GENERAL MODEL AND
COMPARISONS WITH EXPERIMENTAL RESULTS
Although the simple model presented above describes many of the general char-
acteristics of the sorption experiments, for accurate representation of the experi-
mental results, it is necessary to use the more general model to (1) describe the
transport of C
s
within the particle/oc by means of the diffusion equation, Equa-
tion 7.23, and (2) approximate the particle/oc size and density distributions.
â 2009 by Taylor & Francis Group, LLC