Water Conservation Part 9 potx
Bạn đang xem bản rút gọn của tài liệu. Xem và tải ngay bản đầy đủ của tài liệu tại đây (669.04 KB, 15 trang )
Water Management in the Petroleum Refining Industry
111
Parameter
Oil
y
dischar
g
e
D1
Oil
y
dischar
g
e
D2
Efluent from
API discharge 1
Efluent from
API discharge 2
Efluent from
the final CPS
Flow, L/s
116
55 108
72 113
46 107
69 220109
Temperature,
°C
447 322 414 321 383
O&G, mg/L
624
728 474
464 55
54 40
21 4840
COD, mg/L
586
212 591
214 311
73 318
56 31461
CODsoluble,
mg/L
21763 15948 19252 14145 16746
BOD
5
, mg/L
144
54 146
84 108
26 102
60 10552
TSS, mg/L
185
65 195
64 24
2 42
24 336
TDS, mg/L
1,583
250 828
167 1,076
155 733
109 883165
Sulphates,
mg/L
1118 25352 9814 21488 16477
Chlorides,
mg/L
78239 24186 54583 22289 38885
Sulphides,
mg/L
5037 189 4033 145 2718
Fluorides,
mg/L
0.500.08 0.360.14 0.390.14 0.350.16 0.370.11
Phenols,
mg/L
0.950.65 1.290.82 0.820.61 1.210.90 1.010.72
NH
4
-N, mg/L
28
22 35
32 25
21 33
36 2923
TKN, mg/L
49
25 67
29 36
24 58
38 4631
Ptotal, mg/L
0.70
0.17 0.87
0.22 0.63
0.16 0.72
0.13 0.660.15
Alkalinity,
mg/L
12321 10230 10538 10025 10440
Hardness, mg
CaCO
3
/L
389126 22435 24938 20745 22534
pH
7.13
0.34 7.06
0.15 7.09
0.12 7.05
0.10 7.090.11
Conductivity,
S/cm
2,570419 1,340436 1,840151 1,170240 1,790110
Table 3. Characteristics of the oily effluents in refinery R2
Water Conservation
112
attributed basically to desorption. The evaluation indicated that the API separators were
correctly designed; there was 40% additional capacity for safety reasons. However, the oil
recollection and recovery, as well as the sludge extraction were deficient and reengineering
project of the pretreatment facilities was developed, based on the wastewater
characterizations and on the results of the performed treatability tests. The existing CPS did
not provide any O&G, COD and TSS removal. The plate modules, after a complete cleaning,
got saturated with oily sludge in few months. The constant cleaning and sludge extraction
was too complicated operationally.
The obtained characterizations and the pretreatment performance evaluation indicated that
additional treatment is required after the API separators for reaching the appropriate water
quality for reuse. The emulsified and dissolved oil remain in the water after the physical
separation. Therefore, as it had been indicated in previous publications (Eckenfelder, 2000;
Galil & Wolf, 2001; Al-Shamrani et al., 2002), destabilization of the oil-water emulsions and
separation by dissolved air flotation, followed by biological and advanced treatment are
needed for an effective water reuse implementations.
3.2 Water management options
With the proposal to achieve a complete wastewater reuse and increase the fresh water
saving in each one of the studied refineries, new water management options were
suggested. The option development was based on the current water usage and management
data, on the performed wastewater measurements and characterizations, as well as
considering the results of the evaluation of the existing treatment systems.
The water management option for refinery R1 considered the treatment for reuse of the two
effluents that are currently discharged to the sea. This refinery has already constructed
sequential batch reactors, lime softening reactors, rapid sand filters and reverse osmosis
system with a capacity of 86 L/s. These facilities require adjustment for the processing of all
the pretreated wastewater. Currently only 50 L/s of the pretreated effluent are submitted to
the biological treatment. The effluent is mixed with fresh water and then submitted to the
advanced treatment. Performance problems in the separators frequently cause reductions of
the influent to the biological treatment for avoiding biomass intoxication.
The current and the proposed new water management systems for the refinery R1 are
presented on Fig. 1. Currently the refinery reuses only 30% of the generated wastewaters, which
allowed 13% reduction of the fresh water consume. The proposed water management system
considers complete reuse of the treated wastewater which will provide an increase of the fresh
water save to 39%. Recently, a new municipal wastewater treatment facility was constructed
next to the refinery with a capacity of 45 L/s. This facility included nitrification-denitrification
activated sludge system with the objective to use the treated water in the cooling tower make-
up in the refinery. This way 51% fresh water consume reduction will be reached.
The refinery R2 has already constructed nitrification-denitrification activated sludge system,
followed by ultrafiltration and inverse osmosis systems. Currently this facility provides
treatment to only 40-50% of the generated wastewater because of the high O&G
concentrations in the effluent from the pretreatment system. The industrial effluent is mixed
with 30 L/s domestic wastewater before to be submitted to the biological treatment. The
obtained water use reduction was only 26%.
The current and the proposed new water management systems for the refinery R2 are
presented on Fig. 2. The reengineering project for the pretreatment wastewater treatment
system will provide a complete wastewater reuse and this way 59% fresh water consume
reduction will be reached.
Water Management in the Petroleum Refining Industry
113
Fig. 1. Water management systems in the refinery R1: a) current management;
b) proposed water management.
Water Conservation
114
Fig. 2. Water management systems in the refinery R2: a) current management; b) proposed
water management.
Water Management in the Petroleum Refining Industry
115
3.3 Results of the treatability tests
Treatability tests for natural oil flotation were performed in both refineries. For refinery R1
water samples for the tests were taken from the oily discharge 1 (influent to the first stage
separator) and from the influent to the secondary stage separators which is a mixture of the
oily discharge 2 with the effluent from the first stage separator. For refinery R2 water
samples were taken from both oily discharges D1 and D2. The obtained removal-surface
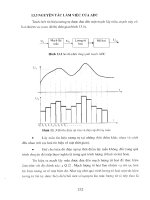
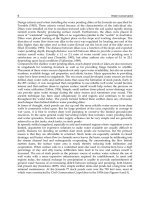
loading rate relationships for the refinery R1 are presented on Fig.3. As it can be seen, 90%
O&G removal was obtained in the first and second stage separators with surface loading
rates of 3.43 and 4.60 m
3
.m
-2
.h
-1
(floatation velocity of 0.10 and 0.13 cm/s) respectively. The
simultaneous TSS removal was of 59% and 60% respectively with 30-40 min hydraulic
retention time (HRT). Higher O&G removals, of 95% were obtained with surface loading
rates of 1.15 and 1.53 m
3
.m
-2
.h
-1
(0.03 and 0.04 cm/s) respectively. The TSS removal did not
increase substantially, 62% were obtained for both kinds of wastewater with HRT of 1.5-2.0
hours.
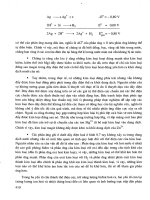
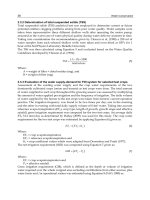
The results of the tests for natural oil flotation performed in refinery R2 are presented on
Fig.4. O&G removals of 90% were obtained in D1 and D2 with surface loading rates of 2.77
and 2.30 m
3
.m
-2
.h
-1
(floatation velocity of 0.08 and 0.06 cm/s) respectively. The TSS removals
were 68% and 59% respectively with 50-60 min HRT. The COD removals were relatively
low, 34% and 32% respectively. O&G removals of 95% were obtained with the water of both
discharges at surface loading rates of 1.15 m
3
.m
-2
.h
-1
(0.03 cm/s). The TSS and COD
removals increased at this rate when the HRT of 2 h was used. TSS removals were 72% and
63% for D1 and D2 respectively; COD removals reached 39 and 34% respectively. The
experimentally obtained floatation velocity was two times lower than the theoretically
calculated for D1. Both velocities were similar in the case of D2. The tests indicated also that
after the natural flotation the COD values remain in the range 340-460 mg/L, in spite of the
low O&G concentrations (47-62 mg/L). The optimal separator depth was also obtained in
the tests, it was 0.8-1.3 for the best O&G and COD removal and it could by up to 2.3 m
considering as criteria the TSS removal.
50
60
70
80
90
100
051015
Surface loading rate, m
3
.m
-2
.h
-1
Removal, %
TSS Rem. (Infl.First Stage Sep.)
O&G Rem. (Infl.First Stage Sep.)
TSS Rem. (Infl.Second Stage Sep.)
O&G Rem. (Infl.Second Stage Sep.)
Fig. 3. Results of the treatability tests for natural flotation performed in Refinery R1.
Water Conservation
116
20
30
40
50
60
70
80
90
100
0 5 10 15
Surface loading rate, m
3
.m
-2
.h
-1
Removal, %
TSS Rem. (D1)
O&G Rem. (D1)
COD Rem. (D1)
TSS Rem. (D2)
O&G Rem. (D2)
COD Rem. (D2)
Fig. 4. Results of the treatability tests for natural flotation performed in Refinery R2.
The emulsion destabilization study began with preliminary tests applying only acidification
and alcalinization of the wastewater. Fig. 5 shows the effect of the final pH on the O&G and
COD removal in effluents from API separators. The average initial pH in the three effluents
was 7.30.1. The effluent from the second stage separator of the refinery R2 had O&G and
COD of 95 and 1,513 mg/L respectively. The effluents from the API separators of the
refinery R2 had lower concentrations. The effluent API-D1 had O&G and COD of 58 and 518
mg/L respectively, the effluent API-D2 had 48 and 487 mg/L respectively. The results
showed different comportment in the wastewater from refinery R1 and R2. The removals
decreased gradually with the pH increase in the wastewater from refinery R1, which means
an increase of the emulsion stability and this can be attributed to the adsorption of hydroxyl
ions at the oil-water interface. This indicates that the oil droplets are stabilized mainly by
ionic surfactants present in the wastewater. The inverse tendency was observed in the
wastewater from refinery R2, the removals increased gradually with the pH increase.
Consequently the emulsion stabilization can be attributed basically to non-ionic substances
in this case. The results showed also that the pH variation had very low effect of on the
removals in the range pH of 6-8. That is why the test with the different coagulants and
flocculants were performed at the natural pH of the wastewater. As it can be observed on
Fig.5 a drastic increase of the COD removal was obtained at pH of 12. This can be attributed
to the intense precipitation of Ca and Mg compounds which contribute to the emulsion
destabilization. This phenomenon had a very strong effect in the effluent API-D1 which had
the highest hardness and salinity.
The emulsion destabilization was obtained satisfactorily using combinations of mineral
coagulant and polymers, as well as applying only cationic polymer of high molecular
weight. The obtained results when using different mineral coagulants for the emulsion
destabilization in the effluent API-D1 are illustrated on Fig.6. It can be observed that the
polyaluminium chlorides had better behavior compared with the conventional coagulants.
COD removals higher than 65% were reached with doses 30% lower than the required for
the conventional coagulants. The best results were obtained with PAX-16S. Both aluminium
and ferric sulphates proved to be effective destabilizing agents. The pH optimization tests
Water Management in the Petroleum Refining Industry
117
indicated that the optimum pH for Al and Fe coagulants was 7.8 and 7.1 respectively. This is
expected because the maximum neutralization of the oil droplets surface charge by
hydrolyzed aluminium and ferric cations occurs in the pH range of 7-8 (Al-Shamrani et al.,
2002). Similar optimal doses for each chemical product were obtained in the three studied
effluents.
0
10
20
30
40
50
60
70
80
0123456789101112
pH
Removal, %
COD Rem. (R1-Effluent
Second Stage Sep.)
COD Rem. (R2 -Effluent
API-D1)
COD Rem. (R2 -Effluent
API-D2)
O&G Rem. (R1-Effluent
Second Stage Sep.)
O&G Rem. (R2 -Effluent
API-D1)
O&G Rem. (R2 -Effluent
API-D2)
Fig. 5. Removals of O&G and COD before flocculation as a function of pH.
20
30
40
50
60
70
80
90
0246810121416
Dose as ion Al or Fe, mg/L
COD Removal, %
SAS Al2 ( SO4 ) 3
PAX-260XLS
PAX-16S
PIX-145 Fe2(SO4)3
PIX-111 FeCl3
Fig. 6. Removals of COD using mineral coagulants (oily water with O&G, COD and TSS of
63-96, 503-566 and 65-74 mg/L respectively)
The removals obtained with the application of the different coagulants are summarized in
Table 4. The results show that the addition of highly charged cations in the form of
aluminium and ferric salts effectively induced the destabilization of the oil-water emulsions,
leading to the significant oil separation (O&G and COD removal efficiencies of 61-79% and
61-70% respectively). TSS, turbidity and color were also successfully removed obtaining 69-
85%, 92-97% and 87-89% efficiencies respectively. These results were expected, as the oil
Water Conservation
118
droplets have negative values of zeta potential (Nalco, 1995; Al-Shamrani et al., 2002).
However, the flocs formed in the coagulation process were small in size and their settling
was very slow. Therefore combinations of mineral coagulants with different polymers were
tested. In these tests the coagulants were added at doses equal to 70% of the optimal doses
indicated in Table 4. The results obtained in the effluent API-D1 are presented on Fig.7 and
Fig.8. Both kinds of polymers, cationic and anionic ones, improved the COD removal. Lower
COD concentrations were reached with the cationic polymers compared with the obtained
with the anionic ones. The COD removals were calculated in the ranges of 78-93% and 66-
81% for the cationic and for the anionic polymers respectively. The O&G removals were of
94-97% and 89-92% for the cationic and for anionic polymers respectively. The TSS removal
was also better, efficiencies of 89-92% and 86-89% were obtained for the cationic and for
anionic polymers respectively. Since the oil droplets are negatively charged, the better
performance of the cationic polymers can be attributed to the increase of the cationic charge
added to the oily wastewater, which enhances the reduction of the zeta potential and
improves this way the destabilization of the oil-water emulsion. The anionic polymers
combined with the mineral coagulants had only flocculating effect. The flocks formed in
these tests were much greater and heavier than the obtained when only coagulants were
used. The sludge quantities were of 40-60 ml/L.
The best coagulant-flocculant combinations and their optimal doses are summarized in
Table 5. The O&G and COD removal efficiencies of 93-96% and 89-95% respectively were
reached, which is almost 24% higher than the obtained using only coagulants. TSS, turbidity
and color removal efficiencies were 81-90%, 99% and 94-97% respectively, that is 5-8%
higher than the efficiency using only coagulant. The obtained in the performed tests
removal efficiencies are higher than the reported by Galil & Wolf, 2001 and the determined
optimal doses are lower than the reported in Galil & Rebhun, 1992.
Coagulant
Opti
mal
doses,
mg/L
Removal efficiencies, %
R1-Effluent Second
Stage Separator
R2-Effluent API-
D1
R2-Effluent API-
D2
O&G COD TSS O&G COD TSS O&G COD TSS
Aluminium sulphate
(SAS)
50 62 67 83 62 63 69 61 62 76
PAX-XL60S 45 64 67 84 - - - - - -
PAX-260XLS 30 - - - 64 66 80 66 67 78
PAX-16S 30 65 68 85 66 70 86 67 68 77
PAX-XL19 40 63 65 80
Ferric chloride
(PIX-111)
15 - - - 75 66 85 78 65 77
Ferric sulphate
(PIX-145)
20 - - - 77 62 85 79 64 79
Ferric sulphate
(Ferrix-3)
20 65 68 82 - - - - - -
Table 4. Removals of O&G, COD and TSS obtained using only coagulants in the different
API effluents (the doses are expressed in mg/L of chemical product)
Water Management in the Petroleum Refining Industry
119
0
40
80
120
160
200
0.0 0.2 0.4 0.6 0.8 1.0
Dose, mg/L
COD, mg/L
PIX-111 and C-1288
PIX-111 and C-498
SAS and C-1288
SAS and C-498
PAX-260S and C-1288
PAX-260S and C-498
PIX-111 and C-1392
PIX-111 and C-1781
SAS and C-1392
SAS and C-1781
PAX-260S and C-1392
PAX-260S and C-1781
Fig. 7. Removals of COD using mineral coagulants and cationic polymers (oily water with
O&G, COD and TSS of 96-120, 592-733 and 60-78 mg/L respectively)
0
50
100
150
200
250
0 0.2 0.4 0.6 0.8 1 1.2 1.4 1.6
Dose, mg/L
COD, mg/L
PAX-260S and A-1638
PAX-260S and A-305
PAX-260S and AE-1488
PAX-260S and A-100
SAS and A-1638
SAS and A-305
SAS and AE-1488
SAS and A-100
PIX-111 and A-1638
Fig. 8. Removals of COD using mineral coagulants and anionic polymers (oily water with
O&G, COD and TSS of 96-110, 404-490 and 62-75 mg/L respectively)
Water Conservation
120
Coa-
gulant
Opti
mal
doses,
mg/L
Floccul
ant
Opti
mal
doses,
mg/L
Removal efficiencies, %
R1-Effluent Second
Stage Separator
R2-Effluent API-D1 R2-Effluent API-D2
O&G COD TSS O&G COD TSS O&G COD TSS
SAS 45
ECOFL
OC
0.4 96 93 87 - - - - - -
PAX-
260XLS
40 C-1288 0.6 95 91 88 - - - - - -
PAX-
260XLS
31 C-1392 0.3 - - - 96 94 85 93 92 84
SAS 35 C-1288 0.3 - - - 95 90 83 94 89 83
PIX-111 11 C-1288 1.0 - - - 93 95 81 93 93 83
PIX-145 14 C-498 1.1 - - - 96 95 90 94 93 88
Table 5. Removals of O&G, COD and TSS obtained using coagulants and flocculants in the
different API effluents (the doses are expressed in mg/L of chemical product)
The results of the tests adding only cationic polymers for the emulsion destabilization and
flocculation are presented on Fig.9. All studied polymers provided good COD, O&G and
TSS removals, very similar to the obtained with coagulant and flocculant addition. The
obtained COD, O&G and TSS removal efficiencies were of 81-94%, 83-96% and 78-95%
respectively. The sludge generation adding cationic polymers was 20-30 ml/L, almost
50% lower than the obtained in the tests with the combinations of coagulant and
polymers. The tests with pH variation indicated that the optimum pH was different for
each polymer, the optimal pH values were in the range 6.9-8.5. The optimum pH were
different for the three studied effluents. The removals obtained with the application of the
different coagulants and the optimum pH values are summarized in Table 6. The
flocculants ECOFLOC and C-1288 had the best performance for the oily effluent from the
second stage separators of refinery R1 and C-5100 and C-1288 for both effluents of the
refinery R2.
0
40
80
120
160
200
0 102030405060
Dose, mg/L
COD, mg/L
C-1288
C-498
C-1781
C-1392
C-5100
ECOFLOC
Fig. 9. Removals of COD using cationic polymers (oily water with O&G, COD and TSS of
142-164, 500-651 and 84-95 mg/L respectively)
Water Management in the Petroleum Refining Industry
121
Cationic
polymers
Opti
mal
doses,
mg/L
Opti
mal
pH
Removal efficiencies, %
R1-Effluent Second
Stage Separator
R2-Effluent API-D1 R2-Effluent API-D2
O&G COD TSS O&G COD TSS O&G COD TSS
C-1288 30 7.4 94 85 94 - - - - - -
C-1288 25 7.0 - - - 96 84 82 93 83 83
C-498 40 7.4 91 83 91 - - - - - -
C-498 25 7.2 - - - 93 84 88 92 82 87
C-1781 35 7.2 92 85 93 - - - - - -
C-1781 35 7.2 - - - 92 83 95 90 80 91
C-1392 40 7.2 92 83 90 - - - - - -
C-1392 35 7.0 - - - 91 83 88 89 81 90
C-5100 34 7.6 - - - 95 94 91 92 90 92
ECOFLOC 30 7.4 95 86 95 - - - - - -
ECOFLOC 50 7.2 - - - 83 81 78 82 82 80
Table 6. Removals of O&G, COD and TSS obtained using only coagulants in the different
API effluents (the doses are expressed in mg/L of chemical product
The combination of processes flocculation and dissolved air flotation was first performed in
refinery R1. The used oily wastewater had O&G, COD and TSS concentrations of 286 mg/L,
1,390 mg/L and 207 mg/L respectively. The saturation pressure (P) was varied from 40 to 70
lb/in
2
, the recycling ratio (R) from 0.1 to 0.4. Both cationic polymers ECOFLOC and C-1288
were used in the tests. The results of the first experimental run indicated that the most
important factor for the O&G, COD and TSS removal is the selection of the polymer,
followed by the recycling ratio and finally the saturation pressure. ECOFLOC showed better
performance than C-1288 in these tests. The effect of P and R variation on O&G
concentration in the treated water using ECOFLOC is illustrated on Fig.10 (a). It can be
observed that R values higher than 0.2 caused an increase of O&G concentration in the
effluent. The increase of the O&G concentration was higher when high P values are applied.
The values of the COD were between 111 and 309 mg/L. The determined O&C, COD and
TSS removal efficiencies were of 74-99%, 78-92% and 73-89% considering all of the obtained
results in this experimental run.
As the P reduction provided lower O&G concentrations in the effluent, the second
experimental run considered P variation in lower range 35-55 lb/in
2
and R variation
between 0.05 and 0.20. The initial O&G, COD and TSS concentrations varied in the
ranges of 175-480 mg/L, 1,050-1,500 mg/L and 268-292 mg/L respectively. The effect of
P and R variation on the O&G concentration in the treated water is illustrated on Fig.10
(b). The treated water O&G, COD and TSS concentrations were of 2-113 mg/L, 121-950
mg/L and 21-89 mg/L respectively considering all of the obtained results in this
experimental run. ANOVA indicated that the most important factor for the O&G, COD
and TSS removal was the recycling ratio, followed by a combined effect of R and the
initial concentration. With minimum air/solid ratio of 0.10 a surface charge of 0.94-2.30
m
3
.m
-2
.h
-1
was obtained in the flotation cell. According to the obtained optimization
model O&G, COD and TSS removals more than 97%, 89% and 91% respectively can be
obtained using low pressures in the saturation tank, of 37-40 lb/in
2
, with 0.07-0.09
recycling ratio.
Water Conservation
122
3D Surface Plot (DAF First run.STA 6v*24c)
O&G = 6.6346+0.1919*x+46.7042*
y
40
30
20
3D Surface Plot (sta 7v*27c)
O
&G = 247.2606-10.3622*x+319.0287*y+0.1057*x*x+4.4818*x*
y
-2068.8235*y*
y
44
28
12
Fig. 10. Effect of P and R variation on O&G concentration in the treated water: a) first
experimental run; b) Second experimental run (refinery R1)
The third run flocculation-flotation tests were performed using the cationic polymer C-5100
and wastewater from the API effluent D1. The initial O&G, COD and TSS were 54, 414 and
120 mg/L respectively, much lower than the values in the previous tests. Color and
Turbidity were 2,630 PtCo and 379 NTU. The P, R and HRT were varied in the ranges of 14-
28 lb/in
2
, 0.1-0.30 and 15-25 min. The effect of the HRT and R on the O&G concentration in
the treated water using C-5100 is shown on Fig.11. The R had more significant effect on the
removal of all the parameters compared with the one of the HRT. The best operational
conditions were: P of 21 lb/in
2
, HRT of 25 min and recycling ratio of 0.2. The obtained
removal efficiencies for O&G, COD and TSS were 50-85%, 47-61% and 56% respectively. The
Turbidity and Color removals were determined of 83-85% and 85-92% respectively.
3D Surface Plot (Spreadsheet3 .sta 15v*26c)
O&G = 14.8622-470.2667*x+4.401*y+987.6667*x*x
+3.78*x*y-0.1299*y*y
25
20
15
10
Fig. 11. Effect of HRT and R variation on O&G concentration in the treated water (R2)
a
)
b
)
Water Management in the Petroleum Refining Industry
123
The flocculation-floatation tests indicated that concentrations of O&G and TSS lower
than 50 mg/L can be obtained in the treated oily wastewater. The O&G and TSS removal
efficiencies were in agreement with the reported in Eckenfelder (2000) and Galil & Wolf,
(2001), while the obtained COD removals were better than the reported in the literatuure.
However, in spite of the obtained good COD removal efficiencies, the remaining values
of the COD in the treated water were still high, in the range of 160-800 mg/L depending
of the COD in the API effluents. These COD quantity, attributed basically to soluble
organic matter, needs to be removed before the application of advanced treatment
processes.
3.4 Evaluation of the biological and advanced treatment and analysis of the reclaimed
water reuse feasibility
Different biological treatment processes have been used for refinery wastewater
treatment, and the biological treatment systems allow good organic matter degradation;
however, inhibition problems may occur because of the presence of many recalcitrant and
toxic hydrocarbons, as for example the phenols. Biological treatment systems were
already implemented in the studied refineries. For protection of the process performance,
they have established maximum permissible limits (MPL) for some parameters which
have to be accomplished in the influents to the biological reactors. The phosphate
concentration in the refinery wastewater is generally low, so phosphoric acid is frequently
used to support the biomass growth. As it could be seen in the previous Tables 1 and 2,
ammonia nitrogen concentrations are relatively high in the wastewater and their removal
is frequently an additional object of the biological treatment. Te refinery R1 has
implemented sequential batch reactors (SBR) and refinery R2 a nitrification-denitrification
activated sludge (AS) system. The refinery R1 has established the following MPL: 70
mg/L for O&G, 470 mg/L for COD, 30 mg/L for TSS, 6 mg/L for phenols, 560 mg/L for
chlorides, 30 mg/L for sulfides and 6-9 units for pH. The MPL in refinery R2 are: 48 mg/L
for O&G, 400 mg/L for COD, 5 mg/L for phenols, 560 mg/L for TDS, 8.5 units for pH and
35°C for temperature. The existing oily wastewater pretreatment facilities in the studied
refineries normally accomplish these requirements due to their high retention capacity.
However, the frequent operational problems made impossible the introduction of all the
wastewater to the biological treatment systems. The reengineering project, considers
design, construction and installation of new API separators and flocculation-DAF systems
in both refineries. The obtained results of the treatability tests indicated that the suggested
pretreatment systems provide the accomplishment of the established MPL for biological
treatment. The averages of the physical-chemical parameters, obtained using one year
operational data of the current biological systems are presented in Table 7. It has to be
mentioned that the nitrification-denitrification AS reactor receive almost 30 L/s domestic
wastewater which is treated in conjunction with the refinery effluent, while the SBR
receive only pretreated refinery effluent. COD and NH
4
-N removal efficiencies of 65% and
96% respectively were obtained in both biological treatment systems. As it can be
expected nitrification-denitrification AS provided higher TKN removal compared with
the SBR, 86% and 68% respectively. The O&G and phenol removals were also higher in
the AS system. The average O&G removal efficiencies were 94%and 86% in AS and SBR
respectively, and the phenol removals were 82% and 70%respectively. Sulphide removal
efficiencies were of 95-96%.
Water Conservation
124
Parameter
SBR in refinery R1
Nitrification-
denitrification AS in
refinery R2
Quality for
cooling water
make up
Influent Effluent Influent Effluent
O&G, mg/L
50.18.4 7.23.4 48.610.3 3.21.8
-
COD, mg/L
45374 15742 38882.5 13735
75
TSS, mg/L
39.39.2 54.115.3 44.412.1 57.619
100
NH
4
-N, mg/L
12.55.4 0.50.3 28.710.5 1.00.9
1
TKN, mg/L
20.33.4 6.42.5 45.25.3 6.22.4
-
Ptotal, mg/L
1.00.1 0.90.1 0.70.1 0.50.1
1
Phenols, mg/L
0.20.05 0.060.02 1.10.8 0.20.1
-
Sulphides, mg/L
11.37.1 0.50.3 27.010.3 1.30.8
-
Hardness, mg
CaCO
3
/L
39752 38544 25344 23824
650
Alkalinity, mg
CaCO
3
/L
12512 10533 10327 8415
350
Table 7. Performance of the biological treatment systems in the studied refineries
One of the reuse options in the refineries is in the cooling tower make-up. The most frequent
water quality problems in cooling water systems are scaling, corrosion, biological growth,
foaming, as well as fouling in the heat exchangers and condensers. To avoid these potential
problems the reclaimed water used in cooling systems must not supply nutrients (nitrogen
and phosphorus) or organics that promote the growth of biofilms. The cooling water must
no lead to the formation of scale (calcium and magnesium precipitation). Mexican refineries
use recirculating cooling systems and the quality of the water input is of big concern. The
comparison of the water characteristics of the secondary effluents (Table 8) with the quality
requirements for cooling water make-up (US EPA, 1980) indicated that the concentrations of
TSS, NH
4
-N, P, Hardness and Alkalinity were lower than the suggested ones. The effluent
COD was higher than the suggested value, however the organic matter present in the
secondary effluent is constituted basically of compounds difficult for biodegradation. This
organic matter could difficultly improve the biofilm growth. Therefore the secondary
effluent could be used in the cooling system. Generally, all water reuse for cooling water
make-up uses a lime clarification process prior to reuse (US EPA, 1989). This process can
reduce hardness, phosphates, silicates and colloidal organics. Filtration is frequently
recommended after the liming process.
Advanced treatment facilities were already implemented in the studied refineries. The
refinery R1 has lime softening (LS) reactors; pressure sand filters (F) and reverse osmosis
(RO) system. Lime, soda ash and flocculant are used in the liming process. The effluent is
acidified and then passed through the filters. Then the filtered effluent is submitted to a
chlorine disinfection and send to a storage tank for its reuse in the cooling system of the
refinery. Part of this water (86 L/s) is directed to the reverse osmosis system and the
desalted water is supplied for use in different oil refining processes. The characteristics of
the effluents from the advanced treatment processes are presented in Table 8. As it can be
seen the liming process followed by filtration enhanced the water quality of the secondary
effluent. This treatment allowed Hardness removal of 80%, TSS removal of 74%, Si removal
of 71%and a complete P, O&G, S
2-
and phenol removals. Additionally, COD removal
Water Management in the Petroleum Refining Industry
125
efficiency of 48% was obtained and this way COD was reduced to 86 mg/L after liming and
filtration. The obtained water quality is perfectly proper for their reuse in the cooling
system. The reverse osmosis system provided 93% TDS removal and 82% hardness removal.
COD was reduced to 31 mg/L and the rest of the characteristic pollutants were not detected
in the effluent. The obtained water quality allows the use of the RO effluent in most of the
production processes.
Advanced treatment in R1 Advanced treatment in R2
Influent LS F RO Influent UF RO
O&G, mg/L
7.23.4 2.10.2
ND ND
3.21.8
ND ND
COD, mg/L
15742 9733 8631 317 13735 9232 285
TSS, mg/L
5415 458 146
ND
5719 21
ND
NH
4
-N, mg/L
0.50.3 0.40.1 0.40.1
ND
1.00.9 1.00.2
ND
TKN, mg/L
6.42.5 5.31.8 5.11.1
ND
6.22.4 1.00.3
ND
Ptotal, mg/L
0.90.1
ND ND ND
0.50.1 0.30.1
ND
Phenols, mg/L
0.060.02
ND ND ND
0.20.1 0.10.1
ND
Sulphides, mg/L
0.50.3
ND ND ND
1.30.8 0.20.1
ND
TDS, mg/L
77956 68361 66849 4615 87638 78040 5411
Hardness, mg
CaCO
3
/L
38544 7523 6722 123 23824 22119 397
Alkalinity, mg
CaCO
3
/L
10533 8627 8322 234 8415 8314 235
Si, mg/L
213 65 65
ND
244 234 142
ND-Not detected
Table 8. Performance of the advanced treatment systems in the studied refineries
The refinery R2 has ultrafiltration and inverse osmosis systems. The effluent from the
nitrification-denitrification AS system is disinfected and then submitted to ultrafiltration.
Most of the obtained effluent is directed to the cooling system of the refinery. Part of the
filtered water ( 50 L/s) is submitted to reverse osmosis desalting and after that reused in the
refining processes. The water characteristics after each treatment process are presented in
Table 8. The ultrafiltration removed basically the TSS and O&G, as well as reduced the COD
values and the concentrations of the rest of the water quality parameters. The effluent of the
UF can be used in the cooling systems. The reverse osmosis allowed the same removals of
TDS, hardness and COD as the one in the refinery R1 and the obtained water can be used in
the production processes.
The performed analysis demonstrates that both refineries have the capacity to obtain two
water qualities reclaimed water for reuse. The reengineering of the existing pretreatment
systems will ensure the obtaining of water with proper quality to be submitted to the
existing already biological and advanced treatment. This way all the wastewater could be
treated and that will make feasible the implementation of the proposed new water
management options in both refineries.