Báo cáo hóa học: " Assessing motor deficits in compressive neuropathy using quantitative electromyography" potx
Bạn đang xem bản rút gọn của tài liệu. Xem và tải ngay bản đầy đủ của tài liệu tại đây (326.9 KB, 10 trang )
RESEARC H Open Access
Assessing motor deficits in compressive
neuropathy using quantitative electromyography
Joseph Nashed
1
, Andrew Hamilton-Wright
1
, Daniel W Stashuk
2
, Matthew Faris
3
, Linda McLean
1*
Abstract
Background: Studying the changes that occur in motor unit potential trains (MUPTs) may provide insight into the
extent of motor unit loss and neural re-organization resulting from nerve compression injury. The purpose of this
study was to determine the feasibility of using decomposition-based quantitative electromyography (DQEMG) to
study the pathophysiological changes associated with compression neuropathy.
Methods: The model used to examine compression neuropathy was carpal tunnel syndrome (CTS) due to its high
prevalence and ease of diagnosis. Surface and concentric needle electromyography data were acquired
simultaneously from the abductor pollicis brevis muscle in six individuals with severe CTS, eight individuals with
mild CTS and nine healthy control subjects. DQEMG was used to detect intramuscular MUPTs during constant-
intensity contractions and to estim ate parameters associated with the surface- and needle-detected motor unit
potentials (SMUPs and MUPs, respectively). MUP morphology and stability, SMUP morphology and motor unit
number estimates (MUNEs) were compared among the groups using Kruskal-Wallis tests.
Results: The severe CTS group had larger amplitude and longer duration MUPs and smaller MUNEs than the mild
CTS and control groups , suggesting that the individuals with severe CTS had motor unit loss with subsequent
collateral reinnervation, and that DQEMG using a constant-intensity protocol was sensitive to these changes. SMUP
morphology and MUP complexity and stability did not significantly differ among the groups.
Conclusions: These results provide evidence that MUP amplitude parameters and MUNEs obtained using DQEMG,
may be a valuable tool to investigate pathophysiological changes in muscles affected by compressive motor
neuropathy to augment information obtained from nerve conduction studies. Although there were trends in many
of these measures, in this study, MUP complexity and stability and SMUP parameters were, of limited value.
Background
Compression neuropathies are extremely prevalent [1]
and are associated with a wide array of sensory and
motor deficits [2]. Nerve conduction studies are us ed to
assess the integrity of motor and sensory nerves through
estimates of nerve conduction velocity and response
amplitudes [3,4]. Unfortunately these electrophysiologi-
cal methods are limited since they do not directly mea-
sure the pathophysiological changes occurring within
the motor unit pool [3,4]. For example, compound mus-
cle action potential (CMAP) amplitude might be
reduced both in cases of conduction block and in cases
of demyelination [3,4]. Studying the changes that occur
at the motor unit level in compressive neuropathies
might be of considerable value in providing insight into
the extent of motor unit loss and neural re-organization
resulting from nerve compression injury. This approach
may therefore significantly augment the information
available from nerve conduction studies.
Quantitative electromyography (EMG) [5-7] may be
used to provide information about the re-organization
of motor units following nerve injury and/or muscle dis-
ease. One such approach, decomposition-based quantita-
tive electromyography (DQEMG), has been shown to be
a valid and reliable [8,9] method and has been used to
assess changes in motor u nit (MU) size, fibre density
and firing rate, as well as differences in MU number
estimates between healthy subjects and patients with
neurologic or myopathic diseases [7,10-13]. The assess-
ment of MU potential (MUP) morphology and stability,
* Correspondence:
1
School of Rehabilitation Therapy, Queen’s University, Kingston, Ontario,
Canada
Full list of author information is available at the end of the article
Nashed et al. Journal of NeuroEngineering and Rehabilitation 2010, 7:39
/>JNER
JOURNAL OF NEUROENGINEERING
AND REHABILITATION
© 2010 Nashed et al; licensee BioMed Central Ltd. This is an Open Access article distributed under the terms of the Creative Commons
Attribu tion License ( which permits unrestricted use, distribution, and reproduction in
any medium, provided the original work is properly cited.
MU number estimates (MUNEs) and MU activation pat-
terns may provide insight into the pathophysiological
processes associated with peripheral nerve compression
injuries; however quantitative EMG techniques have not
been tested for such a purpose.
The purpose of this study was to determine the feasi-
bility of using DQEMG to study motor pathology seen
in compression neuropathy. Carpal tunnel syndrome
(CTS) provides a convenient model of compression neu-
ropathy for such an investigation since nerve conduction
studies can be used to stratify subjects with and without
motor nerve involvement. As such, this study was
designed to compare quantitative EMG data among a
group of subjects with severe CTS (i.e. those with signs
of motor nerve involvement), a group with mild CTS
(i.e. those with nerve compression but no evidence of
motor nerve injury) and a group of healthy control sub-
jects. In particular, we a imed to determine whether
there was measureable evidence of collateral sprouting
or motor axon loss in individuals with severe CTS as
compared to those with mild or no CTS.
Methods
Participants
The study was approved by the Queen’ sUniversity
Health Sciences Research Ethics Board and all subjects
provided informed consent prior to participation. Poten-
tial participants were recruited through advertisements
and physician referral in the Kingston, Ontario (Canada)
community. Volunteers betw een the ages of 18 - 60
[14]. Poten tial participants were screened to ensure that
they had no previous injury to the neck or upper limbs,
no medical diagnosis of neurological or metabolic condi-
tions [15], and no signs or symptoms of cervical radicu-
lopathy or inflammation of the joints of the neck or
upper limb. Those who met these eligibilit y criteria
underwent electrophysiological screening to determine
whether they fit within one of three strata (no CTS,
mild CTS or severe CTS). On arrival at the laboratory,
potential participants underwent Spurling’s compression
and distraction t ests [16]. If their symptoms of pain or
paraesthaesias diminished or were exacerbated during or
following the tests, that participant was excluded from
the study. Subjects with CTS were required to have
symptoms including hand paraesthesias and hypoesthe-
sia or pain in the first three digits [2].
Electrophysiological Examination
Subjects with CTS were included on the basis of a clini-
cal and electrophysiological examination, which classi-
fied them as having either mild or seve re CTS, and
control subjects were required to have no evidence of
sensory or motor nerve conduction abnormalities. Sub-
jects with electrophysiological evidence of moderate
CTS were excluded from the study since clear differen-
tiation betw een subjects with sensory involvement only
and those with both sensory and motor involvement
was desired.
Nerve conduction s tudies were performed using the
Comperio™ (Neuroscan Medical Systems, El Paso,Texas)
Clinical EMG system. Pa lm ar temperatures were moni-
tored and maintained above 30°C for all testing. Prior to
electrode placement, the hand under investigation was
thoroughly cleaned using compound rubbing alcohol
(Life™, Toronto, ON) and gauze pads. Surface EMG sig-
nals were detected using self-adhering electrocardiogram
electrodes ( Harris Healthcare, Hudson, MA) cut in half
to measure 1 cm × 3 cm. A full-sized (2 cm × 3 cm)
electrode was placed on the posterior aspect of the hand
to serve as a reference. Signals were amplified (Neuros-
can Medical Systems, El Paso, TX) with a bandpass filter
of5Hz-5kHz,digitizedandstoredusingtheCom-
perio Software by Neuroscan.
Only the affected upper limb was tested in individuals
with CTS. If both hands were symptomatic, the side
with more severe symptoms was evaluated. All partici-
pants were required to have normal conduction velocity
of both the median and ulnar nerves in the forearm.
Subjects were t hen stratified by CTS severity using the
following criteria:
Healthy: No nerve conduction study based evidence of
sensory or motor impairment.
Mild CTS
prolongation of sensory distal latencies (median mid pal-
mer latency > 2.2 ms or prolongation of the median
mid-palmar CNAP relative to the ulnar mid-palmar
CNAP > 0.4 ms or a difference in latency > 0.5 ms
between median and ulnar SNAPs of digit four); [4,17].
Severe CTS
prolongation of b oth median mo tor (CMAP > 4.4 ms)
and sensory distal latencies (median mid pa lmer latency
> 2.2 ms or prolongation of the median mid-palmar
CNAP relative to the ulnar mid-palmar CNAP > 0.4 ms
or a difference in latency > 0.5 ms between medi an and
ulnar SNAPs of digit four); with either an absent SNAP,
or low amplitude thenar CMAP [4,17].
Experimental Protocol
Demographic data were documented for each partici-
pant, including height, weight, age, occupation and
handedness. Each participant completed a self-adminis-
tered Carpal Tunnel Syndrome Questionnair e [18] to
quantify the functional limitations associated with their
condition, which was used for descriptive purposes.
EMG data were acquired using AcquireEMG™ soft-
ware on the Neuroscan Comperio™ system (Neuroscan
Medical Systems, El Paso, TX). Intramuscular signals
were detected using disposable concentric needle
Nashed et al. Journal of NeuroEngineering and Rehabilitation 2010, 7:39
/>Page 2 of 10
electrodes (Model 740 38-45/N; Ambu Neuroline, Bal-
torpbakken, Ballerup, Denmark) and amplified with a
bandpass of 10 Hz to 10 kHz. Surface signals were
detected using self-adhering 1 cm × 3 cm electrocardio-
gram electrodes (Harris Healthcare, Hudson, MA) and
amplified with a bandpass of 5 Hz to 1 kHz. A monopo-
lar surface electrode configuration was used to record
CMAPs and for data acquisition of SEMG data. The
anode was placed over the belly of the APB muscle and
the cathode was located over the APB tendon.
Subjects were first asked to perform an isometric max-
imum voluntary contraction (MVC) by pushing their
thumb into the examiner’s resistance for 10 s. The root
mean square (RMS) value of the EMG signal over con-
tiguo us 1s intervals was calculated and the highest RMS
value across the 10 s was dete rmined to be the RMS
value of the MVC (RMSMVC).
The concentric intramuscular electrode was then
inserted into the APB such that the tip of the electrode
was located within the muscle and benea th the surface
electrode. Needle and surface EMG data were acquired
simultaneously with sampling rates of 31,250 and 3125
Hz respectively. With the needle in situ, the subject was
instructed to increase the level of i sometric contraction
of the APB until MUPs from several active motor units
were detected. The needle position was then adjusted to
ensure the detection of ‘ sharp’ MUPs with short rise
times, indicating that the needle tip was in close proxi-
mity to a sample of motor units. The amplitude of con-
tractions was described as a percentage of the RMSMVC
although participants were not instructed to contract at a
given percentage of their MVC. Instead subjects were
instructed to increase the contraction intensity until the
aggregate number of MUPs detected per second, as esti-
mated through the number of pulses per second (pps)
was approximately 60 and to maintain this level of con-
traction as consistently as possible throughout a 30 s per-
iod of data acquisition. By standardizing the intensity of
the contraction, participants were contracting their APB
with similar numbers of active motor units. This is
because in healthy or unhealthy APB muscles during low
to moderate levels of activation motor unit firing rates
across active APB motor units are similar (approx. 8 - 12
pps). At the end of the 30 second contraction, the subject
was instructed to relax their muscle while the needle
position was changed to detect MUPs from more superfi-
cial, intermediate, or deep portions of the muscle in an
attempttosamplefromabroaddistributionofMUs.
Data collection from submaximal contractions co ntinued
until at least 30 acceptable MUPs were detected, which
required five to eight contractions from each subject.
The acceptability criteria are discussed below.
DQEMG was used to decompose the needle-detected
EMG data into MUPTs. For each MUPT a MUP template
was calculated using median-trimmed averaging of the 51
most similar MUP samples from the train. The associated
SMUP for each MUPT was estimated using spike trig-
gered averaging of the surface-detected EMG signal, which
used all of the occurrences within the MUPT over the 30 s
data acquisition period [11]. To be included in the data set
and theref ore in subsequent analyses, a SMUP had to be
temporally aligned (within 10 ms) with its corresponding
MUP and verified as a distinct waveform with respect to
the RMS of the signal baseline.
Acceptability Criteria for MUPs and SMUPs
The E MG data from each 30 s contraction was decom-
posed immediately after the contraction was completed
such that the number of acceptable MUPs could be
monitored. As noted above, data collection continued
until at lea st 30 acceptable MUPs were detected from
each subject, which required between 5 and 8 contrac-
tions lasting 30 seconds each.
MUPTs were evaluated during off-line analysis. Two
interrelated criteria were used to determine the accept-
ability of a given MUPT: the variability in the instanta-
neous firing rate versus time plot (generated in the
DQEMG output), and the inter-discharge interval (IDI)
histogram. An acceptable train had at least 51 MUPs
used to create the template, a firing rate in the physiolo-
gical range (8-30 Hz) with a coefficient of variation
lower than 0.20, as well as an inter-discharge interval
(IDI) histogram that was Gaussian-shaped and had a
coefficient o f variation lower than 0.30 [11]. Any
MUPTs identified by DQEMG that did not meet all of
thesecriteriawereexcluded from the analysis. Markers
indicating the onset, negative peak, positive peak and
end of the MUP waveforms, and markers indicating the
onset, nega tive peak onset, negative peak, positive peak,
and end of the SMUP waveforms were automatically
determined by the DQEMG software, but were visually
inspected for accuracy, and manually repositioned if
incorrectly placed.
Data Reduction and Analysis
Motor Unit Potential Morphology
The M UP template parameters included in the analysis
were peak-to-peak amplitude, duration, number of
phases, number of turns and fibre count. Fibre count
was calculated as the number of signific ant peaks in the
acceleration filtered MUP template [7]. The SMUP para-
meters that were included in the analysis were peak-to-
peak amplitude, duration and negative peak area.
Motor Unit Potential Stability Measures
DQEMG algorithms for analyzing the variability of the
MUPs within a MUPT were used to obtain measures of
MUP stability [7]. Across the ensemble of isolated
Nashed et al. Journal of NeuroEngineering and Rehabilitation 2010, 7:39
/>Page 3 of 10
MUPs within a MUPT, acceleration filtering was used to
measur e acceleration variability or jiggle (Ajiggle) [7]. In
addition, the standard deviation of the distances of the
MUPs of a train to its MUP template divi ded by the
mean of the distances of the MUPs of a train to its
MUP, termed the shimmer coefficient of variatio n
(shimmerCov), was calculated as a second measure of
stability. Differences in shape were measured using the
time domain samples of the MUPs and MUP template
as features and the Euclidian distance metric [7].
Motor Unit Number Estimates
Motor unit number estimates (MUNEs) [8] were calcu-
lated by dividing size related parameters of the maxi-
mum C MAP by the same size related p arameter of the
ensemble averaged or mean SMUP (mSMUP) calculated
using the negative peak onset ali gned SMUP s estimated
for the muscle. Three different parameters were used to
calculate MUNEs: peak-to-peak amplitude, negative
peak amplitude and negative peak area.
Statistical Analysis
All data analyses were performed using MINITAB®
Statistical Software (v.15). The MUP and SMUP data
were averaged for each muscle studied to provide aver-
age MUP and SMUP parameter values for each partici-
pant. Due to the small sample size and n on-normal
distribution in many variables, non-parametric statis-
tics were performed and as such, all measures are
described and compared among groups using the med-
ian value and interquartile range (IQR). Between-group
differences were assessed for all data (the questionnaire
data, the MUP and SMUP parameter values and the
MUNEs) using Kruskal-Wallis tests (alpha = 0.05).
Post hoc analyses were performed using Mann-
Whitney U tests.
Results
Subjects
Twenty eight volunteers passed the telephone screening
and agreed to participate in the study. One volunteer
was excluded after clinical evaluation screening because
of suspected r adiculopathy. Two volunteers were
excluded after neurophysiological evaluation as they
were classified as having moderate CTS. Two other
volunteers were excluded due to the discovery that they
had confounding conditions (pregnancy and rheumatoid
arthritis, respectively). In the end, nine men and four-
teen women participated in the study: 9 healthy indivi-
duals (4 men, 5 women), 8 individuals with mild CTS (2
men, 6 women) and 6 individuals with severe CTS (3
men, 3 women). There were no d ifferences in the med-
ian age or sex among the gr oups (Table 1; p > 0.05).
There were signi ficant differences between the duration
of symptoms of ea ch group, however this was expected
(Table1; p < 0.05).
The intensity of the contractions, did not differ signifi-
cantly among the groups (Table 1; p > 0.05). During
EMG signal acquisition, in order to achieve adequate
signal intensity (approximately 60 pps) the isometric
contractions of the severe CTS group were performed at
a significantly higher percentage of their MVC com-
pared to the mild C TS and control groups (Table 1; p <
0.05). This ‘late recruitment’ (i.e. recruitment of motor
units at higher levels of contraction) is in itself an indi-
cation of collateral reinnervation as the muscle adapts
to motor unit loss.
As expected, since the groups were stratified based on
these values, significant group differences were found
for all CMAP characteristics (negative-peak amplitude; p
< 0.05, peak-to-peak amplitude; p < 0.05 and negative-
peak area; p < 0.05) as indicated in Table 2. Post hoc
analysis revealed significant differ ences in these para-
meters between the healthy control group a nd both the
mild (p < 0.05) and severe CTS (p < 0.05) groups for all
three morphological features.
Symptom Severity and Functional Deficits
Data from the Bost on Carpal Tunnel Questionnaire
indicated that there were significant group differences in
symptom severity scores (Severe CTS: 4.0 (IQR: 3.18-
4.45), mild CTS: 3.09 (IQR: 2.91-4.00), control: 1.0 (IQR:
1.00-1.05); p < 0.05) and functionality scores (Severe
CTS: 3.4 ( IQR: 2.6-4.1), mild CTS: 1.2 (IQR: 1 .0-2.1),
control: 1.0 (IQR: 1.0-1.2); p < 0.05). Post hoc analysis
revealed significant group differences in symptom sever-
ity between the healthy control group and both the mild
(p < 0.05) and severe CTS groups (p < 0.05) and in
functionality scores between the severe CTS group and
the healthy control groups (p < 0.05).
Table 1 Demographic data
Group Sex Age (Years) Duration of Symptoms (Months) Intensity (pps) %MVC
Control 4 Men, 5 Women 43.0 (30.0-53.5) 0 (0-0) 12.71 (11.45-15.5) 10.04 (8.84-21.13)
Mild CTS 2 Men, 6 Women 46.0 (41.3-52.5) 5.5(2.3-7.5) 12.86 (11.58-14.95) 13.6 (8.06-21.39)
Severe CTS 3 Men, 3 Women 53.5 (41.3-57.8) 13 (7.0-19.0) 10.52 (1.23-12.56) 39.6 (31.95-44)
Medians and interquartile ranges are presented. * denotes a significant difference from parameters notated with**, pps = pulses per second; MVC = Maximum
Voluntary Contraction
Nashed et al. Journal of NeuroEngineering and Rehabilitation 2010, 7:39
/>Page 4 of 10
MUP Morphology
Significant group differences were found in the MUP
amplitudes (p < 0.05) as identified in Table 3. The
severe CTS group demonstrated larger peak-to-peak
MUP amplitudes compared to the mild CTS and control
groups. There was no differenc e in peak-to-peak MUP
amplitude between the mild CTS and the control
groups.
Similar to the MUP amplitude results , the severe CTS
group demonstrated longer duration MUPs than both
the control and mild CTS groups (Table 3; p < 0.05).
No significant difference in duration was found between
the mild CTS group and the control group (Table 3).
No group differences among the three groups were
found in either the av erage number of phases or turns
seen in the MUPs (Table 3). It is noteworthy, however,
that trends indicating collateral sprouting were evident
in that the severe CTS group tended to have more
phases and turns in their MUPs. Similarly, the Ajiggle,
shimmerCovandfibrecount(Table4)datadidnot
demon strat e any significant differences among the three
groups (p > 0.05), but did show trends whereby the
amount of Ajiggle and ShimmerCov increased with
severity of CTS.
SMUP Morphology
The Kruskal-Wallis tests f ailed to reveal any significant
differences among the groups for any of the SMUP mor-
phology parameters ( amplitude, area, duration) as
demonstrated in Table 3.
MUNE
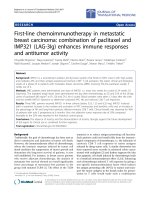
The results of the MUNE calculations are summarized
in Figure 1. Significant group differences were found for
all three methods of calculating the MUNE, whereby
significant group differences were found between the
control group and both the mild and severe CTS groups
(peak to peak amplitude; p < 0.05, negative peak
amplitude; p < 0.05 and negative peak area; p < 0.05).
No significant differences in MUNEs were found
between the mild and severe CTS groups regardless of
the method of calculation. (Figure 1).
Discussion
The purpose of this study was t o determine the feasi-
bilityofusingDQEMGasameansofdetermining
pathophysiological mechanisms associated with motor
deficits in compressive neuropathy. A significant aspect
of the EMG signal detection protocol was that the sub-
jects were instructed to create constant-intensity as
opposed to constant %MVC force contractions. At low
to moderate levels of activation, where motor unit fir-
ing rates are similar, the constant-intensity protocol
results in the activation of similar numbers of motor
units across various sets of muscles. The constant-
intensity protocol will therefore accentuate changes in
motor unit recruitment. For myopathic muscles with
fewer and smaller diameter fibres ‘ early recruitment’
(i.e. recruitment of motor units at lower levels of con-
traction) during constant-intensity protocols will result
in reduced %MVC contractions. In contrast, for neuro-
genic muscle with motor unit loss and collateral rein-
nervation ‘ late recruitment’ during constant-intensity
protocols will result in increased %MVC contractions.
In both cases, eliciting the altered recruitment, which
occurs to compensa te for muscle changes, produces
EMG signals that can be more effectively used to
detect underlying muscle changes. Because %MVC
force measurement is impossible for some muscles and
clinically impractical for most while most clinical EMG
machines now provide an intensity measure, constant-
intensity protocols (albeit at lower levels of intensity
than used in this study) are used during clinical n eedle
EMG examinations. In this study, ‘ late recruitment’
resulted in significant changes in the levels of %MVC
at which the EMG da ta was detected for the severe
Table 2 CMAP morphology
Group Pk-Pk Amplitude (μV) Neg Pk Amplitude (μV) Neg Pk Area (μVms)
Healthy 19797 (17790-23458)* 11830 (10741-12922)* 31468 (29964-41797)*
Mild CTS 12940 (10447-14175)** 7518 (6824-8889)** 22114 (17452-28462)**
Severe CTS 10053 (8242-15437)** 6447 (4884-8311)** 21749 (15994-31206)**
Medians and interquartile ranges are presented.* denotes a significant difference from parameters notated with **, Neg Pk = negative-peak; Pk-Pk = peak-to-peak
Table 3 Needle- and Surface-Detected MUP morphology measures
Needle-detected MUPs Surface-detected MUPs
Group Pk-Pk Amplitude (μV) Duration (ms) No. of Turns No. of Phases Amplitude (mV) Neg Pk Area (mVms) Duration (ms)
Control 410.9 (299.8-490.2)† 6.8 (5.6-9.0)† 3.3 (2.9-3.8) 2.6 (2.3-2.8) 151.0 (123.0-172.0) 263.0 (226.4-321.0) 27.5 (23.5-30.7)
Mild CTS 482.9 (448.1-589.4)† 7.3 (6.4-9.8)† 3.3 (2.9 -3.7) 2.7 (2.2-2.8) 213.5 (104.3-289.3) 341.3 (162.4-467.5) 26.1 (22.2-29.4)
Severe CTS 690.9 (561.4-821.2)* 10.5 (8.2-12.6)* 3.8 (3.1-4.1) 3.0 (2.8-3.5) 284.0 (129.8-420.3) 519.0 (237.0-790.0) 34.2 (28.7-38.7)
Medians and interquartile ranges are presented. * denotes a significant difference from parameters notated with †, Pk-Pk= peak-to-peak; Neg Pk = negative peak
Nashed et al. Journal of NeuroEngineering and Rehabilitation 2010, 7:39
/>Page 5 of 10
CTS group relative to the mild CTS and healthy
groups. In addition, MUP morphology data revealed
that individuals with severe CTS had larger amplitude
and longer d uration MUPs than the other two groups.
Both of these differences are consistent with m otor
unit loss, collateral sprouting and assimilation of
orphaned muscle fibers. No differences were seen in
SMUP morphology or MUP compl exity and stability
between the groups. It is not clear whether MUP com-
plexity and stability measures were not sensitive
enough to detect d ifferences between the groups, or
whether there truly were no differences in MUP com-
plexity and stability between the groups. Both the
CMAPs and MUNEs suggested that individuals with
severe CTS, who were selected based on evidence of
motor deficits obtained from nerve conduction studies,
and those with mild CTS who had no nerve conduc-
tion study based evidence of motor conduction block
or delay (since their CMAPs were within normal lim-
its), had evidence of axonal loss relative to the control
subjects. These results i ndicate that the use of a con-
stant-intensity protocol and DQEMG m ay provide u se-
ful information in the assessment of MUP
morphological changes associated with compressive
neuropathies and may augment information available
from nerve conduct ion studies. In particula r, constant-
intensity based use of DQEMG, by virtue of its ability
to detect differences in MUP morphology may be use-
ful in determining whether a muscle adapts to a com-
pressive neuropathy by using collateral sprouting as
compared to axonal regeneration.
Participants
Subject recruitment for this study proved to be very dif-
ficult despite the high preval ence estimates for CTS [1].
Recruitment was limited particularly by the exclusion
criteria that required individ uals to be between the ages
of 18-60 and to have no other pain complaints or poten-
tially confounding pathology, as well as our decision to
target individuals with mild or severe CTS but not mod-
erate CTS. Consequently, the number of subjects who
participated in each group w as smaller than originally
planned; however, the subject numbers are consistent
with other published literature. For example, Boe et al.
[10] found differences in MUNEs when they compared
data from 10 healthy subjects to 9 patients with amyo-
trophic lateral sclerosis (ALS). In the presen t study,
although the age and sex distributions were not
Table 4 MUP stability measures
Group Fibre Count Ajiggle ShimmerCov
Control 1.5 (1.4-1.7) 0.17 (0.15-0.19) 0.53 (0.45-0.57)
Mild CTS 1.7 (1.6-2.1) 0.19 (0.17-0.22) 0.62 (0.53-0.67)
Severe CTS 1.7 (1.3-2.0) 0.20 (0.15-0.24) 0.63 (0.56-0.71)
Medians and interquartile ranges are presented
Figure 1 Box plots of Abductor Pollicis Brevis MUNE values calculated using the spike triggered average technique. Pk-Pk Amp = peak
to peak amplitude, Neg Pk Amp = negative peak amplitude, Neg Pk Area = negative peak area. Mild = mild CTS group, Severe = severe CTS
group. The boxes represent the interquratile range with the bar within each box representing the median value. The whiskers extend to the
maximum and minimum data points within 1.5 box heights from the top and bottom of the box respectively (* denotes significant differences
between groups)
Nashed et al. Journal of NeuroEngineering and Rehabilitation 2010, 7:39
/>Page 6 of 10
significantly different among the g roups, ideally subjects
would have been matched by age and gender. The small
number of subjects recruited prevented matching. None-
theless, the sample in this study revealed significant
group differences in many of the measures studied.
The questionnaire data revealed that there were simi-
lar symptom severity scores between the severe CTS
group and mild CTS group, and that both groups dif-
fered from the control group. The severe CTS group
had significantly lower functional scores compared to
the healthy contro l group; however the mild CTS group
was not significantly different from either the severe
CTS group or the healthy control group. This result is
not surprising since sensory loss is normally experienced
before motor loss in CTS and as such, the sensory losses
experienced in subjects with mild CTS would be similar
to those sustained by individuals with severe CTS.
Despite the fact that individuals with mild CTS showed
no nerve conduction study based evidence of motor
loss, the functional implications of their sensory loss
explains why their functional scores were not different
from the individuals with severe CTS. The sensory and
functional scores reported in the current study are
within one standard deviation, of the mean values of
those reported by Levine et al [18] in patients with CTS
who were t o undergo surgical repair (Symptom severity:
3.4 ± 0.67; Functional scores: 3.0 ± 0.93).
Evidence of collateral sprouting detected using DQEMG
The shape characteristics of individual MUPs provide
insight into the underlying pathophysiology of neuro-
muscular disease [5,6]. For example, in individuals with
neuropathy, the classic EMG findings are that MUPs
with increased duration and amplitudes indicate that
collateral reinnervation is occurring or has occurred [5].
In these cases, the complexity of the wavef orm, as mea-
sured by the number of turns and/or pha ses may either
be normal or increased [5]. In the early stages of collat-
eral sprouting, MUP duration and co mplexity may be
increased, whereas in later stages complexity normalizes
and amplitude and duration may be unchanged or larger
than normal. Stability measurements can also provide
useful information regarding what is occurring at the
neuromuscular junction, and thus allow inferences
about the state of the MUP. Ajiggle measures the
amount of shape variation across the selected ensemble
of MUP accelerations. Similarly, shimmerCov measures
the variation across an ensembl e of MUPs. Large values
of Ajiggle or shimmerCov may suggest neuromuscular
transmission irregularities [11] and can be indicative of
early collatera l sprouting. Fibre count represe nts the
number of muscle fibres in close proximity to the elec-
trode [11] and, similar to Ajiggle and shimmerCov,
increases in fibre count are indicative of collateral
sprout ing. The results of the current study failed to find
significant differences between the groups for any stabi-
litymeasures.Thelackofsignificancemaybedueto
the lack of s ensitivity of the stability measures used, or
perhaps the three groups had stable neuromuscular
transmission. Since all of our subjects with CTS had
experienced symptoms for at least three months, signs
of early collateral sprouting may have been missed [ 5].
It should be no ted that Ajiggle and ShimmerCov tended
to increase with the severity of CTS (Table 4) which
might indicate that this stu dy was underpo wered in its
ability to detect differences in MUP stability in this
population.
MUP peak-to-peak amplitude is representative of
motor unit size [6]. As such, the larger MUP amplitude
in the severe CTS group as compared to the mild CTS
and control groups suggests that larger motor units
were active during EMG signal detection which in turn
may suggest that collateral sprouting may have occurred
at some point prior to the st udy. Similar differences in
MUP peak-to- peak amplitude were identified in patients
with amyotrophic lateral sclerosis (ALS) using a con-
stant 10% MVC contractio n protocol and DQEMG [10].
However, in contrast to Boe et al. [10], we used a con-
stant-intensity protocol so that the three test groups
activated a similar number of motor units during EMG
signal detection. The intensity of the contraction sig-
nifies t he aggregate num ber of MUPs per second (pps)
seen in the EMG interference pattern and this was not
diff erent among the groups. The constant-intensity pro-
tocol required the severe CTS group to contract at a
higher percentage of their MVC (clo se to 40%) during
EMG data collection than did the control or mild CTS
groups (between 10 and 15% MVC). This resulted in the
recruitment of larger moto r units [18,19] and i s consis-
tent with motor unit loss. This difference in contraction
levels betwee n the severe CTS g roup and the other
groups was not surprising since indiv iduals with severe
CTS by definition had motor axonal loss [ 20] and thus,
in order to generate a n EMG interference pattern of a
set level of intensity (i.e. recruit and suffi cien tly activate
a sufficiently large set of motor units) a contraction at a
higher level of %MVC relative to their pre-disease state
would be required.
In order to investigate the impact of the large differ-
ences in contraction intensity between the study groups
on the resultant MUP amplitudes and durations
recorded from the APB, we recruited an additional sam-
ple (n = 5) of healthy individuals and had them undergo
the EMG data collection procedures previously
described while contracting between 10 and 15% MVC
and again while contracting at 40% MVC. The DQEMG
results indicated that, although the MUP amplitudes
tended to be larger for the higher contraction levels,
Nashed et al. Journal of NeuroEngineering and Rehabilitation 2010, 7:39
/>Page 7 of 10
based on one-way ANOVA results, there was no signifi-
cant difference in the MUP amplitudes b etween the two
contraction levels (F = 2.45; p = 0.156; See Table 5),
which were both substantially lower than the amplitudes
seen in the severe CTS group in our study. There w as
also no difference in MUP duration between the con-
traction levels (F = 0.00; p = 0.96; S ee Table 5), which
again were much smaller than those seen in the severe
CTS group. There were large differences in th e contrac-
tion intensity between the contraction levels (10-15%
MVC: 68 pps; 40% MVC: 82 pps) suggesting that more
(and therefore larger) MUs were recruited for the higher
level contraction.
Both MUP and SMUP duration is thought to be influ-
enced by axonal injury, and have been examined pre-
viously [10], however MUP durations are also heavily
dependent on the distance of the active motor unit to
the recording electrode [5]. In the current study, the
severe CTS g roup had s ignificantly longer MUP dura-
tions as compared to the mild CTS and control groups.
The long MUP durations of the severe CTS group rela-
tive to the mild and control groups again suggests that
the severe group was undergoing or had undergone col-
lateral reinnervation [5].
The results of the current study offer no evidence that
MUPs detected from severe CTS patients have more
complexity than those detected from subjects with no
motor neuropathy. This might have been related to the
high variability inherent in the MUP phase measures
[21-23] or again due to a lack of statistical power result-
ing from the small sample size recruited, since there
was a tendency for the severe CTS group to have more
phases and turns in their MUP waveforms (Table 3).
Other researchers have found low relia bly in determin-
ing MUP onset and end m arkers as compared to the
high reliability found in determining the peaks
[19,21,24]. Calder et al. [19] recently conclude d that
MUP duration (ICC: -0.29) and the number of phases in
the MUP (ICC: -0.69) had poor within-subject reliability.
Also using DQEMG, Boe et al. [10] failed to find a dif-
ference in complexity between healthy individuals and
those with ALS. The number of phases in MUP tem-
plates may not be sensitive enough to be used in the
study of neuromuscular pathology.
Although MUP morphological characteristics offer
insight into the size of the active motor units within a
muscle, they are influenced by limitations of the needle
electrode used to detect them [22]. Estimating motor
unit size and shape using surface EMG electrodes is
thought to be a more robust representation, since there
is a greater number of muscle fibers per motor unit
equally contributing to the surface EMG signal and
therefore to the SMUP template [23], and because the
relative distance from the active muscle fibers to the
detection electrode is essentially the same for all MUs.
Despite the absence of significant differences in SMUP
morphology among the groups, the trends in SMUP
morphology among the groups were similar in pattern
to the group differences seen in the MUP morphology
measures. This finding is particularly obvious in the
SMUP amplitude and area data presented in Table 3.
The lack of statistical significance seen in the SMUP
parameters may be attributed to the large within-group
variability and the small sample size.
Overall, DQEMG appears sensitive enough to deter-
mine differences in MUP amplitudes between groups of
individuals with and without motor nerve impairment
associated with CTS, but in the current study there
were no significant differences in measures of MUP sta-
bility. The differences in MUP morphology without dif-
ferences in MUP stability may reflect that collateral
sprouting occurred more than three months prior to
subjects participating in this study, such that orphaned
muscle fibres had been reinnervated and collateral
sprouts h ad matured. In any event, MUP stability mea-
sures appear to be of less value in this population.
Evidence of Motor axon loss detected using DQEMG
MUNEs provide information about the number of func-
tioning motor axons in a given motor unit pool [25-27].
This information is useful when evaluating the extent of
motor unit loss assoc iated with motor neuron disease or
peripheral neuropathy and when asse ssing the course
and outcome of treatment for these disorders. Using
constant %MVC protocols and DQEMG, has been
found to be a valid, reliable and practical tool for
obtaining MUNEs [8]. However, it has been demon-
strated that as the level of contraction used increases
the MUNE v alues decrease [28]. Boe et al. using a 7%
MVC contraction level on average have determined nor-
mative MUNE values for the APB muscle using SMUP
negative-peak amplitude (269 +/- 104) [8]. The median
Table 5 Impact of contraction level on MUP amplitude in a new sample of healthy subjects
Target Contraction level
(%MVC)
Actual Contraction Level
(%MVC)
Intensity
(PPS)
MUP peak to peak
amplitude (uV)
MUP duration
(ms)
10-15% 12.5 (12.5-14.6) 68 (40-95) 363.6 (232.5-466.3) 6.52 (5.33-8.12)
40 42 (38.9-44.7) 82 (73-137) 474.3 (277.4-522.8) 6.30 (5.24-8.19)
Values presented are medians and ranges. The differences in MUP amplitude between the two contraction lev els were not statistically significant (F-2.45, p =
0.156). * MVC denotes maximal voluntary contraction, PPS denotes pulses per second.
Nashed et al. Journal of NeuroEngineering and Rehabilitation 2010, 7:39
/>Page 8 of 10
MUNE value of the healthy group in the current study,
for which the constant-intensity based protocol resulted
in a 10%MVC contraction on average, falls w ithin one
standard deviation of Boe et al’s reported norm for this
muscle. The MUNE values for the mild and severe CTS
groups are biased to low values because of the higher
level o f %MVC produced during EMG signal detection
and are not anatomically accurate. Nonetheless, they are
valid indicators of motor unit loss when compared to
the MUNE values of the control group obtained using
the same constant-intensity protocol.
In this study there were significant differences in the
all t he CMAP amplitudes and the MUNEs between the
severe CTS and healthy groups as well as the mild CTS
and healthy groups. This result occurred despite the
mild CTS group being screened before the study to
ensure that they had no clinical evidence of motor
involvement [29]. The lack of significant difference
found between the mild CTS group and the severe CTS
group suggests that at least some individuals in the mild
CTS group may have had axonal loss. It is possible,
therefore, that MUNEs may provide a more sensitive
way to detect motor nerve impairment that is not yet
severe enough to be detected using traditional nerve
conduction studies. This should be investigated in future
studies. The fact that the group with mild CTS did not
show evidence of collateral sprouting (increased MUP
amplitude and dur ation relative to the control group)
despite having lower MUNEs might indicate that they
are at a different stage of the disease process than the
severe CTS group.
Unlike other neuropathic conditions such as ALS,
where the neuropathy is known to be degenerative in
nature, nerve compression injuries can cause both
demyelination and axonal loss, both of which can affect
the shape characteristics of a CMAP, making it difficult
to determine which pat hology is most prevalent.
Furthermore, it is possible t hat a portion of the drop in
MUNE values is due to reductio n in CMAP size due to
temporal dispersion of contributing potentials due to
conduction slowing which is not accounted for when
the mean S MUP is calculated using SMUPs extracted
from EMG signal d etected during voluntary contrac-
tions. Inclusion of a stimulation based MUNE technique
might have been informative, but unfortunat ely was not
considered in the design of this experiment. Despite
uncertainty in the underlying cause of reduced CMAP
size, the consistent trend to increased mean SMUP size
across the healthy, mild CTS and severe CTS groups
suggest that the amplitude-based MUNE measures are
sensitive to differences in the number of healthy or
functioning motor units between groups of individuals
with and without a given disorder. In this case the
severe CTS group (i.e. those with evidence of motor
involvement), had lower MUNEs than the mild CTS
and control groups.
Limitations
Sensory, motor, and combined nerve conduction studies
were used to stratify individuals by severity of CTS such
that we had one experimental group with evidence of
motor involvement (s evere CTS), one group with sen-
sory involvement but no motor involvement (mild CTS),
and a control group. Although the specificity of nerve
conduction studies is high, the sensitivities of the differ-
ent tests is quite variable [3]. The literature suggests
that the sensitivities of the motor and mixed nerve con-
duction studies are lower than those of sensory nerve
conduction studies [3,30]. Jablecki et al. [3] reported
that the pooled sensitivity (0.85) of the comparison of
the median and ulnar sensory conduction between the
wrist and the fourth digit proved to be the most sensi-
tive diagnostic test [3]. By co ntrast, comparisons of
median and ulnar mixed nerve conduction between the
wrist and palm and motor conduction studies of median
nerve across the wrist were reported to have lower
pooled sensitivities (0.71 and 0.63 respectively) [3]. It is
therefore possible, that our stratification based on symp-
toms and nerve conduction study results may not have
been accurate in all subjects. In particular, in the cur-
rent study the CMAP morphological features were not
significantly different between the mild and severe CTS
groups despite the fact that subjects were carefully
screened according to the standard guidelines [4].Indivi-
duals with mild CTS in the current study may, in fact,
have had motor deficits that went undetected based on
our criteria. Assessment of abnormal spontaneous activ-
ity would have been helpful to rule out motor nerve
involvement in our subjects with mild CTS.
Conclusions
CTS was used as a convenient model to determine the
feasibility of using a constant-intensity contraction pro-
tocol wit h DQEMG to detect the presence of moto r
neuropathy since n erve conduction studies can suggest
whether or n ot individuals with CTS have motor invol-
vement. Despite the different levels of %MVC across the
study groups elicited by the constant-intensity protocol
the MUPs with significantly larger amplitudes and
longer durations in individuals with severe CTS suggest
motor unit loss and that orphaned muscle fibers in the
participants with severe CTS had undergone collateral
reinnervation, however significant changes in MUP sta-
bility were not detected using DQEMG. Based on the
current findings it appears that quantitative EMG may
be a sensitive measure to detect MUP morphological
changes in individuals with compressive neuropathy but
not necessarily changes in MUP complexity or stability.
Nashed et al. Journal of NeuroEngineering and Rehabilitation 2010, 7:39
/>Page 9 of 10
A much larger study would be required in o rder to
determine the sensitivity and specificity of this approach.
The MUNE results suggest that individuals with
severe CTS experience a loss in the number of function-
ing motor units. The lower MUNEs found in the mild
CTS group as compared to the healthy control group
suggest that traditional nerve conduction studies may
not be as sensitive to subtle motor impairments that
may result from early demyelination as are MUNEs and
MUP morphological feature values obtained using
DQEMG.
Abbreviations
CTS: carpal tunnel syndrome; ABP: Abductor Pollicis Brevis; DQEMG:
decomposition-based quantitative electromyography; EMG:
electromyographyl; RMS: root mean square; MU: motor unit ; MUP: needle-
detected motor unit potential; MUPT: motor unit potential train; MUNE:
motor unit number estimate; MVC: maximal voluntary contraction; SMUP:
surface-detected motor unit potential; CMAP: compound muscle action
potential; CNAP: compound nerve action potential; ALS: amyotrophic lateral
sclerosis; SNAP: sensory nerve action potential; RMSMVC: RMS value of the
MVC.
Author details
1
School of Rehabilitation Therapy, Queen’s University, Kingston, Ontario,
Canada.
2
Department of Systems Design Engineering, University of Waterloo,
Waterloo, Ontario, Canada.
3
Physical Medicine and Rehabilitation, Queen ’ s
University, Kingston, Ontario, Canada.
Authors’ contributions
JN and AHW carried out the recruitment and testing of participants,
acquisition of data, analysis and interpretation of data. JN drafted the
manuscript. MF aided in recruitment of participants as well as analysis and
interpretation of data. LM and DWS conceptualized the research question
and study design, and provided guidance in terms of data acquisition,
analysis and interpretation. LM was the senior researcher and principal
investigator of the research study. All authors read and approved the final
manuscript.
Competing interests
The authors declare that they have no competing interests.
Received: 22 December 2009 Accepted: 11 August 2010
Published: 11 August 2010
References
1. Atroshi I, Gummesson C, Johnsson R, Ornstein E, Ranstam J, Rosen I:
Prevalence of carpal tunnel syndrome in a general population. Jama
1999, 282:153-158.
2. Atroshi I, Gummesson C, Johnsson R, Sprinchorn A: Symptoms, disability,
and quality of life in patients with carpal tunnel syndrome. J Hand Surg
[Am] 1999, 24:398-404.
3. Jablecki CK, Andary MT, So YT, Wilkins DE, Williams FH: Literature review of
the usefulness of nerve conduction studies and electromyography for
the evaluation of patients with carpal tunnel syndrome. AAEM Quality
Assurance Committee. Muscle Nerve 1993, 16:1392-1414.
4. Stevens JC: AAEM minimonograph #26: the electrodiagnosis of carpal
tunnel syndrome. American Association of Electrodiagnostic Medicine.
Muscle Nerve 1997, 20:1477-1486.
5. Stalberg E, Nandedkar SD, Sanders DB, Falck B: Quantitative motor unit
potential analysis. J Clin Neurophysiol 1996, 13:401-422.
6. Stashuk D, Brown WF: Quantitative electromyography. Neuromuscular
function and disease: basic, clinical, and electrodiagnostic aspects
Philadelphia: WB SaundersBrown WF, Bolteon C, Aminoff M 2002.
7. Stashuk DW: Decomposition and quantitative analysis of clinical
electromyographic signals. Med Eng Phys 1999, 21:389-404.
8. Boe SG, Stashuk DW, Doherty TJ: Motor unit number estimation by
decomposition-enhanced spike-triggered averaging: control data, test-
retest reliability, and contractile level effects. Muscle Nerve 2004,
29:693-699.
9. Doherty TJ, Stashuk DW: Decomposition-based quantitative
electromyography: methods and initial normative data in five muscles.
Muscle Nerve 2003, 28:204-211.
10. Boe SG, Stashuk DW, Doherty TJ: Motor unit number estimates and
quantitative motor unit analysis in healthy subjects and patients with
amyotrophic lateral sclerosis. Muscle Nerve 2007, 36:62-70.
11. Stashuk D: EMG signal decomposition: how can it be accomplished and
used? J Electromyogr Kinesiol 2001, 11:151-173.
12. Calder KM, Stashuk DW, McLean L: Physiological characteristics of motor
units in the brachioradialis muscle across fatiguing low-level isometric
contractions. J Electromyogr Kinesiol 2008, 18:2-15.
13. Calder KM, Stashuk DW, McLean L: Motor unit potential morphology
differences in individuals with non-specific arm pain and lateral
epicondylitis. J Neuroeng Rehabil 2008, 5:34.
14. Stetson DS, Albers JW, Silverstein BA, Wolfe RA: Effects of age, sex, and
anthropometric factors on nerve conduction measures. Muscle Nerve
1992, 15:1095-1104.
15. Spinner RJ, Bachman JW, Amadio PC: The many faces of carpal tunnel
syndrome. Mayo Clin Proc
1989, 64:829-836.
16. Magee DJ: Orthopedic Physical Assessment. Saunders, 4 2002, 133-147.
17. Preston DC, Shapiro BE: Electromyography and Neuromuscular Disorders.
Philadelphia, PA: Elsevier Butterworth Heinmann, 2 2005, 25-143.
18. Levine DW, Simmons BP, Koris MJ, Daltroy LH, Hohl GG, Fossel AH, et al: A
self-administered questionnaire for the assessment of severity of
symptoms and functional status in carpal tunnel syndrome. J Bone Joint
Surg Am 1993, 75:1585-1592.
19. Calder KM, Agnew MJ, Stashuk DW, McLean L: Reliability of quantitative
EMG analysis of the extensor carpi radialis muscle. J Neurosci Methods
2008, 168:483-493.
20. Sunderland S: Nerves and Nerve Injuries. New York, NY: Churchill
Livingstone, 2 1978, 69-98.
21. Takehara I, Chu J, Li TC, Schwartz I: Reliability of quantitative motor unit
action potential parameters. Muscle Nerve 2004, 30:111-113.
22. Nandedkar SD, Barkhaus PE, Sanders DB, Stalberg EV: Analysis of amplitude
and area of concentric needle EMG motor unit action potentials.
Electroencephalogr Clin Neurophysiol 1988, 69:561-567.
23. Stalberg E: Macro EMG, a new recording technique. J Neurol Neurosurg
Psychiatry 1980, 43:475-482.
24. Chu J, Takehara I, Li TC, Schwartz I: Skill and selection bias has least
influence on motor unit action potential firing rate/frequency.
Electromyogr Clin Neurophysiol 2003, 43:387-392.
25. Brown WF, Strong MJ, Snow R: Methods for estimating numbers of motor
units in biceps-brachialis muscles and losses of motor units with aging.
Muscle Nerve 1988, 11:423-432.
26. Doherty T, Simmons Z, O’Connell B, Felice KJ, Conwit R, Chan KM, et al:
Methods for estimating the numbers of motor units in human muscles.
J Clin Neurophysiol 1995, 12:565-584.
27. Daube JR: Motor unit number estimates–from A to Z. J Neurol Sci 2006,
242:23-35.
28. Boe SG, Stashuk DW, Brown WF, Doherty TJ: Decomposition-based
quantitative electromyography: effect of force on motor unit potentials
and motor unit number estimates. Muscle Nerve 2005, 31:365-373.
29. Keir PJ, Rempel DM: Pathomechanics of peripheral nerve loading.
Evidence in carpal tunnel syndrome. J Hand Ther 2005, 18:259-269.
30. Jablecki CK, Andary MT, Floeter MK, Miller RG, Quartly CA, Vennix MJ, et al:
Practice parameter: Electrodiagnostic studies in carpal tunnel syndrome.
Report of the American Association of Electrodiagnostic Medicine,
American Academy of Neurology, and the American Academy of
Physical Medicine and Rehabilitation. Neurology 2002,
58:1589-1592.
doi:10.1186/1743-0003-7-39
Cite this article as: Nashed et al.: Assessing motor deficits in
compressive neuropathy using quantitative electromyography. Journal
of NeuroEngineering and Rehabilitation 2010 7:39.
Nashed et al. Journal of NeuroEngineering and Rehabilitation 2010, 7:39
/>Page 10 of 10