Báo cáo hóa học: " Spatial and temporal EEG dynamics of dual-task driving performance" pdf
Bạn đang xem bản rút gọn của tài liệu. Xem và tải ngay bản đầy đủ của tài liệu tại đây (626.7 KB, 13 trang )
RESEARCH Open Access
Spatial and temporal EEG dynamics of dual-task
driving performance
Chin-Teng Lin
1,2
, Shi-An Chen
1,2
, Tien-Ting Chiu
1
, Hong-Zhang Lin
1
, Li-Wei Ko
1,3*
Abstract
Background: Driver distraction is a significant cause of traffic accidents. The aim of this study is to investigate
Electroencephalography (EEG) dynamics in relation to distraction during driving. To study human cognition under
a specific driving task, simulated real driving using virtual reality (VR)-based simulation and designed dual-task
events are built, which include unexpected car deviations and mathematics questions.
Methods: We designed five cases with different stimulus onset asynchrony (SOA) to investigate the distraction
effects between the deviations and equations. The EEG channel signals are first converted into separated brain
sources by independent component analysis (ICA). Then, event-related spectral perturbation (ERSP) changes of the
EEG power spectrum are used to evaluate brain dynamics in time-frequency domains.
Results: Power increases in the theta and beta bands are observed in relation with distraction effects in the frontal
cortex. In the motor ar ea, alpha and beta power suppressions are also observed. All of the above results are
consistently observed across 15 subjects. Additionally, further analysis demonstrates that response time and
multiple cortical EEG power both changed significantly with different SOA.
Conclusions: This study suggests that theta power increases in the frontal area is related to driver distraction and
represents the strength of distraction in real-life situations.
Background
Driver distraction has been identified as the leading
cause of car accidents. The U.S. National Highway Traf-
fic Safety Administration had reported driver distraction
as a high priority area about 20-30% of car accidents
[1]. Distraction during driving by any cause is a signifi-
cant contributor to road traffic accidents [2,3]. Driving
is a complex task in which several skills and abilities are
simultaneously involved. Distractions found during driv-
ing are quite widespread, including eating, drinking,
talking with passengers, using cell phones, reading,
feeling fatigue, solving problems, and using in-car equip-
ment. Commercial vehicle operators with complex in-
car technologies also cause an increased risk as they
may become increasingly distracting in the years to
come [4,5]. Some literature st udied the behavioral effect
of driver’s distraction in car. Tijerina showed driver dis-
traction from measurements of the static completion
time of an in-vehicle task [6]. Similarly, distraction
effects caused by talkin g on cellular phones during driv-
ing have been a focal point of recent in-car studie s
[7-9]. Experimental studies have been conducted to
assess the impact of specific types of driver distraction
on driving performance. Though these studies gener ally
reported significant driving impairment, simulator stu-
dies cannot provide information about accidents due to
impairment resulting in hospitalization of the driver
[10,11]. To provide information before the occur rence
of crashes, the drivers’ physiological responses are inves-
tigated in this paper. However, monitoring drivers’
attention-related brain resources is still a challenge for
researchers and practitioners in the field of cognitive
brain research and human-machine interaction.
Regarding neural physiological investigation, some lit-
erature focused on the brain activities of “divided atten-
tion,” referring to attention divided between two or
more sources of information, such as visual, auditory,
shape, and color stimuli. Positron emission tomography
(PET) measurements were taken while subjects discrimi-
nated among shape, color, and speed of a visual s timu-
lus u nder conditions of selective a nd divided attentio n.
* Correspondence:
1
Brain Research Center, National Chiao-Tung University, Hsinchu, Taiwan
Full list of author information is available at the end of the article
Lin et al. Journal of NeuroEngineering and Rehabilitation 2011, 8:11
/>JNER
JOURNAL OF NEUROENGINEERING
AND REHABILITATION
© 2011 Lin et al; licensee BioMed Cent ral Ltd. This is an Open Access article distributed under the terms of the Creative Commons
Attribution Lice nse ( which permits unrestricted use, distribution, and reproduction in
any medium, provided the original work is properly cited.
The divided attention condition activate d the anterior
cingulated and prefrontal cortex in the right hemisphere
[12]. In another study, functional magnetic resonance
imaging (fMRI) was used to investigate brain activity
during a dual-task (visual stimulus) experiment. Findings
revea led activati on in the posterior dorsolateral prefron-
tal cortex (middle frontal gyrus) and lateral parietal cor-
tex[13].Inaddition,severalneuroimagingstudies
showed the importance of the prefrontal network in
dual-task management [14,15]. Some studies investi-
gated traffic scenarios recorded the EEG to compare
P300 amplitudes [16]. During simulated traffic scenarios,
resource allocation was assessed as an event-related
potential (ERP) novelty oddball paradigm [17]. I n these
EEG studies, however, only the time course was ana-
lyzed. Deiber took one more step to analyze the relation
between time and frequency courses [18]. Their study
used EEG to investigate mental arithmetic-induced
workload and found theta band power increases in areas
of the frontal cortex. Despite so much research on brain
activities , the above-mentioned studies only investigated
brain activities during dual-task interactions without
considering the SOA problem during driving, which is
with the temporal gap between presentations of two sti-
muli. When dual tasks are presented within a short
SOA, the response time of each task is typically lower
than that presented within a longer SOA [19]. There-
fore, the current study inv estigates the effects of the dif-
ferent temporal relationships of stimuli.
Clinical practices as well as basic scientific studies
have been using the EEG for 80 years. Presently, EEG
measurement is widely used as a standard procedure in
research such as sleep studies, epileptic abnormalities,
and other disorder diagnoses [20,21]. Compared to
another widely used neuroim aging modality, fMRI, the
EEG is much less expensive and has superior temporal
resolution in investigating SOA problems. To avoid
interference and decrease risks whil e operating a vehicle
on the road, researchers adopted driving simulations for
vehicle design. Studies of driver’s behavior and cognitiv e
states are also expanding rapidly [22]. However, static
driving simulation c annot fully create real-life driving
conditions, such as the vibrations experienced when
driving an actual vehicle on the roa d. Therefore, the
VR-based simulation with a motion platfo rm was devel-
oped [23,24]. This VR technique allows subjects to
interact directly with a virtual environment rather than
only monotonic auditory or visual stimuli. Integrating
realistic VR scenes with visual stimuli makes it easy to
study the brain response to attention during driving.
Therefore, in recent years, VR-based simulation com-
bined with EEG monitoring is a recent and beneficial
innovation in cognitive engineering research.
The main goal of this study is to investi gate the brain
dynamics related to distraction by using EEG and a
VR-based realistic driving environment. Unlike previous
studies, the experiment design has three main character-
istics. First, the SOA experimental design, with different
appearance times of two tasks, has the benefit of investi-
gating the dr iver’s behavioral and physiologic al response
under multiple conditions and multiple d istraction
levels. Second, ICA-based advanced analysis methods
are used to extract brain responses and the cortical loca-
tion related to distraction. Third, this study investigates
the interaction and effects of dual-task-related brain
activities, in contrast to a single task.
Methods
Subjects
Fifteen healthy participants (all males), between 20 and
28 years of age, were recruited from the university popula-
tion. They have normal or corrected-to-normal vision, are
right handed, have a driver’s license, and are reported
being free from psychiatric or neurological disorders.
Written informed consent was obtained prior to the study.
Each subject participated in four simulated sessions
inside a car with hands on the steering wheel to keep
the car in the center of the third lane, which was num-
bered from the left lane, in a VR surround scene on a
four-lane freeway [23]. Thirty scalp electrodes (Ag/AgCl
electrodes with a unipolar reference at the right earlobe)
by the NuAmp system (Compumedics Ltd., VIC,
Australia) were mounted on the subject’s head to record
the physiological EEG [25]. The EEG electrodes were
placed ba sed on a modified international 10-20 system.
The contact impedance between EEG electrodes and the
cortex was calibrated to be less than 10 kΩ.Before
beginning first session, each subject took a 15 ~ 30 min-
ute for prac tice session. In each session, subjects pro-
ceeded to a freeway simulated driving lasting fifteen
minutes with the corresponding EEG signals synchro-
nously recorded. For these four-session experiments,
subjects were required to rest for ten minutes between
every two sessions to avoid fatigue.
Recordings and experimental conditions
For this study, a simulated freeway scene was built using
VR technology with a WTK library on a 6 DOF motion
platform [23]. The four-lane freeway scene was dis-
played on a surrounded environment. Since the main
purpose of this paper is to investigate distrac tion effects
in dual-task conditions, two tasks involving unexpected
car deviations and mathematical questions were
designed. In the driving task, the car frequently and ran-
domly drifted from the center of the third lane. Subjects
were required to steer the car back to the center of the
Lin et al. Journal of NeuroEngineering and Rehabilitation 2011, 8:11
/>Page 2 of 13
third lane. This task mimicked the effects of driving on
a non-ideal road surface. In the mathematical task, two-
digit addition equations were presented to the subjects.
The answers were designed to be eithe r valid or invalid.
Subjects were asked to press the right or left button on
the steering wheel corresponding to on correct or incor-
rect equations, respectively. The allotment ratio of cor-
rect-incorrect equations was 50-50. The choice of
mathematic task was motivated by the desire for control
in the task demands [26]. All drivers could perform this
mathematic task well without training.
To investigate the effects of SOA between two tasks,
the combinations of these two tasks were designed to
provide different distracting conditions to the subjects
as shown in Figure 1. Five cases were developed to
study the interaction of the two tasks. The bottom insets
show the onset sequences of two tasks. Therefore, this
study investigated the relationship of math task and
driving task and how two tasks affected each other in
the SOA conditions.
Statistical analysis of behavior performance
After recording the behavior data, statistica l package for
the social science (SPSS) Version 13.0 for Windows soft-
ware is applied to estimate the significance testing of
behavior data. The response time of these two tasks (the
driving deviation and the math equation) is analyzed to
study the behavior of subjects in the experiments.
Using ANOVA (analysis of variance), the significances
of the response time of these two tasks are tested for
every subject. A non-parametric test is also utilized to
study the trends of the behavior data. Firstly, this study
excluded outliers, comprising around 6.57% of all trials,
based on the criteria that response time was distributed
outside the mean response time plus three times the
standard deviation of each single session. Secondly, the
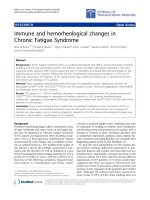
Figure 1 The illustration shows the relationship of occurrences between the deviation and math tasks. D: deviation task onset. M: math
task onset. (a) Case 1: math task presents 400 ms before the deviation task onset. (b) Case 2: math and deviation tasks occur at the same time.
(c) Case 3: math task presents 400 ms after the deviation task onset. (d) Case 4: only math task presents. (e) Case 5: only deviation task occurs.
The bottom insets show the onset sequences of the two tasks.
Lin et al. Journal of NeuroEngineering and Rehabilitation 2011, 8:11
/>Page 3 of 13
number of trials in one of five cases which is minimal is
chosen to make a benchmark to randomly select the
same number of trials in other cases. Thirdly, a single
task is taken for the baseline to normalize the behavior
data to be
Xi
Xmean
(Xi: mean of response time in case
i, Xmean: mean of response time in single case). For
example, in order to compare the distraction effects
from the math equation, case 4 (the single math task) is
the baseline.
Measurement of distraction effects in dual-task EEG time
series
EEG epochs are extracted from the recorded EEG sig-
nals with 16-bit quantization, at the sampling rate of
500 Hz. The data are then preproc essed using a simple
low pass filter with a cut-off frequency of 50 Hz to
remove line noise and other high frequency noise. One
more high-pass filter with a cut-off frequency of 0.5 Hz
is utilized to remove DC drift. This study ado pts ICA to
separate independent brain sources [27-29]. ERSP tech-
nology is then applie d to these independent component
(IC) signals (separated independent brain sources) to
transfer the signal into the time-frequency domain for
the event-related frequency study. Finally, the stability of
component activations and scalp topographies of mean-
ingful components are investigated with component
clustering technology . Because different cases with var-
ious combinations of driving and the math tasks are
designed, EEG responses from five different cases are
extracted separately.
EEG source segregation, identification, and localization
is very difficult because EEG data collected from the
human scalp induce brain activities wi thin a l arge brain
area. Although the conductivity between the skull and
brain is different, the spatial “ smearing” of EEG data
caused by volume conduction does not cause a signifi-
cant time delay. This suggests that ICA algorithm is sui-
table for performing blind source separation on EEG
data. The first applications of ICA to biomedical time
series analysis were presented by Makeig and Inlow
[30]. Their report shows s egregation of eye movements
from brain EEG phenomena, and separates EEG data
into constituent components defined by spatial stability
and temporal independence. Subsequent technical
experiments demonstrated that ICA could also be used
to remove artifacts from both continuous and event-
related (single-trial) EEG data [27,28]. Presumably,
multi-channel EEG recordings are mixtures of underly-
ing brain sources and artificial signals. By assuming that
(a) mixing medium is linear and propagation delays are
negligible,(b)thetimecoursesofthesourcesareinde-
pendent, and (c) the number of sources is the same as
the number of sensors; that is, if there are N sensors,
the ICA algorithm can separate N sources [27].
The time sequences of ICA component signals are
subjected to Fast Fourier Transform with overlapped
moving windows. In addition, the spectrum in each
epoch is smoot hed by 3-window (768 points) mo ving-
average to reduce random errors. The spectrum prior to
event onsets is considered as the baseline spectrum for
ever y epoch. The mean of the baseline spectrum is sub-
tracted from the power spectral after stimulus o nsets so
spectral “perturbation” can be visualized. This procedure
is then applied repeatedly to every epoch. The results
are averaged to yield ERSP images [31]. These measures
can evaluate averaged dynamic changes in amplitudes of
the broad band EEG spectrum as a function of time fol-
lowing cognitive events. The ERSP images mainly show
spectral differences after an event since the baseline
spectrum prior to event onsets had been removed. After
performing a bootstrap analysis (usually 0.01 or 0.03 or
0.05; here 0.01 was applied) on ERSP, only statistically
significant (p < 0.01) spectral changes are shown in the
ERSP images. Non-si gnificant time/frequency points are
masked (replaced with zero). Consequently, any pertur-
bations in the frequency domain become relatively
prominent.
To study the cross-subj ect componen t stability of ICA
decomposition, components from multiple subjects are
clustered, based on their spatial distributions and EEG
characteristics. However, components from different
subjects differ in many ways such as scalp maps, power
spectrum, E RPs and ERSPs. Some studies attempted to
solve this problem by calculating similarities among dif-
ferent ICs [32-34]. Based on these studies, ICs of inter-
est a re selected and clustered semi-automatically based
on their scalp maps, dipole source locations, and within-
subject consistency. To match scalp maps of ICs within
and across subjects in this paper, the gradients of the IC
scalp maps from different sessions of the same subject
are computed and grouped together based on the high-
est correlations of gradients of the common electrodes
retained in all sessions. For dipole source locations, DIP-
FIT2 routines from EEGLAB are used to fit single dipole
source models to the remaining IC sc alp topographies
using a four-shell spherical head model [35]. In the DIP-
FIT software, the spherical head model is co-registered
with an average brain model (Montreal Neurological
Institute) and returns approximate Talairach coordinates
for each equivalent dipole source.
Results
Behavior performance
To investigate the overall behavior index, this study uses
nonparametric tests because several extremely large
Lin et al. Journal of NeuroEngineering and Rehabilitation 2011, 8:11
/>Page 4 of 13
scores are signi ficantly skewed. Firstly, the trials of data
are randomly selected to have the same number of the
trials in all cases. Then, the response time of the devia-
tion an d math tasks in the five cases are normalized to
correspond to single-deviation and single-math cases,
respectively. SPSS software is used for the Friedman
test, and the results of which are shown in Figure 2.
Dual-task cases are marked for easy discrimination from
single-task cases.
To know how the cases make the differences, the Stu-
dent-Newman-Keuls test is used for the post hoc test (in
Table 1). The test statistic on response time of math tasks
in cases 1-4, is c
2
(3) = 903.926 from the Friedman’s
ANOVA test, and p < 0.01. The Student- Newman-Keuls
test show three significant groups: case 1 with case 2, case
3, and case 4 in which the response time for math task in
case 1 is the longest. Statistical test results of the response
time for deviation tasks in cases 1-3, and case 5, is c
2
(3) =
493.98 from the Friedman’ sANOVAtest,andp<0.01.
Using the Student- Newman-Keuls test, th ere are two sig-
nificant groups: case 1, and the other cases in which the
response time for deviation task in case 1 is the shortest.
Independent component clustering
EEG epochs are extracted from the recorded EEG sig-
nals. Then, ICA is utilized to decompose independent
brain sources from the EEG epochs. Based on distrac-
tion effects in this study, many brain resources are
involved in this experiment. Especially, the m otor com-
ponent is active when subjects are steering the car. At
the same time, activations related to attention in the
frontal component appear. Therefore, ICA components,
including frontal and motor, are selected for IC cluster-
ing to analyze cross-subject data based on their EEG
characteristics.
At first, IC clustering groups massive components
from multiple sessions and subjects into several signifi-
cant clusters. Cluster analysis, k-means, is applied to the
normalized scalp topographies and power s pectra of all
450 (30 channels × 15 subjects) components from the
15 subjec ts. Cluster analysis identifies at least 7 compo-
nent clusters having similar power spectra and scalp
projections. These 7 distinct component clusters con-
sisted of frontal, central midline, parietal, left/right
motor and left/right occipital. Table 2 gives the number
of components in different clusters. This investigation
uses the frontal and left motor components to analyze
distraction effects. Figure 3 shows the scalp maps and
equivalent dipole source locations f or fontal and left
motor clusters. Based on this finding, the EEG sources
of different subjects in the same cluster are from the
same physiological component.
Figure 2 This shows the bar charts of normalized response times. (a) for the math task and (b) for deviation task across 15 subjects. The
filled black bar: case 1; dark gray bar: case 2; light gray bar: case 3; the open bar: single case. The response time for math task in dual-task cases
(case 1, case 2, and case 3) is significantly longer than that for in single task (case 4). The shortest response time for the math onset is in case 4.
The response time for deviation task in case 1 is significantly shorter than those in other cases. The longest response time to the deviation onset
is in case 5. The bottom insets show the onset sequences of the two tasks.
Lin et al. Journal of NeuroEngineering and Rehabilitation 2011, 8:11
/>Page 5 of 13
Table 2 The Number of Components in Different Clusters
Frontal Central
Midline
Parietal Left
Motor
Right
Motor
Left
Occipital
Right
Occipital
Number of components 14 12 9 11 8 6 4
Figure 3 The scalp maps an d equivalent dipole source locations after IC clustering across 15 subjec ts. (a) the frontal components and
(b) the left motor components are shown here. There are 14 subjects in the frontal cluster and 11 subjects in the left motor cluster. The grand
scalp map is the mean of the total component maps in each cluster. The smaller maps are the individual scalp maps. The right panels (c) and
(d) show the 3-D dipole source locations (colored spheres) and their projections onto average brain images. The colored source locations
correspond to their own scalp maps by the same color of the text above.
Table 1 The normalized response time to deviation and math
Case Response time to deviation Response time to math
Mean Standard
deviation
Difference
(dual-single)
Mean Standard
deviation
Difference
(dual-single)
Case 1 0.9480 0.1314 p < 0.01 1.1479 0.3061 p < 0.01
Case 2 0.9856 0.1269 p > 0.01 1.1277 0.2724 p < 0.01
Case 3 0.9865 0.1231 p > 0.01 1.0975 0.2727 p < 0.01
Single (baseline) 1 0.1553 1 0.2168
Lin et al. Journal of NeuroEngineering and Rehabilitation 2011, 8:11
/>Page 6 of 13
Frontal and left motor clusters
Figure 4a shows the cross-subject averaged E RSP in the
frontal cluster corresponding to the five cases. Figure 4
also reveals significant (p < 0.01) power increases related
to the math task, demonstrating that the power
increases in the frontal cluster are related to the math
task. The theta power incr eases in three dual -task case s
including cases 1-3 are slightly different from each
other. Compared to the single math task (case 4), the
power in dual-task cases is stronger. Especially, the
power increase in case 1 is the strongest. On the beta
band, it also shows power increases, which appear only
Figure 4 The ERSP images of frontal cluster with five cases. (a) The ERSP images of frontal cluster with five cases. The right column show
the onset sequences of the two tasks. Color bars indicate the magnitude of ERSPs. Red solid lines show the onset of the math task. Red dashed
lines show the mean response time for the math task. Blue solid lines show the onset of the deviation task. Blue dashed lines show the mean
response time for the deviation task. The red circle pointed out by the red arrow in case 2 means the red solid line and blue solid line are on
the same position. Latencies calculated from (a) are shown in (b) by calculating time form the math task onset to the first occurrence of power
increases. The open bars represent the latencies in the theta (4.5 ~ 9 Hz) band. The gray bars represent these latencies in the beta (11 ~ 15 Hz)
band. The comparison of total power in cross-subject (14 subjects) averaged ERSP images in the frontal cluster between cases is shown in (c).
The amount of total power is calculated by adding all the power increases in the same temporal period and the same frequency band. The
open bars represent the total power in the theta band. The gray bars represent the total power in the beta band.
Lin et al. Journal of NeuroEngineering and Rehabilitation 2011, 8:11
/>Page 7 of 13
in the math-task and time-locked to mathematics
onsets.
Figure 4b and 4c give comparisons of the latency and
total power in four cases from Figure 4a. It demon-
strates that the l atencies of power increases in two f re-
quency bands are different with the different SOA time.
The shortest latencies in both bands occur in case 1 and
the longest power increase latency in the theta band
occurs in case 4. It also demonstrates that the amount
of power increases in the theta band is different with
the different SOA time. Th e most significant pow er
increase occurs in case 1.
Figure 5a shows the cross-subject average ERSP in the
left motor cluster corresponding to five cases. Significant
(p < 0.01) power suppressions appear around the event
onsets (at 0 ms) and stop at different time axes by cases.
In case 4, the alpha and beta powe r suppressions appear
continuously until the red dashed lines, which indicates
themeanoftheresponsetimeforthemathtask.
Compared with ca se 4, the alpha and beta power
Figure 5 The ERSP images of the left motor cluster with five cases. (a) The ERSP images of the left motor cluster with five cases. The right
column shows the onset sequences of the two tasks. Color bars indicate the magnitude of the ERSPs. Red solid lines show the onset of math.
Red dashed lines show the mean response time for math task. Blue solid lines show the onset of deviation task. Blue dashed lines show the
mean response time for deviation task. The red circle pointed out by a red arrow in case 2 means the red solid line and blue solid line are on
the same position. Latencies calculated from (a) are shown in (b) by calculating from the deviation task onset to the first occurrence of power
suppressions. The open bars represent the latencies in the alpha (8 ~ 14 Hz) band. The gray blue bars represent these latencies in the beta band
(16 ~ 20 Hz). (c) shows the comparison of total power in cross-subject (11 subjects) averaged ERSP images in the left motor cluster between
cases. The amount of total power is calculated by adding all the power suppressions in the same temporal period and the same frequency
band. The open bars represent the total power in the alpha band. The gray bars represent the total power in the beta band.
Lin et al. Journal of NeuroEngineering and Rehabilitation 2011, 8:11
/>Page 8 of 13
suppressions in case 5 are stronger and also last longer.
In other cases, the alpha and beta power suppressions
continue af ter the blue dashed lines. This phenomenon
is suggested to be related to steering the car back to the
center of the third lane.
Figure 5b and 5c shows comparisons of the latency and
total power between the four cases in Figure 5a. It demon-
strates that power suppression latencies in the beta band
are different with the different SOA time. The shortest
power suppression latency occurs in case 1 and the longest
power increase latency occurs in case 5. It also demon-
strates that the amount of power suppression in the alpha
band is different with the different SOA time. The most
significant power suppression occurs in case 5 (the single
driving task) and the smallest power suppression occurs in
case 4 (the single math task).
Figure6aand6dshowtheERSPinthefrontaland
left motor clusters witho ut a significance test. Columns
(b) and (e) show the differences among three single-task
cases; columns (c) and (f) show the differences between
single- and dual-task cases. In columns (b), (c), (e), and
(f), a Wilcoxon signed-rank test is used to retain the
regions with significant power inside the black circles.
Columns (b) and (c) show the comparison of power
increases between cases. The remained regions show
greater power increases in the single-task case than in
the dual-ta sk case. Columns (e) and (f) show compared
power suppressions between cases. The remained
regions show greater power suppr essions in the dual-
task cases than in the single-task case.
Discussion
Frontal cluster
The frontal lobe is an area in the brain, located at the
front of each cerebral hemisphere. The frontal area
deals with impulse control, judgment, language produc-
tion, working memor y, motor function, and problem
solving [36,37]. In Figure 4a , the greater frontal power
increases in cases 1-4 a ppear due to the solv ing of the
math questions. The power increases in th e theta (4.5 ~
9 Hz) and beta bands (11 ~ 15 Hz) appear briefly after
themathonset.Figure4band4cshowthequantified
frontal power latencies and power increases in four con-
ditions for the purpose of discussing the E EG dynamics
made by solving the math question. In the theta power,
the shortest latency is revealed in case 1. Power
increases in three dual-task cases are higher than that in
single-task case with the greatest power occurring in
case 1. These phenomena suggest that dual tasks induce
more event-related theta activities as well as subjects
need more brain resources to accomplish dual tasks.
The theta increase is associated with numerous pro-
cesses such as mental work load, problem solving,
encoding, or self monitoring [34]. Based on this
evidence, the study demonstrates that the subjects were
distracted under dual-task conditions in the experiment.
Since human visual sensors need about 300 ms to per-
ceive stimulus (P300 activ ity), 400 ms between first and
second tasks is sufficient for a subject to perceive stimu-
lus[38].Incase1,aprocessingtaskisalreadyinthe
brain and subjects need more brain resources to manage
the high priority task presented 400 ms after the proces-
sing task. Therefore, the total power in the theta band
in case 1 is the highest as shown in Figure 4c. Clearly
the theta power increase appears the earliest in case 1
asshowninFigure4b.Theearly theta response in the
frontal area primarily reflects the activation of neural
networks involved in allocating attention related to the
target stimulus [39].
Thetrendsofresponsetimeforthemathtask(in
Figure 2a) and EEG theta increases in the frontal cluster
(in Figure 4c) are consistentwithoneanother.Inthe
caseofthesinglemathtask,theresponsetimeisthe
shortest and the theta power increase is the weakest.
Among the dual-task cases, the longest response time
and the greatest theta power increase are in case 1. This
evidence suggests that the theta activity of the EEG in
the frontal area during dual tasks is relate d to distrac-
tion eff ects and represents the strength of distraction. In
addition, power increases in the beta band appear in all
cases. From the ERSP images, the patterns are time-
locked to the onset of the math task. Fernández sug-
gested that significant EEG beta band differences in the
frontal area are due to a specific component of mental
calculation [40].
Motor cluster
Mu rhythm (μ rhythm) is an EEG rhythm usually
recorded from the motor cortex of the dominant hemi-
sphere. It can be suppressed by simple motor activities
such as clenching the fist of the contra lateral side, or
passively m oved [41-43]. Mu suppression is believed to
be the electrical output of the synchronization on large
portions of pyramidal neurons in the moto r cortex that
controls hand and arm movements.
In this study, the mu suppressions (8 ~ 14 Hz) and beta
power suppression (16 ~ 20 Hz) are mostly caused by
subjects steering t he wheel and pressing buttons as
shown in Figure 5a. The mu suppressions caused by
steering the wheel are almost time-locked to the response
onset of driving task in cases 1-3 and case 5. However,
the mu suppressions caused by pressing the buttons have
no effects in case 4. As for in the dual-task cases, the mu
suppressions are weaker than those in single-task case.
This may due to the competition of brain resources
required by wheel steering and button pressing.
Thus, Figure 5b and Figure 5c show motor p ower
latencies and power increases in 4 cases for the
Lin et al. Journal of NeuroEngineering and Rehabilitation 2011, 8:11
/>Page 9 of 13
Figure 6 ERSP without a significance test and the differences between cases. Column (a) shows the ERSP in the frontal cluster without a
significance test which contains all the details of case 1, case 2, case 3, and case 4. Column (b) shows the differences among three single-task
cases in column (a). Column (c) shows the differences between single- and dual-task cases in column (a). Column (d) shows the ERSP in the left
motor cluster without a significance test which contains all the details of case 1, case 2, case 3, and case 5. Column (e) shows the differences
among three single-task cases in column (d). Column (f) shows the differences between single- and dual-task cases in column (d). A Wilcoxon
signed-rank test (p < 0.01) is used for the statistical test in (b), (c), (e), and (f).
Lin et al. Journal of NeuroEngineering and Rehabilitation 2011, 8:11
/>Page 10 of 13
purposes of discussing the EEG dynami cs caused by the
driving task. In (b), the longest latency of beta power
suppression is observed in case 5 and the shortest
latency appears in case 1. Perhaps motor planning is
involved in preparing for steering the wheel and answer-
ing the math questions [44]. In (c), the three dual-task
power suppressions are weaker than those in single task.
Based on above evidences, it suggests that math proces-
sing occupies more brain resources in the frontal area
during dual-task cases so less activation is induced in
the motor area.
Brain dynamics related to behavior performance
Posner postulated that two tasks performed s imulta-
neously did not interfere with each other’s performance
when different brain areas were used for these two tasks
[45]. However, this study uses two visual-stimuli tasks
that compete within the frontal and motor areas for tak-
ing action. From the results, these two visual-stimuli
tasks interfere with each other in both behavior perfor-
mance (in Figure 2) and brain dynamics (in Figure 6).
In o rder to compare brain dynamics among differ ent
cases (in Figure 6), a statistical analysis was also con-
ducted to assess the significance of the ERSP differences
of the independent clusters under different cases. Since
thetruesampledistribution of the cluster ERSP was
unknownandthesamplesize(N=14as1of15sub-
jects and N = 11 as 4 of 15 subjects were exclude in
frontal and left motor clusters, respectively) was small, a
nonparametric statistical analysis, a paired-sa mple Wil-
coxon signed-rank test, was employed to access the sta-
tistically significant ERSP differences under different
cases. The level of significance was set to p < 0.01.
In Figure 6c, the significant differences between dual-
task cases and case 4 are due to that subjects’ reaction
to a math question is impaired when they are also facing
a car deviation. Lavie demonstrated that dual-task load
incr eases distraction effects [46]. Because of the distrac-
tion effects, the behavioral response time are signifi-
cantly higher in dual-task cases than that in single-task
case. In order to study the comparisons of these dual-
task cases, the differences of them are shown in Figure
6b. From the behavior performance in Figure 2,
response time in case 1 and case 2 are the longest
which m eans that the most distraction effects occurred
in these two cases. It is also shown in Figure 6b. Espe-
cially, distraction effects incase1areslightlyhigher
than those in case 2. Therefore, it is suggested that
some ki nds of two sequent tasks make the same distrac-
tion effects as two simultaneous tasks, or even higher.
Jong investigated how performance of two overlapping
discrete tasks was organized and controlled [47]. The
sequential performance of overlapping tasks can be sched-
uled in advance and regulated by initial ly allocating brain
resources to one task and subsequently switching to the
other task. Thus in case 1, when the math task is pre-
sented to the subject, it occupies the brain resources.
Then because the driving task appears, the brain resources
are immediately switched to the driving task and the math
task is temporally dropped. Subsequently, the brain
resources are then switched back to the math task. This
processing consumes the most brain resources and makes
the longest response time for the math question The
response time in case 1 is significantly higher than that in
case 3 and case 4. The occurrence of distraction effects is
due in large part to the switching of brain resources.
The fact, which no significant differences occur on
behavior performance for the driving tasks between
the simultaneous-task case 2 and single-task case 5 (in
Figure 2), suggests that the driving task is too simple to
require much brain resources. These results are also due
to the first priority on the driving task. No differences
of behavior performance, which appear among case 2,
case 3 and case5, also prove this fact. Thus, the subjects
always chose to respond to the driving task when the
driving task occurs even i f they are handling a math
task. In case 1, however, the math question is took as a
cue to let the subjects rapidly respond to the driving
task to avoid hitting the wall. This situation makes the
response time short for the driving task in case 1 due to
the subjects under a high perceptual load. Consistently,
Lavi e demonstrated that a high perceptual load reduced
response time [46]. This also causes case 1 and case 3,
which a re formed as a symmetrical paradigm, be much
different from each other (in Figure 2).
In Figure 6, the most po wer suppression occurs in
case 5 (in Figure 6f) with only driving task. Three dual-
task cases have the same level of power suppression.
The reason why less power suppression occurs on dual-
task cases in motor area is suggested that most brain
resources are occupied in fro ntal area to deal with two
tasks instead of those in motor area. It is proposed that
motor area is not related to distraction effects. This is
proved by one more result that the correlation is low
between EEG dynamics in motor area and its corre-
sponding response time.
In summary, this study observes several differences
between dual-task and single-task cases. We investigate
the relationship between brain dynamics associated with
dual-task management an d the behavior performance of
response modalities. It is suggested the theta activity of
the EEG in the frontal area during dual tasks is related
to distraction effects and repr esents the strength of dis-
traction. In addition, the appearing order of the two
tasks with different d ifficulties is an important factor in
dual-task performance.
Lin et al. Journal of NeuroEngineering and Rehabilitation 2011, 8:11
/>Page 11 of 13
Conclusions
This study investigates behavioral and physiological
(EEG) responses under multiple c ases and multiple
distraction levels. Firstly, the response time for mathema-
tical problem solving in dual-task condition is signifi-
cantly higher than that in single-task condition.
Therefore, distraction effects occur while processing two
tasks during driving. Comparing to the mathematical
problems, however, the response time for driving tasks
under multiple cases is almost the same without differ-
ences. This is due to the order of task appearance and
the relative difficulty of the two tasks, which suggesting
these factors are important considerations in dual-task
performance. Secondly, theta power increases in the fron-
tal area are higher with higher response time. The phasic
changes around the theta band in the case, in which the
mathematic task is presented before the deviation task,
show the strongest increase as the same as that in the
simultaneous-task case. This is because subjects already
process a task in the brain and need more brain resources
to manage the second task presented after the f irst task.
In conclusions, this study suggests that the power
increases of the 4.5 ~ 9 Hz frequency band in the frontal
area is related to driver distraction and represents the
strength of distraction in real-life driving.
Acknowledgements
This work was supported in part by the National Science Council, Taiwan, on
Establishing “International Research-Intensive Centers of Excellence in
Taiwan” (I-RiCE Project) under Contract NSC 99-2911-I-010-101, in part by the
Aiming for the Top University Plan of National Chiao Tung University, the
Ministry of Education, Taiwan, under Contract 99W962, in part by the
National Science Council, Taiwan, under Contract NSC 99-3114-E-0 09-167,
and in part by the VGHUST Joint Research Program, Tsou’s Foundation,
Taiwan, under Contract VGHUST99-P4-17.
Author details
1
Brain Research Center, National Chiao-Tung University, Hsinchu, Taiwan.
2
Department of Electrical Engineering, National Chiao-Tung University,
Hsinchu, Taiwan.
3
Department of Biological Science and Technology,
National Chiao-Tung University, Hsinchu, Taiwan.
Authors’ contributions
CTL started this study with the main idea, participated in the design of this
study, and led the team to well finish it. SAC participated in the design of
the study, the acquisition of data, the analysis/interpretation of data, and the
modification of paper to submit. TTC participated in the design of the study
and performed the statistical analysis. HZL participated in the design of the
study and drafted the manuscript. LWK conceived of the study, and
participated in the design and coordination and helped to draft the
manuscript. All authors read and approved the final manuscript.
Competing interests
The authors declare that they have no competing interests.
Received: 19 July 2010 Accepted: 18 February 2011
Published: 18 February 2011
References
1. Thomas AR: Driver Distraction: A Review of the Current State-of-
Knowledge. National Highway Traffic Safety Administration Vehicle Research
and Test Center 2008, 8-72, DOT F,1700.7.
2. Horberry T, Anderson J, Regan MA, Triggs TJ, Brown J: Driver distraction:
the effects of concurrent in-vehicle tasks, road environment complexity
and age on driving performance. Accident Analysis & Prevention 2006,
38:185-191.
3. Patten CJD, Kircher A, Őstlund J, Nilsson L: Using mobile telephones:
cognitive workload and attention resource allocation. Accident Analysis &
Prevention 2004, 36:341-350.
4. Dukic T, Hanson L, Falkmer T: Effect of drivers’ age and push button
locations on visual time off road, steering wheel deviation and safety
perception. Ergonomics 2006, 49:78-92.
5. Lee JD, Caven B, Haake S, Brown TL: Speech-based interaction with in-
vehicle computers: the effect of speech-based e-mail on drivers’
attention to the roadway. Humam Factors 2001, 43:631-640.
6. Tijerina L, Johnston S, Parmer E, Winterbottom MD, Goodman M: Driver
distraction with route guidance systems. National Highway Traffic Safety
Administration 2000, 809-069, Technical Report No. DOT HS.
7. Hancock PA, Lesch M, Simmons L: The distraction effects of phone use
during a crucial driving maneuver. Accident Analysis & Prevention 2003,
35:501-541.
8. Strayer DL, Drews FA, Johnston WA: Cell phone-induced failures of visual
attention during simulated driving. Journal of Experimental Psychology
2003, 9:23-32.
9. Hahn RW, Tetlock PC, Burnett JK: Should you be allowed to use your
cellular phone while driving? Regulation 2000, 23:46-55.
10. Crundall D, Loon EV, Underwood G: Attraction and distraction of
attention with roadside advertisements. Accident Analysis & Prevention
2006, 38:671-677.
11. Amado S, Ulupinar P: The effects of conversation on attention and
peripheral detection: is talking with a passenger and talking on the cell
phone different? Transportation Research 2005, 8:383-395.
12. Corbetta M, Miezin FM, Dobmeyer S, Shulman GL, Petersen SE: Selective
and divided attention during visual discriminations of shape, color, and
speed: functional anatomy by positron emission tomography. J
Neuroscience 1991, 11:2383-2402.
13. Koechlin E, Basso G, Pietrini P, Panzer S, Grafman J: The role of the anterior
prefrontal cortex in human cognition. Nature 1999, 399:148-151.
14. Szameitat AJ, Lepsien J, Cramon DY, Sterr A, Schubert T: Task-order
coordination in dual-task performance and the lateral prefrontal cortex:
an event related fMRI study.
Psychological Research 2006, 2:1-12.
15.
Stelzel C, Schumacher EH, Schubert T, D’Esposito M: The neural effect of
stimulus-response modality compatibility on dual-task performance: an
fMRI study. Psychological Research 2005, 70:514-525.
16. Baldwin CL, Coyne JT: Mental workload as a function of traffic density:
Comparison of physiological, behavioral, and subjective indices.
Proceedings of the Second International Driving Symposium on Human
Factors 2003.
17. Rakauskas ME, Ward NJ, Bernat EM, Cadwallader M, Patrick CJ, Waard D:
Psychophysiological measures of driver distraction and workload while
intoxicated. International Symposium on Human Factors in Driver
Assessment, Training, and Vehicle Design 2005, 6:27-30.
18. Deiber MP, Missonnier P, Bertrand O, Gold G, Fazio-Costa L, Ibañez V,
Giannakopoulos P: Distinction between perceptual and attentional
processing in working memory tasks: a study of phase-locked and
induced oscillatory brain dynamics. Journal of Cognitive Neuroscience 2007,
19:158-172.
19. Levy J, Pashler H: Is dual-task slowing instruction dependent? Journal of
Experimental Psychology: Human Perception and Performance 2001,
27:862-869.
20. Lin CT, Wu RC, Liang SF, Huang TY, Chao WH, Chen YJ, Jung TP: EEG-based
Drowsiness estimation for safety driving using independent component
analysis. IEEE Transactions on Circuit and System 2005, 52:2726-2738.
21. Lin CT, Chen YC, Huang TY, Chiu TT, Ko LW, Liang SF, Hsieh HY, Hsu SH,
Duann JR: Development of Wireless Brain Computer Interface With
Embedded Multitask Scheduling and its Application on Real-Time Driver’s
Drowsiness Detection and Warning. IEEE Trans BME 2008, 55:1582-1591.
22. Eoh HJ, Chung MK, Kim SH: Electroencephalographic study of drowsiness
in simulated driving with sleep deprivation. International Journal of
Industrial Ergonomics 2005, 35:307-320.
23. Lin CT, Wu RC, Jung TP, Liang SF, Huang TY: Estimating Driving
Performance Based on EEG Spectrum Analysis. EURASIP Journal on Applied
Signal Processing 2005, 19:3165-3174.
Lin et al. Journal of NeuroEngineering and Rehabilitation 2011, 8:11
/>Page 12 of 13
24. Kemeny A, Panerai F: Evaluating perception in driving simulation
experiments. TRENDS in Cognitive Sciences 2003, 7:31-37.
25. Lin CT, Huang KC, Chao CF, Chen JA, Chiu TW, Ko LW, Jung TP: Tonic and
phasic EEG and behavioral changes induced by arousing feedback.
NeuroImage 2010, 52:633-642.
26. Geary DC, Wiley JG: Cognitive addition: strategy choice and speed-of-
processing differences in young and elderly adults. Psychology and Aging
1991, 6:474-483.
27. Jung TP, Makeig S, Humphries C, Lee TW, McKeown MJ, Iragul V,
Sejnowski TJ: Removing electroencephalographic artifacts by blind
source separation. Psychophysiology 2000, 37:163-78.
28. Lee TW, Girolami M, Sejnowski TJ: Independent component analysis using
an extended infomax algorithm for mixed sub-Gaussian and super-
Gaussian sources. Neural Computation 1999, 11:606-633.
29. Makeig S, Bell AJ, Jung TP, Sejnowski T: Independent component analysis
of electroencephalographic data. Advance in Neural Information Processing
System 1995, 8:145-151.
30. Makeig S, Inlow M: Lapses in Alertness: Coherence of Fluctuations in
Performance and EEG Spectrum. Electroencephalogy Clin Neurophysiol
1993, 86:23-35.
31. Makeig S: Auditory event-related dynamics of the EEG spectrum and
effects of exposure to tones. Electroencephalography and Clinical
Neurophysiology 1993, 86:283-293.
32. Makeig S, Westerfield M, Jung TP, Enghoff S, Townsend J, Courchesne E,
Sejnowski TJ: Dynamic brain sources of visual evoked responses. Science
2002, 295:690-694.
33. Makeig S, Delorme A, Westerfield M, Jung TP, Townsend J, Courchense E,
Sejnowski TJ: Electroencephalographic brain dynamics following visual
targets requiring manual responses. PLOS Biology 2004, 2:0747.
34. Onton J, Delorme A, Makeig S: Frontal Midline theta dynamics during
working memory. Neuroimage 2005, 27:341-356.
35. Oostenveld R, Oostendorp TF: Validating the boundary element method
for forward and inverse EEG computations in the presence of a hole in
the skull. Hum Brain Mapp 2002, 17:179-192.
36. Burgess PW: Strategy application disorder: the role of the frontal lobes in
human multitasking. Psychophysiology 2000, 63:279-288.
37. Sarnthein J, Petsche H, Rappelsberger P, Shaw GL, Stein AV:
Synchronization between prefrontal and posterior association cortex
during human working memory. Proc Natl Acad Sci USA 1998,
95:7092-7096.
38. Jensen SM, Barabasz A, Barabasz M, Warner D: EEG P300 event-related
markers of hypnosis. Clinical Hypnosis 2001, 44:127-39.
39. Missonnier P, Deiber MP, Gold G, Millet P, Pun MG, Fazio-Costa L,
Giannakopoulos P, Ibáñez V: Frontal theta event-related synchronization:
comparison of directed attention and working memory load effects.
Journal of Neural Transmission 2006, 10:1477-1486.
40. Fernández T, Harmony T, Rodríguez M, Bernal J, Silva J, Reyes A, Marosi E:
EEG activation patterns during the performance of tasks involving
different components of mental calculation. Electroencephalogr Clin
Neurophysiol 1995, 94:175-182.
41. Kuhlman WN: EEG feedback training: enhancement of somatosensory
cortical Activity. Electroencephalogr Clin Neurophysiol 1978, 45:290-294.
42. Kuhlman WN: Functional topography of the human Mu rhythm.
Electroencephalogr Clin Neurophysiol 1978, 44:83-93.
43. Schoppenhorst M, Brauer F, Freund G, Kubichi St: The significance of
coherence estimates in determining central alpha and mu activities.
Electroencephalogr Clin Neurophysiol 1980, 48:25-33.
44. Hayhoe M, Shrivastava A, Mruczek R, Pelz JB: Visual memory and motor
planning in a natural task. Journal of Vision 2003, 6:49-63.
45. Posner MI, Sandson J, Dhawan M, Shulman GL: Is word recognition
automatic? A cognitive-anatomical approach. Journal of Cognitive
Neuroscience 1989, 1:50-60.
46. Lavie N, Hirst A, Fockert JW, Viding E: Load Theory of Selective Attention
and Cognitive Control. Journal of Experimental Psychology 2004, 9:339-354.
47. Jong RD: The role of preparation in overlapping-task performance.
Quarterly Journal of Experimental Psychology 1995, 48:2-25.
doi:10.1186/1743-0003-8-11
Cite this article as: Lin et al.: Spatial and temporal EEG dynamics of
dual-task driving performance. Journal of NeuroEngineering and
Rehabilitation 2011 8:11.
Submit your next manuscript to BioMed Central
and take full advantage of:
• Convenient online submission
• Thorough peer review
• No space constraints or color figure charges
• Immediate publication on acceptance
• Inclusion in PubMed, CAS, Scopus and Google Scholar
• Research which is freely available for redistribution
Submit your manuscript at
www.biomedcentral.com/submit
Lin et al. Journal of NeuroEngineering and Rehabilitation 2011, 8:11
/>Page 13 of 13