Báo cáo hóa học: " Classification of rhythmic locomotor patterns in electromyographic signals using fuzzy sets" docx
Bạn đang xem bản rút gọn của tài liệu. Xem và tải ngay bản đầy đủ của tài liệu tại đây (314.24 KB, 22 trang )
This Provisional PDF corresponds to the article as it appeared upon acceptance. Fully formatted
PDF and full text (HTML) versions will be made available soon.
Classification of rhythmic locomotor patterns in electromyographic signals
using fuzzy sets
Journal of NeuroEngineering and Rehabilitation 2011, 8:65 doi:10.1186/1743-0003-8-65
Timothy A Thrasher ()
John S Ward ()
Stanley Fisher ()
ISSN 1743-0003
Article type Methodology
Submission date 26 April 2011
Acceptance date 8 December 2011
Publication date 8 December 2011
Article URL />This peer-reviewed article was published immediately upon acceptance. It can be downloaded,
printed and distributed freely for any purposes (see copyright notice below).
Articles in JNER are listed in PubMed and archived at PubMed Central.
For information about publishing your research in JNER or any BioMed Central journal, go to
/>For information about other BioMed Central publications go to
/>Journal of NeuroEngineering
and Rehabilitation
© 2011 Thrasher et al. ; licensee BioMed Central Ltd.
This is an open access article distributed under the terms of the Creative Commons Attribution License ( />which permits unrestricted use, distribution, and reproduction in any medium, provided the original work is properly cited.
- 1 -
Classification of rhythmic locomotor patterns in
electromyographic signals using fuzzy sets
Timothy A Thrasher
1
, John S Ward
1
, Stanley Fisher
2
1
Dept of Health and Human Performance, Center for Neuromotor and Biomechanics
Research, University of Houston, Houston, TX, USA
2
The Methodist Neurological Institute, Houston, TX, USA
Email address:
TAT:
JSW:
SF:
- 2 -
Abstract
Background
Locomotor control is accomplished by a complex integration of neural mechanisms
including a central pattern generator, spinal reflexes and supraspinal control centres.
Patterns of muscle activation during walking exhibit an underlying structure in which
groups of muscles seem to activate in united bursts. Presented here is a statistical
approach for analyzing Surface Electromyography (SEMG) data with the goal of
classifying rhythmic “burst” patterns that are consistent with a central pattern
generator model of locomotor control.
Methods
A fuzzy model of rhythmic locomotor patterns was optimized and evaluated using
SEMG data from a convenience sample of four able-bodied individuals. As well, two
subjects with pathological gait participated: one with Parkinson’s Disease, and one
with incomplete spinal cord injury. Subjects walked overground and on a treadmill
while SEMG was recorded from major muscles of the lower extremities. The model
was fit to half of the recorded data using non-linear optimization and validated against
the other half of the data. The coefficient of determination, R
2
, was used to interpret
the model’s goodness of fit.
Results
Using four fuzzy burst patterns, the model was able to explain approximately 70-83%
of the variance in muscle activation during treadmill gait and 74% during overground
gait. When five burst functions were used, one function was found to be redundant.
The model explained 81-83% of the variance in the Parkinsonian gait, and only 46-
59% of the variance in spinal cord injured gait.
- 3 -
Conclusions
The analytical approach proposed in this article is a novel way to interpret
multichannel SEMG signals by reducing the data into basic rhythmic patterns. This
can help us better understand the role of rhythmic patterns in locomotor control.
Keywords: Surface electromyography, gait, central pattern generator, fuzzy analysis
- 4 -
Background
During gait, the Central Nervous System (CNS) activates the muscles of the lower
extremities in rhythmic patterns that can be measured by surface electromyography
(SEMG). These signals are not precisely periodic; they naturally vary from stride to
stride due to responses to environmental stimuli and a number of complex
mechanisms in the CNS that are not well understood. SEMG is often used in the study
of the motor control of normal and pathological gait, because it contains important
information about the timing and intensity of muscle commands that originate in the
CNS [1]. There have been several attempts to statistically classify locomotor patterns
from SEMG data, however the majority of these approaches are a posteriori and
identify patterns without regard for physiological theory. Here, we propose a new a
priori analytical method involving fuzzy systems that is designed to classify rhythmic
locomotor patterns in SEMG waveforms that fit a rudimentary model of open-loop
Central Pattern Generator (CPG) control.
Interpretation of SEMG during gait is particularly challenging due to the
complexity of the myoelectric signals, which are stochastic in nature and represent an
interference pattern from multiple motor units. Furthermore, SEMG data are usually
multi-dimensional and involve significant measurement error (noise) that can only be
partially discriminated from true signal using filtering techniques [2]. A number of
statistical techniques have been proposed to deal with the high dimensionality and
uncertainty that is inherent to SEMG data [3,4]. Jansen et al. [5] used a hierarchical
clustering procedure to classify different muscle patterns observed in gait, from which
they were able to draw inferences about different walking strategies. Intra-class
correlation coefficients have been used to identify characteristics of different patient
populations [6]. Factor analysis has been used to capture the underlying correlations
- 5 -
between muscles, which has led to a deeper understanding of how locomotor patterns
are organized [7]. These advanced analytical approaches can contribute to a better
understanding of the underlying neural mechanisms that control muscle activity
during gait. However, these approaches are a posteriori and lead to identification of
patterns independent of physiological theory. The method proposed here is built upon
the specific theory of a CPG that open-loop control of locomotion using simplified,
pre-programmed muscle commands.
The idea that human locomotion is driven by oscillating neural circuits located
in the spinal cord has been advanced for decades [8]. These circuits, known as the
CPG, provide rhythmic “bursts” of muscle activation signals that form the basis of
locomotor control [9-11]. By analyzing the basic pattern of SEMG signals as well as
the variability that occurs over multiple strides, we can gain valuable insight into the
function of the CPG and its role in human locomotor control.
One of the most important challenges in gait analysis is to determine if a set of
recorded signals represents normal gait or if it contains particular signatures of
pathological gait. It is often desirable to compare one set of SEMG waveforms to
another in order to determine if a subject’s gait exhibits abnormal behavior, if an
intervention was successful, or if walking under different conditions involves
different muscle activation patterns. Some researchers have developed mathematical
indices that quantify certain features of dynamic EMG waveforms for the purpose of
quantifying impairment [12,13] or to evaluate stride-to-stride variability [14].
Many neurological disorders are associated with increased variability of gait
[1,5,9,15]. This is due to errors in locomotor control caused by dysfunction of specific
areas in the CNS. It is conceivable that some CNS disorders may actually reduce the
amount of variability, due to a decrease in anticipatory control (supraspinal), a
- 6 -
decrease in environmental interaction (spinal reflexes) and a relative increase in self-
generated oscillatory commands form the spinal CPG. For example, Miller et al. [14]
observed reduced timing variability of the gastrocnemius muscle in Parkinsonian gait.
This is an interesting finding that suggests there may be other characteristics of
pathological gait that produce abnormally invariant muscle activation signals.
This article describes a combined fuzzy and statistical approach that first
classifies basic muscle activation patterns during different phases of the gait cycle,
and then evaluates the degree to which recorded muscle signals are consistent with a
rudimentary CPG model of locomotor control. This approach is unique in that it
enables an estimate of how much of the variability in muscle activity in gait is due to
recurring basic patterns and how much is due to error and non-rhythmic sources of
control (i.e., anticipatory adjustments, aberrant reflexes, measurement error, etc.).
Methods
Subjects
SEMG recordings were collected from four able-bodied (AB) individuals with no
neurological conditions, as well as one individual with Parkinson’s Disease (PD) and
one individual with incomplete Spinal Cord Injury (SCI). Descriptive data of the six
subjects is provided in Table 1. PD subjects were classified according to the Hoehn &
Yahr scale [16], and SCI subjects were classified according to the American Spinal
Injury Association (ASIA) Impairment Scale [17]. PD is a neurological disorder in
which the supraspinal centers are believed to generate erroneous signals for
locomotion [18]. SCI was included as a case in which the pathways between
supraspinal centers and spinal circuits are impaired. We expected to find abnormal
features in the SEMG of both pathological subjects.
- 7 -
Instrumentation and protocol
Each subject was instrumented with an 8-channel SEMG system (Biometrics
DataLOG, Biometrics Ltd, Ladysmith, VA, USA). Eight electrodes were carefully
placed over the muscle belly of the following muscles bilaterally: vastus lateralis
(VL), long head of biceps femoris (BF), tibialis anterior (TA) and gastrocnemius
lateralis (LG). These particular muscles were selected as a representative set of the
major actuators during gait [5]. The skin was cleaned and lightly abraded before the
electrodes were attached with double-sided adhesive tape. SEMG signals were
amplified, filtered (bandpass: 15 – 450 Hz), and recorded at 2000 Hz. A foot switch
was placed in the right shoe directly under the heel to detect initial foot contact, which
was used to mark the beginning and end of each gait cycle.
Each subject performed two trials of overground walking (OG) for a distance
of 10m. Then each subject performed two trials of treadmill walking (TM) for a
duration of 30s. TM speed was set to the average walking speed of the subject’s OG
trials. The first trial of each set was used as training data for optimizing the model.
The second trial was used to validate the model.
After recording, SEMG signals were rectified and filtered using a low-pass
Butterworth filter with a cut-off frequency of 10Hz, which is considered sufficient for
noise removal without loss of signal [2]. All signals were then separated into
individual gait cycles marked by right foot contact and time-normalized relative to the
gait cycle using cubic spline interpolation of 100 evenly spaced points in time (0 to
99% of the gait cycle). All data processing was performed using Matlab software (The
Mathworks, Inc., Natick, MA, USA).
- 8 -
Algorithm
The rectified and filtered SEMG signals were coded according to fuzzy sets [3,19]. A
set of n Gaussian membership functions were used to represent specific bursts of
muscle activity during the gait cycle. These are described by Equation 1. Gaussian
functions represent a basic “burst” pattern and have been used previously to
decompose SEMG data [20].
)2/()(
2
2
2
1
)(
ii
t
i
i
etb
στ
πσ
−−
= (1)
Where b
i
(t) is the ith burst function,
τ
i
is the time of maximum value, and
σ
i
is the
standard deviation. The values of
τ
i
and
σ
i
were initially selected a priori to provide
good coverage of the gait cycle.
τ
i
were equally spaced throughout the gait cycle, and
σ
i
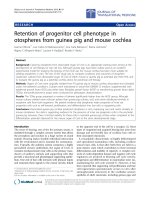
were all equal to 10% of the gait cycle. Figure 1A illustrates the burst functions for
n = 4, and the initial model parameters can be expressed as the following vectors.
=
5.87
5.62
5.37
5.12
τ
and
=
10
10
10
10
σ
Each SEMG signal was treated as a weighted sum of the burst functions. Our model is
described in Equation (2).
)()()(
11
tbwtbwtY
njnjj
⋅++⋅= L (2)
- 9 -
Where Y
j
(t) is the SEMG signal of the jth muscle and w
ji
is the weighting
coefficient for the jth muscle and the ith burst function. n is the number of burst
functions. The weighting coefficients were determined by fitting the model to the
recorded SEMG data using a least-squares linear regression (Matlab function
lscov). Each muscle was therefore represented by a single n-element vector of
phase coefficients, resulting in a major reduction in the information density of each
signal. Each SEMG signal could then be reconstructed using n coefficients, creating a
basic underlying pattern of muscle activation during the gait cycle. These coefficients
can be interpreted as the pre-programmed muscle activation patterns that are
dispensed by the CPG at the different phases of the gait cycle.
The model was optimized by finding the values of τ
i
and σ
i
that produced the
best fit. A Nelder-Mead simplex direct search algorithm (Matlab function
fminsearch) was used to find the burst function parameters that maximized the
goodness of fit, R
2
, between the training data and the model output. We interpreted R
2
as the proportion of the variance in the SEMG signals that is explained by the model.
Results
Testing
A 4-burst model was fit to the treadmill walking data and the overground walking
data separately. Four bursts were initially chosen, because models of the CPG
typically consist of four synergies corresponding to a flexor pattern and an extensor
pattern on each side of the body [8]. As show in Figure 1, the burst function profile of
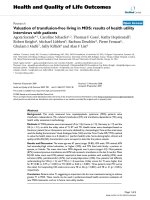
these two models differed only slightly. Figure 2 shows the SEMG data from one of
the validation trials of overground walking, and the model estimation of the SEMG
profiles for all eight muscles.
- 10 -
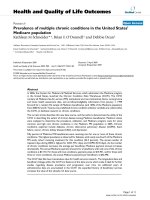
Following optimization of the model, a separate R
2
was calculated for each
subject under each walking condition (OG and TM) using the validation data. Figure
3 summarizes the R
2
values under each walking condition. This represents to what
extent the fuzzy model accounts for the variance of all SEMG signals of the validation
walking trial.
Initially, the model was designed with n = 4 burst functions. We tested for
improved model performance by increasing the number of bursts from four to five.
The best fit solution resulted in two functions with identical parameters values for τ
and σ. In other words, the 5-burst model degenerated to a 4-burst model. The fifth
burst was redundant and provided no improvement to the fit of the model.
Discussion
The approach presented in this article represents a form of fuzzy coding of muscle
activation signals that can be used to determine an underlying temporal pattern of
SEMG signals during gait. The basic structure of the predictor model consists of four
overlapping Gaussian membership functions distributed across the gait cycle. This
model is based on general theory of CPG control of locomotion. The Gaussian
membership functions representing pre-programmed bursts from the CPG were
optimized according to a set of training data and then tested against a set of validation
data. Four burst functions were sufficient; when a fifth burst was added, the model
degenerated into a four-burst model during optimization.
The model assumes that the CPG produces periodic signals that are exactly the
same for every stride. From this we may conclude that all stride-to-stride variability is
due to mechanisms other than the CPG, i.e., anticipatory adjustments from
supraspinal centers, reflex responses to external perturbations, etc. In normal gait, the
model was able to account for 70-84% of the variance in SEMG throughout the gait
- 11 -
cycle. Similar results were found for the subject with Parkinson’s Disease. The model
was not able to account for the SEMG of the SCI subject very well, likely due to a
lack of coordination and high stride-to-stride variability.
Our statistical approach differs significantly from other methods of
interpreting SEMG data during gait. Many SEMG analyses focus on the ensemble
average of all strides and do not take into account variability [3,21]. In our analysis,
the stride-to-stride variability was essential in determining the goodness of fit of the
fuzzy CPG model. Ivanenko et al. [7] used factor analysis to find common waveforms
that were shared by multiple muscles. These waveforms are analogous to the
Gaussian membership functions that we use in our model, however they are more
complex in shape. They were able to account for roughly 80% of the variance in
normal gait, which is similar to our results [22].
There are some special considerations when using the analytical method
described in this article. First, R
2
is very sensitive to measurement error, so great care
should be taken to ensure that electrodes are placed correctly and securely. The
calculation of R
2
is based on an estimation of variance using sums of squares.
Considering the n-channel SEMG data as a set of points in n-dimensional space the
sums of squares are based on Euclidean distances, whereby each dependent variable
has equal weight. This may not always be appropriate. For example, if recordings are
taken from the soleus and both heads of gastrocnemius, the triceps surae will
contribute three times as much to the sum of squares as other muscle groups that are
recorded individually.
Conclusions
The analytical approach proposed in this article is a novel way to interpret
multichannel SEMG signals by reducing the data into basic rhythmic patterns. This
- 12 -
can help us better understand the role of rhythmic patterns in locomotor control, and
provide insight about certain forms of pathological gait.
- 13 -
Competing interests
The authors declare that they have no competing interests.
Authors' contributions
TAT conceived the basis for the study, designed the methodology and carried out the
data processing and statistical analyses. JSW collected the bulk of the data and
participated in the data processing. SF contributed to the design of the study,
recruitment of subjects, and analysis of data. All authors have read and approved the
final version of this article.
- 14 -
References
[1] Frigo C, Crenna P: Multichannel SEMG in clinical gait analysis: a review
and state-of-the-art. Clin Biomech 2009, 24(3): 236-45.
[2] Shiavi R, Frigo C, Pedotti A: Electromyographic signals during gait:
criteria for envelope filtering and number of strides. Med Biol Eng
Comput1998, 36(2): 171-8.
[3] Chau T: A review of analytical techniques for gait data. Part 1: Fuzzy,
statistical and fractal methods. Gait Posture 2001, 13(1): 49-66.
[4] Shan G, Visentin P, Schultz A: Multidimensional Signal Analysis as a
Means of Better Understanding Factors Associated with Repetitive Use in
Violin Performance. Med Probl Perform Art 2004, 19(3): 129-139.
[5] Jansen BH, Miller VH, Mavrofrides DC, Stegink Jansen CW:
Multidimensional EMG-based assessment of walking dynamics. IEEE T
Neural Syst Rehabil Eng 2003, 11(3): 294-300.
[6] Duhamel A, Bourriez JL, Devos P, Krystkowiak P, Destée A, Derambure P,
Defebvre L: Statistical tools for clinical gait analysis. Gait Posture 2004,
20(2): 204-12.
[7] Ivanenko YP, Grasso R, Zago M, Molinari M, Scivoletto G, Castellano V,
Macellari V, Lacquaniti F: Temporal components of the motor patterns
expressed by the human spinal cord reflect foot kinematics. J Neurophysiol
2003, 90(5): 3555-3565.
[8] Pinter MM: Gait after spinal cord injury and the central pattern generator
for locomotion. Spinal Cord 1999, 37(8): 531-537.
- 15 -
[9] Ivanenko YP, Cappellini G, Dominici N, Poppele RE, Lacquaniti F:
Coordination of locomotion with voluntary movements in humans. J
Neurosci 2005, 25(31): 7238-7253.
[10] Ivanenko YP, Poppele RE, Lacquaniti F: Distributed neural networks for
controlling human locomotion: lessons from normal and SCI subjects.
Brain Res Bull 2009, 78(1): 13-21.
[11] Gallarda BW, Sharpee TO, Pfaff SL, Alaynick WA: Defining rhythmic
locomotor burst patterns using a continuous wavelet transform. Ann NY
Acad Sci 2010, 1198: 133-139.
[12] Chester V: Using waveform analyses to develop pediatric gait indices.
Exercise Sport Sci R 2009, 37(4): 211-7.
[13] Fung J, Barbeau H: A dynamic EMG profile index to quantify muscular
activation disorder in spastic paretic gait. Electroen Clin Neuro 1989, 73(3):
233-44.
[14] Miller RA, Thaut MH, Mcintosh GC, Rice RR: Components of EMG
symmetry and variability in parkinsonian and healthy elderly gait.
Electroen Clin Neuro 1996, 4: 1-7.
[15] Delval A, Salleron J, Bourriez J-L, Bleuse S, Moreau C, Krystkowiak P,
Defebvre L, Devos P, Duhamel A: Kinematic angular parameters in PD:
reliability of joint angle curves and comparison with healthy subjects. Gait
Posture 2008, 28(3): 495-501.
[16] Hoehn MM, Yahr MD: Parkinsonism: onset, progression and mortality.
Neurology 1967, 17(5): 427-442.
[17] Maynard FM, Bracken MB, Creasey GJFD, Donovan WH, Ducker TB, Garber
SL, Marino RJ, Stover SL, Tator CH, Waters RL, Wilberger JE, Young W:
- 16 -
International Standards for Neurological and Functional Classification of
Spinal Cord Injury. Spinal Cord 1997, 35(5): 266-274.
[18] Ferrarin M, Carpinella I, Rabuffetti M, Rizzone M, Lopiano L: Unilateral and
Bilateral Subthalamic Nucleus Stimulation in Parkinson’s Disease: Effects
on EMG Signals of Lower Limb Muscles During Walking. IEEE T Neural
Syst Rehabil Eng 2007, 15(2): 182-189.
[19] Bouilland S, Loslever P: Multiple correspondence analysis of biomechanical
signals characterized through fuzzy histograms. J Biomech 1998, 31(7):
663-6.
[20] Chen J-JJ, Shiavi R: Temporal feature extraction and clustering analysis of
electromyographic linear envelopes in gait studies. IEEE T Biomed Eng
1990, 37(3): 295-302.
[21] Chau T, Young S, Redekop S: Managing variability in the summary and
comparison of gait data. J NeuroEng Rehabil 2005, 20(2): 22.
[22] Ivanenko YP, Poppele RE, Lacquaniti F: Five basic muscle activation
patterns account for muscle activity during human locomotion. J Physiol
2004, 556(Pt 1): 267-82.
- 17 -
Figure legends
Figure 1 - Fuzzy models
Burst functions representing four synergistic patterns of muscle activity during the
gait cycle. A) Arbitrary bursts covering the gait cycle. B) Optimized with respect to
overground walking data. C) Optimized with respect to treadmill walking data.
Figure 2 - SEMG data
Representative sample of SEMG signals for the 8 muscles observed in this study (AB
subject 3 walking overground). Ensemble average SEMG are shown as dashed lines.
Grey area represents the mean plus and minus one standard deviation. The solid line
is the model output.
Figure 3 - Goodness of fit
Goodness of fit of the models with respect to the validation data.
- 18 -
Tables
Table 1 - Details of subjects
Subject
Group Age
Gender Disease/injury
duration
Clinical
classification
Walking
speed (m/s)
1 AB 25 F – – 0.714
2 AB 22 F – – 0.667
3 AB 24 F – – 0.690
4 AB 32 M – – 0.769
5 PD 59 M 8 years HAY 2
a
0.625
6 SCI 42 M 3 years T10, AIS C
b
0.143
a
Hoehn & Yahr scale [16]
b
American Spinal Injury Association (ASIA) Impairment Scale [17]
A) a priori model
0 20406080100
Membership
C) Overground walking
0 20406080100
Membership
Time (% gait cycle)
0 20406080100
Membership
B) Treadmill walking
Figure 1
RTA
LTA
0 20 40 60 80 100
RGL
0 20 40 60 80 100
LGL
0 20 40 60 80 100
V
L
0 20 40 60 80 100
V
L
0 20 40 60 80 100
R
V
0 20 40 60 80 100
L
V
0 20 40 60 80 100
RBF
0 20 40 60 80 100
LBF
gait cycle (%)gait cycle (%)
Figure 2
Subject
123456
Coefficient of determination, R
2
0.0
0.2
0.4
0.6
0.8
1.0
Overground
Treadmill
AB group PD SCI
Figure 3