Báo cáo hóa học: " Hypothesis testing for evaluating a multimodal pattern recognition framework applied to speaker detection" doc
Bạn đang xem bản rút gọn của tài liệu. Xem và tải ngay bản đầy đủ của tài liệu tại đây (272.33 KB, 8 trang )
BioMed Central
Page 1 of 8
(page number not for citation purposes)
Journal of NeuroEngineering and
Rehabilitation
Open Access
Methodology
Hypothesis testing for evaluating a multimodal pattern recognition
framework applied to speaker detection
Patricia Besson* and Murat Kunt
Address: Signal Processing Institute (ITS), Ecole Polytechnique Fédérale de Lausanne (EPFL), 1015 Lausanne, Switzerland
Email: Patricia Besson* - ; Murat Kunt -
* Corresponding author
Abstract
Background: Speaker detection is an important component of many human-computer interaction
applications, like for example, multimedia indexing, or ambient intelligent systems. This work
addresses the problem of detecting the current speaker in audio-visual sequences. The detector
performs with few and simple material since a single camera and microphone meets the needs.
Method: A multimodal pattern recognition framework is proposed, with solutions provided for
each step of the process, namely, the feature generation and extraction steps, the classification, and
the evaluation of the system performance. The decision is based on the estimation of the synchrony
between the audio and the video signals. Prior to the classification, an information theoretic
framework is applied to extract optimized audio features using video information. The classification
step is then defined through a hypothesis testing framework in order to get confidence levels
associated to the classifier outputs, allowing thereby an evaluation of the performance of the whole
multimodal pattern recognition system.
Results: Through the hypothesis testing approach, the classifier performance can be given as a
ratio of detection to false-alarm probabilities. Above all, the hypothesis tests give means for
measuring the whole pattern recognition process effciency. In particular, the gain offered by the
proposed feature extraction step can be evaluated. As a result, it is shown that introducing such a
feature extraction step increases the ability of the classifier to produce good relative instance
scores, and therefore, the performance of the pattern recognition process.
Conclusion: The powerful capacities of hypothesis tests as an evaluation tool are exploited to
assess the performance of a multimodal pattern recognition process. In particular, the advantage
of performing or not a feature extraction step prior to the classification is evaluated. Although the
proposed framework is used here for detecting the speaker in audiovisual sequences, it could be
applied to any other classification task involving two spatio-temporal co-occurring signals.
Background
Speaker detection is an important component of many
human-computer interaction applications, like for exam-
ple, multimedia indexing, or ambient intelligent systems
(through the use of speech-based user-interfaces). Recent
and reliable speech recognition methods rely indeed on
both acoustic and visual cues to perform [1]. They require
therefore the speaker to be identified and discriminated
Published: 27 March 2008
Journal of NeuroEngineering and Rehabilitation 2008, 5:11 doi:10.1186/1743-0003-5-11
Received: 7 February 2007
Accepted: 27 March 2008
This article is available from: />© 2008 Besson and Kunt; licensee BioMed Central Ltd.
This is an Open Access article distributed under the terms of the Creative Commons Attribution License ( />),
which permits unrestricted use, distribution, and reproduction in any medium, provided the original work is properly cited.
Journal of NeuroEngineering and Rehabilitation 2008, 5:11 />Page 2 of 8
(page number not for citation purposes)
from other users or background noise. The advantage of
these interfaces, and what make them appealing for ambi-
ent assisted living systems [2], is that they allow to com-
municate with users in a natural way. This is of course
conditioned to the use of simple material for the system
to remain light.
The work presented in this paper addresses the problem of
detecting the current speaker among two candidates in an
audio-video sequence using simple material, namely, a
single camera and microphone. A mono audio signal con-
tains no spatial information about the source location,
nor does the video signal alone permits to discriminate
between a speaker and a person moving his lips – if chew-
ing a gum for example. Therefore, the detection process
has to consider both the audio and video cues as well as
their inter-relationship to come up with a decision. In par-
ticular, previous works in the domain have shown that the
evaluation of the synchrony between the two modalities,
interpreted as the degree of mutual information between
the signals, allowed to recover the common source of the
two signals, that is, the speaker [3,4]. Other works, such as
[5] and [6], have pointed out that fusing the information
contained in each modality at the feature level can greatly
help the classification task: the richer and the more repre-
sentative the features, the more effcient the classifier.
Using an information theoretic framework based on [5]
and [6], audio features specific to speech are extracted
using the information content of both the audio and
video signals as a preliminary step for the classification.
This feature extraction step is followed by a classification
step, where a label "speaker" or "non-speaker" is assigned
to pairs of audio and video features. Whereas we have
already described in details the feature extraction step in
[7] and [8], the classification step is defined here in a new
way and constitutes the core contribution of this work.
As stated previously, the classifier decision should rely on
an evaluation of the synchrony between pairs of audio
and video features. In [6], the authors formulate the eval-
uation of such a synchrony as a binary hypothesis test ask-
ing about the dependence or independence between the
two modalities. Thus, a link can be found with mutual
information which is nothing else than a metric evaluat-
ing the degree of dependence between two random varia-
bles [9]. The classifier in [6] ultimately consists in
evaluating the difference of mutual information between
the audio signal and video features extracted from two
potential regions of the image. The sign of the difference
indicates the video speech source. We have taken a similar
approach in [8], showing, through comparisons with
state-of-the-art results, that such a classifier fed with the
previously optimized audio features leads to good results.
In the present work, the classification task is cast in a
hypothesis testing framework as well. However, the objec-
tive – thus, the novelty – is to define not only a classifier,
but the means for evaluating the multimodal classifica-
tion chain – or pattern recognition process – performance.
To this end, the hypothesis tests are defined using the
Neyman-Pearson frequentist approach [10] and one test
is associated to each potential mouth region. This way, the
ability of the classifier to produce good relative instance
scores can be measured. Moreover, an evaluation of the
whole pattern recognition process, including the feature
extraction step, can be introduced. It allows to assess the
benefit of optimizing features prior to performing the
classification.
As a result, a complete multimodal pattern recognition
process is proposed in this work, with solutions given for
each step of the process, namely, the feature generation
and extraction steps, the classification, and finally, the
evaluation of the system performance.
Extraction of optimized audio features for
speaker detection: information theoretic
approach
Given different mouth regions extracted from an audio-
video sequence and corresponding to different potential
speakers, the problem is to assign the current speech
audio signal to the mouth region which effectively did
produce it. This is therefore a decision, or classification,
task.
Multimodal feature extraction framework
Let the speaker be modelled as a bimodal source S emit-
ting jointly an audio and a video signal, A and V. The
source S itself is not directly accessible but through these
measurements. The classification process has therefore to
evaluate whether two audio and video measurements are
issued from a common estimated source or not, in
order to estimate the class membership of this source. This
class membership, modeled by a random variable C
defined over the set Ω
C
, can be either "speaker" or "non-
speaker". Obviously, the overall goal of the classification
process is to minimize the classification error probability
P
E
= P ( ≠ C), where the wrong class is assigned to the
audio-visual feature pair. In the present case, a good esti-
mation of the class of the source implies a correct esti-
mation of this source. Thus it implies to minimize the
probability P
e
= P ( ≠ S) of committing an error during
the estimation. The source estimate is inferred from the
audio and video measurements by evaluating their shared
quantity of information. However, these measurements
ˆ
S
ˆ
C
ˆ
C
ˆ
S
ˆ
S
Journal of NeuroEngineering and Rehabilitation 2008, 5:11 />Page 3 of 8
(page number not for citation purposes)
are generally corrupted by noise due to independent inter-
fering sources so that the source estimate and thus the
classifier performance might be poor.
Preliminarily to the classification, a feature extraction step
should be performed in order to possibly retrieve the
information present in each modality that originates from
the common source
S
while discarding the noise coming
from the interfering sources. Obviously, this objective can
only be reached by considering the two modalities
together. Now, given that such features
F
A
and
F
V
(viewed
hereafter as random variables defined on sample spaces
and ) can be extracted, the resulting multimodal
classification process is described by two first order
Markov chains, as shown on Fig. 1[8]. Notice that for the
sake of the explanation, the fusion at the decision or clas-
sifier level for obtaining a unique estimate of the class
is not represented on this graph.
F
A
and
F
V
describe specif-
ically the common source and are then related by their
joint probability
p
(
F
A
,
F
V
). Thus, an estimate of
F
V
,
respectively, of
F
A
, can be inferred from
F
A
, respec-
tively,
F
V
. This allows to define the transition probabilities
for
F
A
→ and
F
V
→ (since
p
( |
F
A
) =
p
(, F
A
)/
p
(
F
A
), and
p
(|
F
V
) =
p
(,
F
V
)/
p
(
F
V
)). Two estimation
error probabilities and their associated lower bounds can
be defined for these Markov chains, using Fano's inequal-
ity and the data processing inequality [5,8]:
where |Ω
S
| is the cardinality of S, I the mutual informa-
tion, and H the entropy. Since the probability densities of
and F
A
, respectively and F
V
, are both estimated
from the same data sequence A, respectively V, it is possi-
ble to introduce the following approximations:
I(F
A
, ) ≈ I(, F
V
) ≈ I(F
A
, F
V
). Moreover, the symmetry
property of mutual information allows to define a joint
lower bound on the classification error P
e
:
To be effcient, the minimization of P
e
should include the
minimization of its associated lower bound. This is done
by minimizing the right-hand term of inequality (3), that
is, by introducing a constraint on the feature extraction
step since it requires to maximize the mutual information
between the extracted features F
A
and F
V
. In order to both
decreases the lower bound on P
e
and try to get as close as
possible to this bound, a mutual information based esti-
mator denoted effciency coeffcient [5,8], is finally
defined:
Maximizing e(F
A
, F
V
) still minimizes the lower bound on
the error probability defined in Eq. (3) while constraining
inter-feature independence. In other words, the extracted
features F
A
and F
V
will tend to capture specifically the
information related to the common origin of A and V, dis-
carding the unrelated interference information. The inter-
ested reader is referred to [8] for more details.
Applying this framework to extract features, we expect to
minimize the probability of estimation error. However, to
minimize the probability P
E
of classification error, the last
step leading from to must be considered as well.
This part deals with the definition of a suitable classifier
and will be discussed later on.
Signal representation
Before applying the optimization framework previously
described to the problem at hand, both audio and video
signals have to be represented in a suitable way. Notice
that the representation chosen here does not need to be
the most optimal since an automatic feature optimization
step follows.
Physiological evidence points out the motion in the
mouth region as a visual clue for speech. It is estimated
Ω
F
A
Ω
F
V
ˆ
C
ˆ
F
V
ˆ
F
A
ˆ
F
V
ˆ
F
A
ˆ
F
V
ˆ
F
V
ˆ
F
A
ˆ
F
A
p
HS IF
A
F
V
S
e
1
1
.
() ( , )
,
−−
log Ω
(1)
p
HS IF
V
F
A
S
e
2
1
.
() ( , )
,
−−
log Ω
(2)
ˆ
F
A
ˆ
F
V
ˆ
F
V
ˆ
F
A
Pp
HS IF
A
F
V
S
eee
=
−−
{,}
() ( , )
.
12
1
.
log Ω
(3)
eF F
IF
A
F
V
HF
A
F
V
AV
(,)
(,)
(,)
[,].=∈01
(4)
ˆ
S
ˆ
C
Classification processFigure 1
Classification process. Graphical representation of the
related Markov chains which model the multimodal classifica-
tion process.
Journal of NeuroEngineering and Rehabilitation 2008, 5:11 />Page 4 of 8
(page number not for citation purposes)
using the Horn and Schunck gradient-based optical flow
[11]. This method leads to a pixel-based representation of
the motion and can then capture the complex motions of
non-rigid structures like the mouth. To cope with the
curse of dimensionality, one-dimensional (1D) video fea-
tures are preferred. The latter consist finally in the magni-
tude of the optical flow estimated over T frames in the
mouth regions (rectangular regions of size N × M pixels,
including the lips and the chin), signed as the vertical
velocity component. The mouth regions are roughly
extracted using the face detector depicted in [12]. The set
of {f
v, n
}
n = 1, N × M × (T-1)
observations of the video feature
forms the sample of the 1D random variable F
V
.
Mel-frequency cepstrum coeffcients (MFCCs), widely
used in the speech processing community, have been cho-
sen for the audio representation. They describe the salient
aspects of the speech signal, while being robust to varia-
tions in speaker or acquisition conditions [13]. The mel-
cepstrum is downsampled to the video feature rate, so that
we finally use a set of T - 1 vectors , each containing P
MFCCs:
{C
t
(i)}
i = 1, ,P
with t = 1, , T - 1 (the first coeffcient has
been discarded as it pertains to the energy).
Audio feature optimization
The information theoretic feature extraction previously
discussed is now used to extract audio features that com-
pactly describe the information common with the video
features. For that purpose, the 1D audio features f
a,t
(),
associated to the random variable F
A
are built as the linear
combination of the P MFCCs:
Thus, the set of (T - 1) P-dimensional observations is
reduced to (T - 1) 1D values f
a,t
( ). The optimal vector
could be obtained straightaway by minimizing the
effciency coeffcient given by Eq. (4). However, a more spe-
cific and constraining criterion is introduced here. This
criterion consists in the squared difference between the
effciency coeffcient computed in two mouth regions
(referred to as M
1
and M
2
). This way, the discrepancy
between the marginal densities of the video features in
each region are taken into account. Moreover, only one
optimization is performed for two mouths resulting in a
single set of optimized audio features. It implies however
that the potential number of speakers is limited to two in
the test audio-video sequences. If and denote the
random variables associated to regions M
1
and M
2
respec-
tively, then the optimization problem becomes:
The probability density functions required in the estima-
tion of the mutual information are estimated in a non-
parametric way using Parzen windowing. A global optimi-
zation method such as an Evolutionnary Algorithm can
finally be used to find the optimal set of weights [8].
Hypothesis testing as a classifier and an
evaluation tool
The previous section has shown how features specific to
the classification problem at hand can be extracted
through a multimodal information theoretic framework.
The application of this framework results in decreasing
the estimation error probability. But the question of min-
imizing the probability P
E
of committing an error on the
whole classification process still remains. It relies on the
choice of a classifier able to classify the extracted features
as correctly as possible.
Hypothesis testing for classification
Hypothesis tests are used in detection problems in order
to take the most appropriate decision given an observa-
tion x of a random variable X. In the problem at hand, the
decision function has to decide whether two measure-
ments A and V (or their corresponding extracted features
F
A
and F
V
) originate from a common bimodal source S –
the speaker – or from two independent sources – speech
and video noise. As previously stated, the problem of
deciding between two mouth regions which one is
responsible for the simultaneously recorded speech audio
signal can be solved by evaluating the synchrony, or
dependence relationship, that exists between this audio
signal and each of the two video signals.
From a statistical point of view, the dependence between
the audio and the video features corresponding to a given
mouth region can be expressed through a hypothesis
framework, as follows:
H
0
: f
a
, f
v
~ P
0
= P (f
a
) · P (f
v
),
H
1
: f
a
, f
v
~ P
1
= P (f
a
, f
v
).
H
0
postulates the data f
a
and f
v
to be governed by a proba-
bility density function stating the independence of the
video and audio sources. The mouth region should there-
fore be labeled as "non-speaker". Hypothesis H
1
states the
G
C
t
G
α
fiCitT
at t
i
P
,
( ) ( ) ( ) , , .
GG
αα
=⋅∀=−
=
∑
1
11
(5)
G
α
G
α
F
V
1
F
V
2
GGG
G
ααα
α
opt V A V A
eF F eF F=−arg max{[ ( , ( )) ( , ( ))] }.
12
2
(6)
G
α
Journal of NeuroEngineering and Rehabilitation 2008, 5:11 />Page 5 of 8
(page number not for citation purposes)
dependence between the two modalities: the mouth
region is then associated to the measured speech signal
and classified as "speaker". The two hypothesis are obvi-
ously mutually exclusive. In the Neyman-Pearson
approach [10] certain probabilities associated with the
hypothesis test are formulated. The false-alarm probabil-
ity P
FA
, or size
α
of the test, is defined as:
while the detection probability P
D
, or power
β
of the test,
is given by:
The Neyman-Pearson criterion selects the most powerful
test of size
α
: the decision rule should be constructed so
that the probability of detection is maximal while the
probability of false-alarm do not exceed a given value
α
.
Using the log-likelihood ratio, the Neyman-Pearson test
can be expressed as follows:
The test function must then decide which of the hypothe-
sis is the most likely to describe the probability density
functions of the observations f
a
and f
v
, by finding the
threshold
η
that will give the best test of size
α
.
The mutual information is a metric evaluating the dis-
tance between a joint distribution stating the dependence
of the variables and a joint distribution stating the inde-
pendence between those same variables:
The link with the hypothesis test of Eq. (7) seems straight-
forward. Indeed, as the number of observations f
a
and f
v
grows large, the normalized log-likelihood ratio
approaches its expected value and becomes equal to the
mutual information between the random variables F
A
and
F
V
[9]. The test function can then be defined as a simple
evaluation of the mutual information between audio and
video random variables, with respect to a threshold
η
.
This result differs from the approach of Fisher et al. in [6],
where the mouth region which exhibits the largest mutual
information value is assumed to have produced the
speech audio signal. The formulation of the hypothesis
test with a Neyman-Pearson approach allows to define a
measure of confidence on the decision taken by the classi-
fier, in the sense that the
α
-
β
trade-off is known. Consid-
ering that two mouth regions could potentially be
associated to the current audio signal and defining one
hypothesis test (with associated thresholds
η
1
and
η
2
) for
each of these regions, four different cases can occur:
1. I
1
(F
A
, ) >
η
1
and I
1
(F
A
, ) <
η
2
: speaker 1 is speak-
ing and speaker 2 is not;
2. I
1
(F
A
, ) <
η
1
and I
1
(F
A
, ) >
η
2
: speaker 2 is speak-
ing and speaker 1 is not;
3. I
1
(F
A
, ) <
η
1
and I
1
(F
A
, ) <
η
2
: none of the speaker
is speaking;
4. I
1
(F
A
, ) >
η
1
and I
1
(F
A
, ) >
η
2
: both speakers are
speaking.
The experimental conditions are defined so as to elimi-
nate the possibilities 3 and 4: the test set is composed of
sequences where speakers 1 and 2 are speaking each in
turn, without silent states. This allows, in the context of
this preliminary work, to define the simpler following
cases: if a speaker is silent, it implies that the other one is
actually speaking. Notice also that a possible equality with
the threshold is solved by attributing randomly a class to
the random variable pair.
Hypothesis testing for performance evaluation
The formulation of the previous hypothesis test gives
means for evaluating the whole classification chain per-
formance. Receiver Operating Characteristic (ROC)
graphs allow to visualize and select classifiers based on
their performance [14]. They permit to crossplot the size
and power of a Neyman-Pearson test, thus to evaluate the
ability of a classifier to produce good relative instance
scores. Our purpose here is not to focus only on the eval-
uation on the classifier itself but on the possible gain
offered by the introduction of the feature optimization
step in the complete pattern recognition process. To this
end, two kinds of audio features are used in turn to esti-
mate the mutual information in each mouth region: the
first ones are the linear combination of the MFCCs result-
ing from the optimization described previously; the sec-
ond ones consist simply in the mean value of these
MFCCs. The results about this comparison are presented
in the next section.
Results
Firstly, the ability of hypothesis testing to act as a classifier
is discussed. The evaluation of the possible gain offered by
using optimized audio features with respect to simpler
ones is addressed next.
α
== =PH H H H(|),
01
(7)
β
== =PH H H H(|).
11
(8)
Λ(,) log
(,)
()()
,ff
pf
a
f
v
pf
a
pf
v
av
=
⋅
⎡
⎣
⎢
⎤
⎦
⎥
Q
η
(9)
IF F pf f
pf
a
f
v
pf
a
pf
v
AV av
f
vF
(,) (,)log
(,)
()()
=
⋅
⎛
⎝
⎜
⎞
⎠
⎟
⎡
⎣
⎢
⎢
⎤
⎦
⎥
⎥
∈Ω
VV
aF
A
f
∑∑
∈Ω
.
(10)
F
V
1
F
V
2
F
V
1
F
V
2
F
V
1
F
V
2
F
V
1
F
V
2
Journal of NeuroEngineering and Rehabilitation 2008, 5:11 />Page 6 of 8
(page number not for citation purposes)
Experimental protocol
The sequence test set is composed of the eleven two-
speaker sequences g11 to g22 taken from the CUAVE data-
base [15], where each speaker utters in turn two digit
series (notice that g18 has been discarded as it exhibits
strong noise due to the compression). These sequences are
shot in the NTSC standard (29.97 fps, 44.1 kHz stereo
sound). For the purpose of the experiments, the problem
has been restricted to the case where one of the speaker
and only one of them is speaking in any case. Therefore,
the last seconds of the video clips where the two speakers
are speaking all together, as well as the silent frames –
labelled as in [16] – have been discarded.
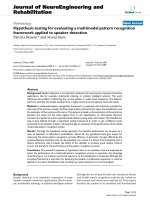
For all the sequences, the
N
×
M
mouth regions are
extracted, using the face detector given in [12] (
N
and
M
varying between 30 and 60 pixels, depending on speakers'
characteristics and acquisition conditions). A frame exam-
ple taken from the CUAVE database is shown in Fig. 2,
together with the corresponding extracted mouth regions
(white boxes).
The video feature set is composed of the
N
×
M
× (
T
- 1)
values of the optical flow norm at each pixel location (T
being the number of video frames within the analyzing
window,
i.e
.
T
= 60 frames). From the audio signal, 12
mel-cepstrum coeffcients are computed using 30 ms
Hamming windows.
The optimization is done over a 2 second temporal win-
dow, shifted by one second steps over the whole sequence
to take decisions every seconds. The output of the classi-
fier for each window is compared to the corresponding
ground truth label, defined as in [16]. The test set is even-
tually composed of 188 test points (windows), with one
audio and one video instances for each window. The two
classes, "speaker1" (speaker on the left of the image) and
"speaker2" (speaker on the right) are well balanced since
theirs set sizes are 95 and 93 respectively.
Performance of hypothesis testing as a classifier
The classifier is defined as the test function giving the best
test of size
α
and receives the optimized audio features at
input.
For binary tests, a positive and a negative class have to be
defined. We assume the positive class to be the class
"speaker" for each test. More precisely, since the experi-
mental conditions implies that there is always one speaker
speaking, the positive class is the label of the mouth
region where the test is performed:
i.e
, "speaker1" for test1
(defined between the random variables
F
A
and
F
V
1
), and
"speaker2" for test2. Table 1 compares the power of the
tests for given sizes
α
.
Let us introduce now the accuracy of a test as the sum of
the true positive and true negative rates divided by the
total number of positive and negative instances [14].
Table 2 gives the classifier scores for the threshold corre-
sponding to each test best accuracy: 86.7% and 85.11%
for test1 and test2 respectively, obtained for thresholds
η
1
= 0.18 and
η
2
= 0.19.
These results indicate hypothesis test as a good method
for assigning a speaker class to mouth regions, with a
given
α
-
β
trade-off (thus greater adaptability to changes of
the target condition or the classification requirement).
The classifier produces better relative instance scores for
test1. However, the thresholds giving the best accuracy
values are about the same for the two tests. This tends to
Table 2:
β
and
α
for best accuracy values. Power
β
and size
α
for
each class of each test at its best accuracy value.
Test1 Test2
Positive class Negative class Positive class Negative class
β
87.4% 86.0% 91.4% 79.0%
α
14.0% 12.6% 21.0% 8.6%
Frame example from the CUAVE databaseFigure 2
Frame example from the CUAVE database. Frame
example taken from the sequence g13 of the CUAVE data-
base [15]. The white boxes delimited the extracted mouth
regions.
Table 1: Power of the tests for given sizes. Power
β
of the tests
for different sizes
α
. The thresholds
η
defining the corresponding
decision functions are also indicated.
Test1 Test2
α
5% 10% 20% 5% 10% 20%
β
37.9% 81.1% 90.5% 4.3% 24.7% 89.26%
η
0.41 0.25 0.16 0.55 0.45 0.25
Journal of NeuroEngineering and Rehabilitation 2008, 5:11 />Page 7 of 8
(page number not for citation purposes)
indicate that this threshold is not speaker dependent. Fur-
ther tests on larger test sets would be necessary however
for a more precise analysis of the classifier capacity.
Evaluation of the pattern recognition process performance
The advantage of using optimized audio features against
simple ones at the input of the classifier is now discussed.
As in the previous paragraph, two tests are considered,
with the positive classes being respectively the "speaker 1"
and the "speaker 2". The ROC graphs corresponding to
each test are plotted on Figs. 3 and 4. An analysis of these
curves shows that the classifier fed in with the optimized
audio features performs better in the conservative region
of the graph (northwest region).
Table 3 sums up some interesting values attached to the
ROC curve such as the area under the curve (AUC), or the
accuracy with corresponding thresholds. Whatever the
way of considering the problem, the use of the optimized
audio features improved the classifier average perform-
ance, as stated by the theory.
Conclusion
This work addresses the problem of labeling mouth
regions extracted from audio-visual sequences with a
given speaker class label. The system uses a simple mate-
rial, namely a single microphone and camera. The detec-
tor must then analyze jointly the audio and video
information to come to a decision. The problem is cast in
a hypothesis testing framework, linked to information
theory. The resulting classifier is based on the evaluation
of the mutual information between the audio signal and
the mouths' video features with respect to a threshold,
issued from the Neyman-Pearson lemma. A confidence
level can then be assigned to the classifier outputs. This
allows firstly to adapt the classifier to changes of the target
condition or of the classification requirement. Secondly,
this approach results in the definition of an evaluation
framework. The latter is not only used to determine the
performance of the classifier itself, but considers rather
rating the whole pattern recognition process effciency.
In particular, it is used to check whether a feature extrac-
tion step performed prior to the classification can increase
the accuracy of the detection process. Optimized audio
Table 3: Area under the curves. Area under the curve and accuracy with the corresponding threshold
η
for each test.
Test 1 Test 2
Input features MFCCs mean Optimized audio features MFCCs mean Optimized audio features
AUC 0.88 0.92 0.75 0.84
Accuracy 84, 6% 86, 7% 73, 4% 85, 1%
η
0.14 0.18 0.10 0.19
ROC graph for test1Figure 3
ROC graph for test1. ROC graph for test 1. The detection
probability for the positive class is plotted versus the false-
alarm rate.
0 0.1 0.2 0.3 0.4 0.5 0.6 0.7 0.8 0.9 1
0
0.1
0.2
0.3
0.4
0.5
0.6
0.7
0.8
0.9
1
α
β
Optimized audio features
MFCC mean
ROC graph for test2Figure 4
ROC graph for test2. ROC graph for test 2. The detection
probability for the positive class is plotted versus the false-
alarm rate.
0 0.1 0.2 0.3 0.4 0.5 0.6 0.7 0.8 0.9 1
0
0.1
0.2
0.3
0.4
0.5
0.6
0.7
0.8
0.9
1
α
β
Optimized audio features
MFCC mean
Publish with BioMed Central and every
scientist can read your work free of charge
"BioMed Central will be the most significant development for
disseminating the results of biomedical research in our lifetime."
Sir Paul Nurse, Cancer Research UK
Your research papers will be:
available free of charge to the entire biomedical community
peer reviewed and published immediately upon acceptance
cited in PubMed and archived on PubMed Central
yours — you keep the copyright
Submit your manuscript here:
/>BioMedcentral
Journal of NeuroEngineering and Rehabilitation 2008, 5:11 />Page 8 of 8
(page number not for citation purposes)
features obtained through an information theoretic fea-
ture extraction framework feed the classifier, in turn with
non-optimized audio features. Analysis tools derived
from hypothesis testing, such as ROC graphs, establish
eventually the performance gain offered by introducing
the feature extraction step in the process.
As far as the classifier itself is concerned, more intensive
tests should be performed in order to draw robust conclu-
sions. However, preliminary remarks tend to indicate that
a hypothesis-based model can be used with advantage for
multimodal speaker detection. It would also be interest-
ing to consider in future works the cases of simultaneous
silent or speaking states (cases 3 and 4 defined previ-
ously).
As a final remark, let us stress that the multimodal pattern
recognition framework we propose does not apply exclu-
sively to speaker detection. It can be used with advantage
for other applications, provided bimodal signals co-occur-
ring in space and time are involved. One might think for
example to medical applications where several synchro-
nized biological signals exist and are to be processed to
come to a diagnostic.
Competing interests
The author(s) declare that they have no competing inter-
ests.
Authors' contributions
A complete multimodal pattern recognition approach has
been proposed. It is applied here for detecting the speaker
in audio-video sequences but could be applied to other
pattern recognition tasks involving bimodal signals co-
occurring in space and time. An information theoretic fea-
ture extraction is performed prior to the classification. The
definition of the classification step through a hypothesis
testing framework is the main contribution of this work.
It completes the pattern recognition process as it gives
means for evaluating the performance of the classifier as
well as of the whole pattern recognition process.
Acknowledgements
This work is supported by the SNSF through grant no. 2000-06-78-59. The
authors would like to thanks Dr. J M. Vesin, J. Richiardi and U. Hoffmann
for fruitful discussions.
References
1. Potamianos G, Neti C, Gravier G, Garg A, Senior AW: Recent
advances in the automatic recognition of audio-visual
speech. Proceedings of IEEE 2003, 91(9):1306-1326.
2. Ras E, Becker M, Koch J: Engineering Tele-Health Solutions in
the Ambient Assisted Living Lab. In 21st International Conference
on Advanced Information Networking and Applications Workshops
(AINAW'07) Volume 2. Niagara Falls, Canadax; 2007:804-809.
3. Hershey J, Movellan J: Audio-Vision: Using Audio-Visual Syn-
chrony to Locate Sounds. In Proceeding of NIPS Volume 12. Den-
ver, CO, USA; 1999:813-819.
4. Nock HJ, Iyengar G, Neti C: Speaker Localisation Using Audio-
Visual Synchrony: An Empirical Study. In Proceedings of CIVR
Urbana, IL, USA; 2003:488-499.
5. Butz T, Thiran JP: From error probability to information theo-
retic (multi-modal) signal processing. Signal Processing 2005,
85:875-902.
6. Fisher JW III, Darrell T: Speaker association with signal-level
audiovisual fusion. IEEE Transactions on Multimedia 2004,
6(3):406-413.
7. Besson P, Popovici V, Vesin JM, Thiran JP, Kunt M: Extraction of
Audio Features Specific to Speech using Information Theory
and Differential Evolution. 2005 [ />record/87173]. Tech Rep TR-ITS-2005.018, École Polytechnique
Fédérale de Lausanne (EPFL), Lausanne, Switzerxland
8. Besson P, Popovici V, Vesin JM, Thiran JP, Kunt M: Extraction of
Audio Features Specific to Speech Production for Multimo-
dal Speaker Detection. IEEE Transactions on Multimedia 2008,
10:63-73.
9. Ihler AT, Fisher JW III, Willsky AS: Nonparametric Hypothesis
Tests for Statistical Dependency. IEEE Transactions on Signal
Processing 2004, 52(8):2234-2249.
10. Moon TK, Stirling WC: Mathematical Methods and Algorithms for Signal
Processing Prentice hall; 2000.
11. Horn BKP, Schunck BG: Determining optical flow. Artificial Intelli-
gence 1981, 17:185-203.
12. Meynet J, Popovici V, Thiran JP: Face Detection with Boosted
Gaussian Features. Pattern Recognition 2007, 40(8):2283-2291.
13. Gold B, Morgan N: Speech and audio signal processing John Wiley &
sons, Inc; 2000.
14. Fawcett T: ROC Graphs: Notes and practical considerations
for researchers. 2003 [ />public_html/papers/ROC101.pdf]. Tech Rep HPL-2003–4, HP Labo-
ratories
15. Patterson EK, Gurbuz S, Tufekci Z, Gowdy JN: CUAVE: a new
audio-visual database for multimodal human-computer
interface research. Proceedings of ICASSP, Orlando 2002,
2:2017-2020.
16. Besson P, Monaci G, Vandergheynst P, Kunt M: Experimental eval-
utation framework for speaker detection on the CUAVE
database. 2006 [ />]. Tech Rep
TR-ITS-2006.003, École Polytechnique Fédérale de Lausanne (EPFL),
Lausanne, Switzerland