Báo cáo hóa học: " Accelerometer-based wireless body area network to estimate intensity of therapy in post-acute rehabilitation" pptx
Bạn đang xem bản rút gọn của tài liệu. Xem và tải ngay bản đầy đủ của tài liệu tại đây (5.72 MB, 11 trang )
BioMed Central
Page 1 of 11
(page number not for citation purposes)
Journal of NeuroEngineering and
Rehabilitation
Open Access
Research
Accelerometer-based wireless body area network to estimate
intensity of therapy in post-acute rehabilitation
Stéphane Choquette
1,2
, Mathieu Hamel
1
and Patrick Boissy*
1,2,3
Address:
1
Research Centre on Aging, Health and Social Services Centre, Sherbrooke Geriatric University Institute, Quebec, Canada,
2
Faculty of
Physical Education and Sports, Department of Kinesiology, Université de Sherbrooke, Sherbrooke, Quebec, Canada and
3
Center of Excellence in
Information Engineering, Université de Sherbrooke, Sherbrooke, Quebec, Canada
Email: Stéphane Choquette - ; Mathieu Hamel - ;
Patrick Boissy* -
* Corresponding author
Abstract
Background: It has been suggested that there is a dose-response relationship between the amount of
therapy and functional recovery in post-acute rehabilitation care. To this day, only the total time of therapy
has been investigated as a potential determinant of this dose-response relationship because of
methodological and measurement challenges. The primary objective of this study was to compare time and
motion measures during real life physical therapy with estimates of active time (i.e. the time during which
a patient is active physically) obtained with a wireless body area network (WBAN) of 3D accelerometer
modules positioned at the hip, wrist and ankle. The secondary objective was to assess the differences in
estimates of active time when using a single accelerometer module positioned at the hip.
Methods: Five patients (77.4 ± 5.2 y) with 4 different admission diagnoses (stroke, lower limb fracture,
amputation and immobilization syndrome) were recruited in a post-acute rehabilitation center and
observed during their physical therapy sessions throughout their stay. Active time was recorded by a
trained observer using a continuous time and motion analysis program running on a Tablet-PC. Two
WBAN configurations were used: 1) three accelerometer modules located at the hip, wrist and ankle (M3)
and 2) one accelerometer located at the hip (M1). Acceleration signals from the WBANs were
synchronized with the observations. Estimates of active time were computed based on the temporal
density of the acceleration signals.
Results: A total of 62 physical therapy sessions were observed. Strong associations were found between
WBANs estimates of active time and time and motion measures of active time. For the combined sessions,
the intraclass correlation coefficient (ICC) was 0.93 (P ≤ 0.001) for M3 and 0.79 (P ≤ 0.001) for M1. The
mean percentage of differences between observation measures and estimates from the WBAN of active
time was -8.7% ± 2.0% using data from M3 and -16.4% ± 10.4% using data from M1.
Conclusion: WBANs estimates of active time compare favorably with results from observation-based
time and motion measures. While the investigation on the association between active time and outcomes
of rehabilitation needs to be studied in a larger scale study, the use of an accelerometer-based WBAN to
measure active time is a promising approach that offers a better overall precision than methods relying on
work sampling. Depending on the accuracy needed, the use of a single accelerometer module positioned
on the hip may still be an interesting alternative to using multiple modules.
Published: 2 September 2008
Journal of NeuroEngineering and Rehabilitation 2008, 5:20 doi:10.1186/1743-0003-5-20
Received: 14 December 2007
Accepted: 2 September 2008
This article is available from: />© 2008 Choquette et al; licensee BioMed Central Ltd.
This is an Open Access article distributed under the terms of the Creative Commons Attribution License ( />),
which permits unrestricted use, distribution, and reproduction in any medium, provided the original work is properly cited.
Journal of NeuroEngineering and Rehabilitation 2008, 5:20 />Page 2 of 11
(page number not for citation purposes)
Background
Post-acute rehabilitation is a key component of the health
care delivery system, yet we know little about the active
ingredients of the rehabilitation process that produce the
best outcomes [1]. Rehabilitation care has been compared
to a black box [2] or a Russian doll [3]. The measurement
of rehabilitation interventions is thus acknowledged to be
amongst the major methodological challenges to con-
ducting research in this area [1].
Evidence suggests that the amount of therapy during reha-
bilitation shares a dose-response relationship with func-
tional outcomes. In fact, a meta-analysis has reported
increases in functional recovery of stroke patients with
increased hours of therapy throughout the length of stay
[4]. In addition, more hours of therapy each day may
shorten the length of stay of orthopedic and stroke
patients [5].
Regarded as the most active component of rehabilitation,
total time of therapy has been referred to as the "intensity"
of rehabilitation [4,6,7]. This denomination may be mis-
leading [8] since time spent in organized therapy is prob-
ably not an accurate portrait of the therapies intensity and
contents and their link with functional outcome changes.
It has been suggested that investigations on determinants
of post-acute rehabilitation processes should focus on
specific aspects of therapy instead of total time of therapy
[9]. The assessment of the effectiveness of rehabilitation
procedures has been limited to the laboratory setting; rel-
atively little is known about rehabilitation in real-life sit-
uations.
Active time, or the time during which a patient is physi-
cally active, has been suggested as a key factor in func-
tional recovery [10,11]. Large inter-individual variations
in the time in which a patient is physically active are to be
expected because of a patient's motivation, health status,
physical capabilities and medication [4]. Such variations
have been reported in previous studies [12,13] and could
mean that active time may be a better indicator of rehabil-
itation intensity than total time of therapy. Large-scale
longitudinal studies are necessary to explore associations
between active time and functional recovery.
In the past, specific aspects of therapy have been docu-
mented using retrospective analysis of medical records
[4,14,15] or observational methods [10-13]. Observa-
tional studies are conducted by having a trained observer
follow the patient for a predetermined period of time to
record the duration of activities and/or mobilization.
Observational approaches like work sampling [10,11]
and time and motion [12,13] have been used in rehabili-
tation. Time and motion (TM) is recognized as the most
precise approach to collect valid data on clinical practices
in the health field [16]. Unfortunately, data collection and
processing in time and motion studies are both resource-
consuming. Consequently, observational studies in reha-
bilitation have only been descriptive in nature and con-
ducted for only a few consecutive days [10,11,13,17].
Methods more efficient than observation are needed to
measure active time in rehabilitation. Miniature, wireless,
and wearable technology offers a tremendous opportu-
nity to address this issue. Recent technological advances
in integrated circuits and wireless communications have
led to the development of Wireless Body Area Networks
(WBANs). Wireless body area networks may be a viable
alternative to measure active time. They can include a
number of physiological sensors depending on the end-
user application, are well suited for ambulatory monitor-
ing and provide specific information about an individ-
ual's behavior without using complex laboratory
equipment and without interfering with the person's nat-
ural behavior [18].
WBANs have been used in at least two studies to monitor
heart rate in rehabilitation settings. MacKay-Lyons et al.
(2002) observed that only a mean of 2.8 ± 0.9 min and
0.7 ± 0.2 min, for physical and occupational therapy ses-
sions respectively, were spent in a targeted heart rate zone
that could illicit an improvement in cardiovascular capac-
ity [19]. Gage et al. (2007) also found that there were little
differences in heart rate between the execution of low and
high therapeutic activities [13]. Consequently, it was con-
cluded that cardiovascular stress does not reflect therapeu-
tic activities in rehabilitation [13,19].
Kinematics has been suggested as a better alternative to
estimate mobilization and active time in rehabilitation
[13]. Accelerometers have gained recognition as an inter-
esting way to measure physical activity in the population
[20]. They can record intensity and duration of activities
through movement accelerations [21]. Therefore, they
may constitute a convenient approach to measure active
time during therapy sessions.
In order to alleviate the burden of observational methods
in the investigation of active time of therapy, the primary
objective of this study was to compare, with patients dur-
ing real life physical therapy, time and motion measures
with estimates of active time (i.e. the time during which a
patient is active physically) obtained with a wireless body
area network (WBAN) of 3D accelerometer modules posi-
tioned at the hip, wrist and ankle. The secondary objective
was to assess the differences in estimates of active time
when using a single accelerometer module positioned at
the hip.
Journal of NeuroEngineering and Rehabilitation 2008, 5:20 />Page 3 of 11
(page number not for citation purposes)
Methods
Study design
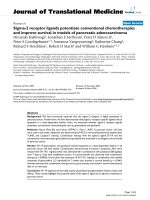
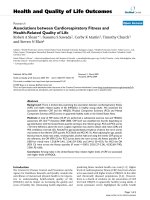
Participants were observed continuously during their
physical therapy sessions while accelerometer signals
from a WBAN were recorded simultaneously (Figure 1). A
sample of convenience was recruited from the Intensive
Functional Rehabilitation Unit (IFRU) of the Health and
Social Services Centre – Sherbrooke Geriatrics University
Institute. Patients were eligible to participate if they were
over 65 years old and were admitted to the IFRU following
discharge from an acute hospital. Patients presenting cog-
nitive deficits that would compromise their capacities to
understand the nature of their participation in the study
were excluded.
Participants were recruited about one week after their
admission to the IFRU. Their participation in the study
began immediately after written consent was obtained
and continued until discharge, with three to five physical
therapy sessions observed each week. All observations
were conducted by the same observer. Ten minutes before
each physical therapy session, three wireless accelerome-
ters modules were attached to the patient by the observer.
Recordings began as soon as the therapist made contact
with the patient in the therapy unit. The therapy was con-
ducted by the clinicians without any intervention from
the observer.
Participants were evaluated prior to the beginning of the
observations using a battery of standardized clinical tests
that included variables such as functional autonomy
(SMAF) [22], balance (Berg) [23], Timed-up-and-go
(TUG) [24], and the 5m-Walk test [25]. The SMAF (Func-
tional Autonomy Measurement System) is designed for
clinical use in connection with a home support program
or for admission and monitoring of clients in geriatric
services and residential facilities. The median total SMAF
score varies according to living environment (13.5 own
home, 29.0 intermediate resources and 55.0 long-term
care institutions) and nursing care time. The institutional
Time and motion observations and recording of body accelerationsFigure 1
Time and motion observations and recording of body accelerations. The WBAN used in this study was comprised of three 3D
accelerometers modules. Signals recorded by accelerometers were transmitted to a receiver located on the Tablet-PC. The
Tablet-PC recorded WBAN's data in background, while an observer noted time and motion parameters of the session. All data
was synchronized on a common timeline.
Journal of NeuroEngineering and Rehabilitation 2008, 5:20 />Page 4 of 11
(page number not for citation purposes)
review board of the HSSC-UIGS approved this study.
Informed consent was obtained for all participants.
Time and motion measurements
Observations were recorded using a continuous TM anal-
ysis program running on a Tablet-PC (Intronix DuoT-
ouch). Each session was divided into groups of activities
according to the treatment objectives and methods used.
The classification used to divide the therapeutic activities
is adapted from the classification proposed by Dejong
[26]. It is a simplified version of a grid that has been vali-
dated in a previous study [12]. This grid was based on the
theoretical construct of the Functional Autonomy Meas-
urement System (SMAF) [27]. It contained a total of 38
categories of activities covering frequent objectives tar-
geted by interventions in physical therapy, occupational
therapy and speech-language therapy (e.g. use stairs, dress
oneself). In the present study, observations were made
only in physical therapy sessions. Therefore, fewer catego-
ries of activities were needed.
Based on frequency analyses made from data collected in
a previous study in post-acute rehabilitation, we reduced
the original grid to 8 categories. Those categories were:
Antalgic therapy (application of ice or warmth, massage,
ultra-sound, etc.), Balance (staying upright for a given
amount of time), Gait (all walking activities performed
inside the hospital, on the floor or on a treadmill, using
whatever walking aids necessary), Outdoor walking
(walking outside of the hospital walls), Reinforcement
(activities that aimed to strengthen, sometimes with addi-
tional resistance, specific muscle groups, either with repet-
itive movements or isometric contractions), Prosthesis
(all activities related to the installation or the adjustment
of a prosthesis), Stairs (climbing stairs, up and down),
Weight bearing (various activities where the goal is to put
weight on the limbs) and Others (all other activities that
does not fit in any of the other 7 categories).
For each activity, the observer classifies the time spent by
the patient as active time or passive time. Active time is
defined as the time during which the patient is physically
active, in preparation or execution of a task-oriented
action. The patient does not have to be in company of the
therapist. By implication, the presence of the therapist
does not mean systematically that the patient is "active".
During passive time, the patient is not physically active or
receiving treatment. For example, the patient is "passive"
when he sits on a chair, resting between two activities. He
is still "passive" when the therapist is explaining to him
the objective of an upcoming activity. However, he is con-
sidered "active" as soon as he begins to rise from its chair
to prepare for an activity. Therefore, a patient is consid-
ered "active" if he is walking to reach a flight of stairs, even
if the activity is "Stairs". Finally, time clocks for active and
passive time were incremented by the observer.
WBAN and estimates of active time
The WBAN used in this study is configured with three
wireless sensor modules, each comprised of a custom sen-
sor board with an embedded three axial (3D) accelerom-
eter (LIS3L02AQ, STMicroelectronics) and a
communication module with a microcontroller and ana-
log-to-digital converter (MICAz Crossbow Technology).
The WBAN system used in this study has been described
elsewhere [28]. Data was sampled and recorded at 50 Hz.
Wireless sensor modules were embedded in bracelets that
could be attached to the body. Modules were installed on
the dominant hand, the contra lateral ankle and on the
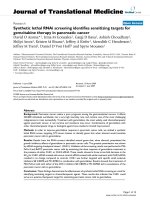
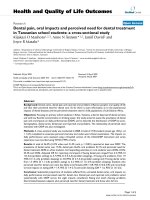
right hip. Active time was estimated by extracting the tem-
poral density of the acceleration signals (Figure 2). Raw
signals from separate axes and modules were combined,
low-pass filtered (Butterworth, 1 Hz, 2
nd
Order), rectified
and high-pass filtered (Butterworth, 5 Hz, 2
nd
Order).
Data was then saturated in order to obtain a binary signal.
Samples with a value above the noise baseline (15 mV),
were considered as movements and were associated with
a logic high state (ones). All other samples were modified
to a low state (zeros). A rectangular rolling window with
a length of 10 seconds extracted the envelope of the binary
signal and attenuated isolated peaks of acceleration which
were not related to physical activity, thus generating a sig-
nal with values varying between 0 and 1. Another thresh-
old, optimized with data from first session observed, was
fixed at 0.5. Every sample equal or above 0.5 was consid-
ered as movement. The cumulative of these samples
yielded an estimate of active time.
Variables and statistical analysis
The variables are 1) the measure of active time, obtained
by TM observations and 2) the estimates of active time
obtained with WBANs' recording of body acceleration.
Two WBAN configurations were used to evaluate the
potential of accelerometers to estimate active time in reha-
bilitation: M3) three accelerometer modules located at the
hip, wrist and ankle, and M1) one accelerometer located
at the hip.
Descriptive statistics were used to document variability in
measurements across subjects. Intraclass correlation coef-
ficients (ICC) were used to evaluate the association
between estimates and measurements of active time. The
difference of agreement between the reference measure of
active time (Time motion) and estimates (M3 and M1)
were evaluated with Bland-Altman plots [29,30]. Finally,
Paired-Sample T Tests were used to assess the differences
in the degree of agreement of the measure of active time
between M3 and M1.
Journal of NeuroEngineering and Rehabilitation 2008, 5:20 />Page 5 of 11
(page number not for citation purposes)
Level of agreement between active time measured with
both methods (WBAN and TM) was set at 20%. Since
there is no actual gold-standards in for the accurate meas-
urement of active time in rehabilitation, setting a critical
margin of agreement between methods is somewhat arbi-
trary. However, a level of agreement of 20% appears to be
a reasonable cut level inside which the use of a WBAN, in
this particular context, would be justified. This assertion is
based on available literature that compares work-sam-
pling methods and TM analysis in the health services liter-
ature [16,31,32]. Reported mean error between TM and
work sampling is at least 20%, in the most favorable activ-
ities. Level of agreement is generally far worse. Therefore,
a level of agreement of 20% would assure that our WBAN-
based system performs better than what is considered in
the present as one of the best available compromise
between accuracy and feasibility. This would yield prelim-
inary support to further research efforts in that field.
Statistical analyses were computed using cumulative data
from therapy sessions and segmented activities during
therapy sessions. Analyses and graphs were completed
using SPSS 15.0 program (Chicago, IL). The statistical sig-
nificance threshold was set at p ≤ 0.05.
Results
Five patients (77.4 ± 5.2 y) with 4 different admission
diagnoses were recruited in this study. The participants'
clinical profiles are presented in Table 1. Disability scores
on the SMAF scale [22] varied from -19 to -40 (mean -32.4
± 8.4 on a total of -87) and were linked to physical impair-
ments secondary to stroke, lower limb fracture, amputa-
tion and immobilization syndrome. In all the patients,
the use of a walker was needed to perform their daily
activities. On the Berg balance scale, balance disability
varied from 5 to 37 out of a possible total score of 56.
A total of 62 physical therapy sessions were observed
(Table 1). The total number of observed sessions for each
patient varied from 8 to 20, with a mean of 12 ± 5.2 ses-
sions. Variations in the number of sessions reflect differ-
ent lengths of stay at the IFRU. Time and motion results
showed that the mean active time recorded per session
was 27.0 ± 11.1 min for a mean total time of 47.8 ± 12.2
min. Density of therapy, the ratio of active time on total
time, was 56.5% for combined sessions. In addition, 295
activities were observed for four patients (the segmenta-
tion of sessions was not possible for subject 1 because
software malfunction). Only 8 categories of activities had
sufficient occurrences (N ≥ 6) to allow analyses. Other
activities represented about 4% of the total number of
activities (N = 13) and were regrouped under the category
"Others".
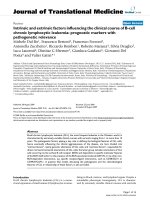
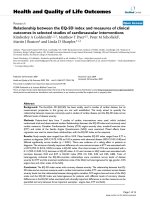
Figure 3 presents fluctuations in active time during the
entire length of stay in the rehabilitation unit, paralleled
Estimation of active time with accelerometers signalsFigure 2
Estimation of active time with accelerometers signals. The three steps of signal transformation are presented in A: 1-Rectified
signal, 2-Binary signal and 3-Temporal density. In B, the rectified signal is transformed in a binary signal: all samples above 0.015
Volts (dotted line) are given a value of "1", while samples below equal zero. In C, temporal density is obtained by filtering binary
signal with a rolling window of 10 sec. Then, all samples above 0.5 (dotted line) is cumulated to give the active time estimate.
060
0
1
Time (minutes)
Volts
15 30 45
Rectified
Binary
Temporal density
2
3
A
B
C
Journal of NeuroEngineering and Rehabilitation 2008, 5:20 />Page 6 of 11
(page number not for citation purposes)
with estimates of active time from M1 and M3. Cumula-
tive value of active time for each method is presented on
the right side of the figure. Estimates systematically under-
estimate active time, when compared to TM measure-
ments. The mean percentage of differences between
measure and estimate is -8.7% ± 2.0% (range: -5.85% to -
11.44%) for M3 and -16.4% ± 10.4% (range: -5.53% to -
28.52%) for M1.
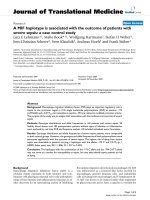
Scatter plots of estimates by measure of active time are
presented for observed sessions in Figure 4. For combined
sessions, ICC was 0.93 (P ≤ 0.001) for M3 and 0.79 (P ≤
0.001) for M1. ICC was also performed for each subject.
All correlations were significant (P ≤ 0.01). The ICC of
subjects ranged from 0.65 to 0.98 for M3 and from 0.63
to 0.89 for M1.
ICC results for activity categories are presented in Table 2.
For all categories except "Antalgic therapy", association
between estimate and measure of active time was signifi-
cant (P ≤ 0.05) for M1 and M3. ICC varied from 0.68 to
0.95 for M3 and from 0.55 to 0.93 for M1. Ambulatory
activities, like "Gait", "Stairs" and "Walking, outdoor",
displayed the highest associations for M3, but not for M1.
Differences between reference measure (TM) and esti-
mates of active time (M1 and M3) are presented with
Bland-Altman plots in Figure 5. Mean difference between
methods are -8.6% ± 17.9% for M3 and -16.7% ± 26.3
forM1. Of the 62 paired values analyzed, 2 (3.2%)
exceeded the Bland-Altman limits of agreement (95% CI
= -43.7% to 26.5%) for M3, and 5 (8.1%) exceeded the
Bland-Altman limits of agreement (95% CI = -68.2% to
34.8%) for M1. For M3, 80.6% (N = 50) of sessions were
within the critical margins of agreement of ± 20%, with a
range for subjects of 75% to 100%. For M1, this propor-
tion was of 54.8% (N = 34) of sessions, with a range of
25% to 80% for subjects. Agreement levels with TM meas-
ures between M1 and M3 were significantly different for
combined sessions (P ≤ 0.001) and for each subject (P ≤
0.02), except for subject 1 (P ≤ 0.137).
Similar information is presented for activity categories in
Table 3. For M3, activities that had the highest proportion
of occurrences inside the critical margins of agreement of
20% were "Gait" (68%), "Stairs" (53%), "Prosthesis"
(52%) and "Walking, outdoor" (50%). For M1, they were
"Walking, outdoor" (67%), "Gait" (52%), "Prosthesis"
(52%) and "Weight bearing" (43.6%). Differences with
TM between M1 and M3 were significantly different (P ≤
0.028) for "Gait", "Reinforcement", "Weight bearing" and
"Stairs". For those mentioned above, the mean difference
between WBANs was lower for M3 in all the categories
except for "Stairs".
Discussion
The primary objective of this study was to explore the fea-
sibility and accuracy of a WBAN composed of three accel-
erometer modules to estimate active time in physical
therapy sessions. Our results show that WBAN estimates
of active time using inputs from three accelerometer mod-
ules are 1) different on average by -8.7% ± 2.0% from TM
measures of active time recorded throughout the length of
stay and 2) highly correlated (ICC = 0.93, P < 0.001).
Table 1: Clinical characteristics of participants at baseline evaluation and description of observations.
CLINICAL
S1 S2 S3 S4 S5 All
Age 72 73 78 79 85 77.4 ± 5.2
Diagnostic Immob. Syndrome Fractured femur Fractured hip Femoral amput. Fractured hip Stroke NA
SMAF (0 to -87) -35 -30 -38 -19 -40 -32.4 ± 8.4
Berg (0–56) 5 10 29 37 16 19.4 ± 13.3
TUG (sec) * 56.7 34.6 61.0 82.0 58.6 ± 19.4
5 m walk (sec) * 22.1 12.5 * 18.3 17.6 ± 4.8
OBSERVATIONS
N of Sessions 8 12 10 12 20 62
Total time (min) 58.4 ± 9.1 52.0 ± 3.8 57.2 ± 12.1 43.5 ± 6.2 59.5 ± 8.7 47.8 ± 12.2
Active time (min) 39.8 ± 11.3 33.2 ± 6.5 19.3 ± 9.3 33.0 ± 7.6 33.6 ± 9.9 27.0 ± 11.1
Density (%) 67.8 ± 13.3 63.9 ± 12.0 34.1 ± 14.4 75.5 ± 11.5 48.2 ± 8.7 56.8 ± 18.1
Values are presented as mean ± SD. All patients needed to use a walker in order to perform mobility tests, like TUG and the 5-m walk. An asterisk
(*) indicates that the patient was unable to accomplish a given test at baseline evaluation. Mean values for performance tests were calculated only on
available data. Density represents the proportion of total active time on total time of therapy for all sessions. Immob. Syndrome is for
Immobilization Syndrome. Femoral amput. is for Femoral Amputation.
Journal of NeuroEngineering and Rehabilitation 2008, 5:20 />Page 7 of 11
(page number not for citation purposes)
Using only one accelerometer module instead of three
leads to a lower correlation (ICC = 0.78, P < 0.001) and
larger difference with TM (-16.4% ± 10.4%).
Time and motion measurements in the 62 sessions
showed an average density (active time on total time) of
56.8% (52.6% for M3 estimates). Interestingly, our results
revealed that active time and density varied considerably
from one patient to another. Sessions density for patients
ranged from 34.1% to 75.5%. In addition, the standard
deviation was considerable for each patient (range: 8.7%–
14.4%), which supports the hypothesis that total time of
therapy is not an accurate portrait of active time, giving
the fact that active time is not constant neither at the inter-
nor intra-individual level.
A mean difference under 10% of TM measures gives
strong support for the use of accelerometer-based WBANs
to estimate active time in therapy. According to the litera-
ture, we chose a critical margin of agreement of 20% in
Measure and estimates of active time of therapy sessions throughout the length of stay for each subjectFigure 3
Measure and estimates of active time of therapy sessions throughout the length of stay for each subject.
AcƟve Ɵme (min)
0
10
20
30
40
50
60
12345678
Physical therapy sessions
S1
TM M3 M1
AcƟve Ɵme (sum)
318.1 min
281.7 min
259.3 min
0
10
20
30
1 2 3 4 5 6 7 8 9 1011121314151617181920
Physical therapy sessions
S5
AcƟve Ɵme (min)
TM M3 M1
AcƟve Ɵme (sum)
367.2 min
334.8 min
346.9 min
0
10
20
30
40
50
123456789101112
Physical therapy sessions
S4
AcƟve Ɵme (min)
TM M3 M1
AcƟve Ɵme (sum)
396.2 min
363.2 min
303.3 min
AcƟve Ɵme (min)
0
10
20
30
40
50
12345678910
Physical therapy sessions
S3
TM M3 M1
AcƟve Ɵme (sum)
193.3 min
175.6 min
182.2 min
AcƟve Ɵme (min)
0
10
20
30
40
50
123456789101112
Physical therapy sessions
S2
TM M3 M1
AcƟve Ɵme (sum)
398.6 min
375.3 min
284.9 min
Journal of NeuroEngineering and Rehabilitation 2008, 5:20 />Page 8 of 11
(page number not for citation purposes)
order to consider that WBANs estimates were acceptable
[16,31,32]. This margin is very conservative when consid-
ering the difficulties and logistics of obtaining data with
work sampling and TM. For example, an error of at least
20% was reported when comparing measures form TM or
work sampling [16]. Since TM is the most precise observa-
tion technique, a mean difference of less than 10% is
therefore excellent. Moreover, these results put M1 esti-
mates in another perspective. While less precise than M3,
differences between M1 and TM are still acceptable. There-
fore, if a WBAN system using three modules constitutes a
burden under certain conditions, one module may be a
viable alternative. Nevertheless, it should be noted that
the range of differences for M1 is higher and that a study
with more participants will be needed to validate its use
with a wider range of patients.
Accelerometers seem to give better estimation of active
time during ambulatory activities. In fact, gait, stairs and
walking outdoor all have an ICC above 0.95 (P < 0.001).
Concurrently, gait appears to have the lowest difference of
agreement between accelerometers and TM. Interestingly,
Horn et al. [15] found that spending more time in ambu-
latory activities lead to greater functional recovery and to
a shorter length of stay. This reinforces the use of acceler-
ometers as an interesting way to estimate physical activity.
That being said, our results indicate that accelerometers
are more precise on larger time frames to estimate active
time: estimates for the full length of stay are more precise
than for a single session, which estimates are in turn more
precise than estimates for individual activities. Similar
findings have been reported in the literature on physical
activity in the population where validity of accelerometers
increase with a higher number of observed days [20].
This study possesses several limitations. Having only five
participants does not allow us to generalize our results to
a larger population. In addition, we don't have inferential
Association between estimates of active time and measure of active time for observed sessionsFigure 4
Association between estimates of active time and measure of active time for observed sessions. Intraclass correlation coeffi-
cient between accelerometers' estimates and measurement of active time are presented in the lower right corner of each scat-
ter plot. 95% Confidence interval of ICC was 0.89 to 0.96 for M3 and 0.68 to 0.87 for M1.
50403020100
50
40
30
20
10
0
S5
S4
S3
S1
S2
50403020100
50
40
30
20
10
0
S5
S4
S3
S1
S2
TM Active time measure (min) TM Active time measure (min)
M1 Active time estimate (min)
M3 Active time estimate (min)
ICC: 0.93 (P≤0.001) ICC: 0.79 (P≤0.001)
Table 2: Intraclass correlation coefficients between estimates of
active time and measure of active time for activity categories.
Activities N M3 M1
Gait 81 0.95 (0.93–0.97) 0.82 (0.74–0.88)
Balance, standing 50 0.76 (0.61–0.86) 0.82 (0.70–0.89)
Reinforcement 40 0.81 (0.66–0.89) 0.61 (0.37–0.77)
Weight bearing 39 0.83 (0.69–0.91) 0.62 (0.39–0.78)
Stairs 32 0.95 (0.90–0.98) 0.68 (0.44–0.83)
Prosthesis 25 0.92 (0.83–0.96) 0.85 (0.69–0.93)
Antalgic therapy 9 0.32* (-0.39–0.79) 0.29* (-0.42–0.78)
Walking, outdoor 6 0.92 (0.54–0.99) 0.93 (0.60–0.99)
Others 13 0.68 (0.23–0.89) 0.55 (0.03–0.84)
M3 represents the WBAN using three sensors and M1 represents the
WBAN with only one sensor on the hip. Range of values presented in
parentheses is 95% Confidence interval of the correlation. All
correlations are statistically significant (P ≤ 0.05), except when
marked with an asterisk (*). Values are presented as mean ± SD.
Journal of NeuroEngineering and Rehabilitation 2008, 5:20 />Page 9 of 11
(page number not for citation purposes)
power and a sufficient sample size to evaluate the associ-
ations between active time and functional recovery. Fur-
thermore, by only measuring active time in
physiotherapy, observations cannot be expanded to other
therapeutic approaches, like occupational therapy. Never-
theless, to our knowledge, this is the first study that tried
to use accelerometers in the context of rehabilitation to
estimate active time.
The fact that active time has yet to be established as an
important determinant of functional recovery could be
regarded as a limitation for this study. It is obvious that
large-scale longitudinal designs are needed to study the
theoretical association between physical activity (active
time) and functional gains of patients. To this day, only
short observational studies have been used to describe the
activity profile of individuals in post acute rehabilitation
Bland-Altman plots of measure and estimate of active time for observed sessionsFigure 5
Bland-Altman plots of measure and estimate of active time for observed sessions. M3 and M1 are compared to time and
motion (TM) analysis. On the Y-axis, differences between methods are expressed as: [(M-TM)/((TM+M)/2)*100]. On the X-
axis, averaged active time is calculated as: [(M+TM)/2].
-
100
-
80
-
60
-
40
-
20
0
20
40
60
0 102030405060
26.5%
-43.7%
-8.6%
-100
-80
-60
-40
-20
0
20
40
60
0 102030405060
34.8%
-16.7%
-68.2%
Difference between methods (%)
M3 M1
Difference between methods (%)
Averaged Active Time (min) Averaged Active Time (min)
±20% Margin
±1.96 SD
Mean
Table 3: Agreement and difference between estimates and measure of active time.
Inside 20% Critical Margin of Agreement (N) Differences between methods (%)
Activities Total M3 M1 M3 M1 P-Value
Gait 81 55 (67.9%) 42 (51.9%) -1.4 ± 32.7 -17.6 ± 50.7 <0.001
Balance 50 23 (46.0%) 19 (38.0%) -18.9 ± 69.1 -18.9 ± 64.9 ≤0.993
Reinforcement 40 18 (45.0%) 8 (20.0%) -7.2 ± 83.1 -42.9 ± 101.6 <0.001
Weight bear. 39 19 (48.7%) 17 (43.6%) -7.9 ± 65.2 -30.0 ± 83.5 ≤0.003
Stairs 32 17 (53.1%) 9 (28.1%) 30.6 ± 59.3 18.8 ± 71.1 ≤0.028
Prosthesis 25 13 (52.0%) 13 (52.0%) 23.5 ± 57.7 22.2 ± 62.0 ≤0.633
Antalgic therapy 9 0 (0.0%) 0 (0.0%) 91.1 ± 104.2 94.1 ± 105.9 ≤0.052
Walking, out. 6 3 (50.0%) 4 (66.7%) 33.0 ± 83.8 26.15 ± 91.8 ≤0.511
Others 13 2 (15.4%) 1 (7.7%) 10.5 ± 94.5 16.5 ± 92.2 ≤0.101
On the left side of the table, data reports the number of activities that were inside the ± 20% Critical Margin of agreement in the Bland-Altman
Plots. On the right side, difference between measure (TM) and estimate (M) of active time are presented according to this formula: [(M-TM)/
((TM+M)/2)*100]. Paired Sample T Test were used to evaluate the differences of agreement of both M3 and M1 with TM. Values are presented as
mean ± SD.
Journal of NeuroEngineering and Rehabilitation 2008, 5:20 />Page 10 of 11
(page number not for citation purposes)
centers. This illustrates the difficulty of making observa-
tions during longer periods of time, which is time and
resources-consuming.
If the impact of physical mobilization on functional
recovery is to be investigated, active time has to be evalu-
ated during the entire day – not only during therapy ses-
sions. As a matter of fact, therapies represent only a small
fraction of total time in rehabilitation [4]. Evidences accu-
mulate that rehabilitation programs alone are insufficient
to provide enough active time for optimal functional
recovery. Recent studies have suggested that physical
activity done outside of supervised therapy may be more
important, in term of time of mobilization, than therapies
themselves [10,11,13]. Continuous observation of
patients for long periods of time to assess the contribution
of activities performed outside of traditional organized
therapy would be impractical. On the other hand, acceler-
ometers are small – about the size of a pager – and unob-
trusive. They also have low power consumption; each
module used in this study had autonomy of about 16
hours, which would make them very convenient to do
ambulatory monitoring throughout the entire day. They
could even be used as motivational devices by therapists,
who could set goals of physical mobilization for their
patients, outside of therapy.
Conclusion
This study is the first step in a process to validate and use
accelerometer-based WBAN to estimate active time in
rehabilitation. Errors of estimate of active time using
accelerometers are considerably inferior to most observa-
tion methods. While the use of three accelerometer mod-
ules appears to give more precise estimates of active time,
the use of only one accelerometer module on the hip
could still be an interesting alternative to observation
methods and should be further investigated. Longitudinal
studies in broader populations are now needed to verify
the association between active time and outcomes of reha-
bilitation.
Competing interests
The authors declare that they have no competing interests.
Authors' contributions
SC and PB developed study concept and design. SC, PB
and MH all participated in data analyses and interpreta-
tion. SC assumed manuscript preparation and the co-
authors participated in revisions.
Consent
Written informed consent was obtained from the patients
for publication of this case report and any accompanying
images. A copy of the written consent is available for
review by the Editor-in-Chief of this journal.
Acknowledgements
This study is supported by an operating grant from the Canadian Institutes
of Health Research (CIHR). Stephane Choquette is supported by M.Sc. fel-
lowship awards from the CIHR and Fonds de la recherche en santé du
Québec (FRSQ). Patrick Boissy is supported by a Junior 2 research scholar
award from the FRSQ. The authors would like to thank Karine Perreault
and Caroline Doyon for their contribution in evaluation and recruitment of
participants. Finally, the authors would like to thank the therapists who
accepted to participate in this project.
References
1. Heinemann AW: State of the science on postacute rehabilita-
tion: setting a research agenda and developing an evidence
base for practice and public policy: an introduction. JAssist
Technol 2008, 20(1):55-60.
2. Gladman J, Barer D, Langhorne P: Specialist rehabilitation after
stroke. Bmj 1996, 312:1623-1624.
3. Whyte J, Hart T: It's more than a black box; it's a Russian doll:
defining rehabilitation treatments. Am J Phys Med Rehabil 2003,
82:639-652.
4. Kwakkel G, van Peppen R, Wagenaar RC, Wood Dauphinee S, Rich-
ards C, Ashburn A, Miller K, Lincoln N, Partridge C, Wellwood I,
Langhorne P: Effects of augmented exercise therapy time after
stroke: a meta-analysis. Stroke 2004, 35:2529-2539.
5. Jette DU, Warren RL, Wirtalla C: The relation between therapy
intensity and outcomes of rehabilitation in skilled nursing
facilities. Arch Phys Med Rehabil 2005, 86:373-379.
6. Kwakkel G, Wagenaar RC, Koelman TW, Lankhorst GJ, Koetsier JC:
Effects of intensity of rehabilitation after stroke. A research
synthesis. Stroke 1997, 28:1550-1556.
7. Langhorne P: Intensity of rehabilitation: some answers and
more questions? J Neurol Neurosurg Psychiatry 2002, 72:430-431.
8. Kwakkel G: Impact of intensity of practice after stroke: issues
for consideration. Disabil Rehabil 2006, 28:823-830.
9. Wade D: Rehabilitation therapy after stroke.[comment]. Lan-
cet 1999, 354:176-177.
10. Bernhardt J, Chan J, Nicola I, Collier JM: Little therapy, little phys-
ical activity: rehabilitation within the first 14 days of organ-
ized stroke unit care. J Rehabil Med 2007, 39:43-48.
11. Bernhardt J, Dewey H, Thrift A, Donnan G: Inactive and alone:
physical activity within the first 14 days of acute stroke unit
care. Stroke 2004, 35:1005-1009.
12. Boissy P, Choquette S, Perreault K, Desrosiers J, the CHARGE team:
Une étude de temps et mouvements en réadaptation fonc-
tionnelle intensive : le point de vue des usagers. In L'avance-
ment des connaissances et des technologies au service de la personne âgée
Actes des échanges cliniques et scientifiques sur le vieillissement Edited by:
Bernier R, Roy P. Montréal: EDISEM éditeur;; 2007:64-81.
13. Gage WH, Zabjek KF, Sibley KM, Tang A, Brooks D, McIlroy WE:
Ambulatory monitoring of activity levels of individuals in the
sub-acute stage following stroke: a case series. J Neuroeng
Rehabil 2007, 4:41.
14. Gassaway J, Horn SD, DeJong G, Smout RJ, Clark C, James R: Apply-
ing the clinical practice improvement approach to stroke
rehabilitation: methods used and baseline results. Arch Phys
Med Rehabil 2005, 86:S16-S33.
15. Horn SD, DeJong G, Smout RJ, Gassaway J, James R, Conroy B:
Stroke rehabilitation patients, practice, and outcomes: is
earlier and more aggressive therapy better? Arch Phys Med
Rehabil 2005, 86:S101-S114.
16. Finkler SA, Knickman JR, Hendrickson G, Lipkin M Jr, Thompson WG:
A comparison of work-sampling and time-and-motion tech-
niques for studies in health services research. Health Serv Res
1993, 28:577-597.
17. De Wit L, Putman K, Dejaeger E, Baert I, Berman P, Bogaerts K,
Brinkmann N, Connell L, Feys H, Jenni W, et al.: Use of time by
stroke patients: a comparison of four European rehabilita-
tion centers. Stroke 2005, 36:1977-1983.
18. Jovanov E, Milenkovic A, Otto C, de Groen PC: A wireless body
area network of intelligent motion sensors for computer
assisted physical rehabilitation. J Neuroeng Rehabil 2005, 2(1):6.
19. MacKay-Lyons MJ, Makrides L: Cardiovascular stress during a
contemporary stroke rehabilitation program: is the intensity
Publish with BioMed Central and every
scientist can read your work free of charge
"BioMed Central will be the most significant development for
disseminating the results of biomedical research in our lifetime."
Sir Paul Nurse, Cancer Research UK
Your research papers will be:
available free of charge to the entire biomedical community
peer reviewed and published immediately upon acceptance
cited in PubMed and archived on PubMed Central
yours — you keep the copyright
Submit your manuscript here:
/>BioMedcentral
Journal of NeuroEngineering and Rehabilitation 2008, 5:20 />Page 11 of 11
(page number not for citation purposes)
adequate to induce a training effect? Archives of Physical Medicine
& Rehabilitation 2002, 83:1378-1383.
20. Welk G: Physical activity assessments for health-related research Cham-
paign, IL: Human Kinetics; 2002.
21. Tudor-Locke CE, Myers AM: Challenges and opportunities for
measuring physical activity in sedentary adults. 2001:91-100.
22. Boissy P, Briere S, Tousignant M, Rousseau E: The eSMAF: a soft-
ware for the assessment and follow-up of functional auton-
omy in geriatrics. BMC Geriatr 2007, 7:2.
23. Berg KO, Wood-Dauphinee SL, Williams JI, Maki B: Measuring bal-
ance in the elderly: validation of an instrument. Can J Public
Health 1992, 83(Suppl 2):S7-11.
24. Podsiadlo D, Richardson S: The timed "Up & Go": a test of basic
functional mobility for frail elderly persons.[see comment].
Journal of the American Geriatrics Society 1991, 39:142-148.
25. Collen FM, Wade DT, Bradshaw CM: Mobility after stroke: relia-
bility of measures of impairment and disability. Int Disabil Stud
1990, 12:6-9.
26. Dejong G, Horn SD, Gassaway JA, Slavin MD, Dijkers MP: Toward a
taxonomy of rehabilitation interventions: Using an inductive
approach to examine the "black box" of rehabilitation. Arch
Phys Med Rehabil 2004, 85:678-686.
27. Hébert R, Carrier R, Bilodeau A: Le Système de mesure de
l'autonomie fonctionnelle (SMAF). Revue de gériatrie 1988,
13:161-167.
28. Hamel M, Fontaine R, Boissy P: Wearable wireless body area sen-
sor networks for increased telepresence in geriatric telere-
habilitation applications. IEEE Engineering in Medicine and Biology
Magazine 2007, 27:29-37.
29. Bland JM, Altman DG: Statistical methods for assessing agree-
ment between two methods of clinical measurement. Lancet
1986, 1:307-310.
30. Bland JM, Altman DG: Comparing methods of measurement:
why plotting difference against standard method is mislead-
ing. Lancet 1995, 346:
1085-1087.
31. Ampt A, Westbrook J, Creswick N, Mallock N: A comparison of
self-reported and observational work sampling techniques
for measuring time in nursing tasks. J Health Serv Res Policy 2007,
12:18-24.
32. Oddone E, Guarisco S, Simel D: Comparison of housestaff's esti-
mates of their workday activities with results of a random
work-sampling study. Acad Med 1993, 68:859-861.