báo cáo hóa học: " Age and gender differences in seven tests of functional mobility" doc
Bạn đang xem bản rút gọn của tài liệu. Xem và tải ngay bản đầy đủ của tài liệu tại đây (622.73 KB, 9 trang )
BioMed Central
Page 1 of 9
(page number not for citation purposes)
Journal of NeuroEngineering and
Rehabilitation
Open Access
Research
Age and gender differences in seven tests of functional mobility
Annie A Butler
†
, Jasmine C Menant
†
, Anne C Tiedemann
†
and
Stephen R Lord*
†
Address: Prince of Wales Medical Research Institute, University of New South Wales, Barker St, Randwick, Sydney, NSW, 2031, Australia
Email: Annie A Butler - ; Jasmine C Menant - ;
Anne C Tiedemann - ; Stephen R Lord* -
* Corresponding author †Equal contributors
Abstract
Background: The objective of this study was to examine age and gender differences in seven tests
of functional mobility.
Methods: The study included 50 young participants aged 20 to 39 years, and 684 older participants
aged 75 to 98 years. Functional mobility measures included the coordinated stability test, the near
tandem balance test, the six metre walk test, the sit to stand test with five repetitions, the alternate
step test and the stair ascent and descent tests.
Results: Older participants performed significantly worse than the younger participants in all of
the functional mobility tests (p < 0.001), with the older women performing worse than the older
men in all of the tests (p < 0.05). Significant correlations were found within the older group among
all the functional mobility tests scores (r = 0.24–0.87, p < 0.001), and between functional mobility
performance and age (r = 0.14–0.35, p < 0.001). People with arthritis and stroke performed worse
than people without these conditions in these tests.
Conclusion: This study provides a normative database for performance of young and older
community-dwelling people in a battery of validated and reliable functional mobility tests. The
results confirm age-related differences in functional mobility between young and older adults.
Background
Mobility tests are commonly used to assess function and
frailty in older populations. Many of these tests are also
used with younger adults as measures of physical fitness
and general health; however there are little data available
on the age-related changes in the performance of these
tests.
Several studies have shown that there is a decline in the
ability to perform balance-related tests as age increases [1-
3] with a significant decline commencing at approxi-
mately 40 years of age [4,5]. Similarly, gait speed slows
with age [6,7] and the ageing process contributes to
declines in stair negotiation ability [8] and lower limb
strength [9]. These age-related changes in the performance
of functional mobility measures and physiological
domains are also associated with an increased risk of falls,
ongoing disability and admission into residential aged
care [10].
The development of age stratified normative data for these
commonly used functional mobility tests could assist in
Published: 30 July 2009
Journal of NeuroEngineering and Rehabilitation 2009, 6:31 doi:10.1186/1743-0003-6-31
Received: 30 April 2009
Accepted: 30 July 2009
This article is available from: />© 2009 Butler et al; licensee BioMed Central Ltd.
This is an Open Access article distributed under the terms of the Creative Commons Attribution License ( />),
which permits unrestricted use, distribution, and reproduction in any medium, provided the original work is properly cited.
Journal of NeuroEngineering and Rehabilitation 2009, 6:31 />Page 2 of 9
(page number not for citation purposes)
the targeting of interventions for people who exhibit a
decline in their functional status at an early stage, prior to
the occurrence of falls and the onset of disability. There-
fore, the aim of this study was to provide reference data
and examine age and gender differences in seven func-
tional mobility tests. The second aim was to identify how
much common age related diseases, i.e. arthritis and
stroke, further impaired performance in these tests.
Methods
Participants
Fifty young participants (23 men) aged 20–39 years
(mean: 28.4 ± 4.7 years) and 684 older people (238 men)
aged 75 years and over (mean: 80.1 ± 4.4 years) per-
formed seven tests of functional mobility. The young par-
ticipants were a convenience sample of healthy staff
members of the Prince of Wales Medical Research Insti-
tute. The older participants were randomly selected from
the membership database of a health insurance company
as part of a falls prevention randomised controlled trial
conducted between 1999 and 2002 [11]. Exclusion crite-
ria included minimal English, blindness, Parkinson's dis-
ease or a Short Portable Mental Status Questionnaire score
<7 [12]. All participants were living independently. The
mobility tests were carried out at an acute hospital and
transport was provided for people with mobility limita-
tions. Table 1 shows the prevalence of medical conditions,
medication use and participation in physical activity of
the older participants.
Thirty older participants undertook the tests a second time
two weeks after their initial assessment to determine the
test-retest reliability of the tests. The University of New
South Wales Ethics Committee approved the study and
informed consent was obtained from participants prior to
their participation.
Functional mobility tests
The seven tests were administered in a single session.
Timed tests were measured with a stopwatch with an accu-
racy of 0.01s.
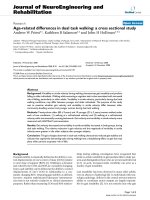
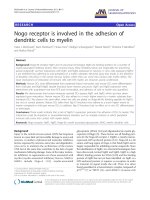
Coordinated stability
The coordinated stability task measured participants' abil-
ity to adjust balance in a steady and coordinated way
while placing them near or at the limits of their base of
support (Figure 1A) [13]. This test used the Lord swayme-
ter – a simple device comprising a 40 cm rod which was
attached to participants at waist level by a firm belt [14].
The participant was asked to adjust balance by bending or
rotating the body without moving the feet (i.e. move the
centre of mass), so that a pen mounted vertically at the
end of the rod followed and remained within a convo-
luted track which was marked on a piece of paper attached
to the top of an adjustable height table. To complete the
test without errors, participants had to remain within the
track, which was 1.5 cm wide, and be capable of adjusting
the position of the pen 29 cm laterally and 18 cm in the
anterior-posterior plane. A total error score was calculated
by summing the number of occasions that the pen on the
swaymeter failed to stay within the path. Where partici-
pants failed to negotiate an outside corner (because they
could not adjust their centre of mass sufficiently), five
additional error points were accrued. Participants com-
pleted a practice trial before completing the test.
Near tandem balance
In this test, participants were asked to stand in a near tan-
dem position with their bare feet separated laterally by 2.5
cm with the heel of the front foot 2.5 cm anterior to the
great toe of the back foot (Figure 1B). Participants chose
which foot to place in the forward position for the test and
they were required to stand in this position for 30s with
eyes closed. The time that participants were able to stand
in this position before a step was taken or the eyes were
opened was the score. If a score of 5s or less was obtained,
a second trial was allowed and the better result was used
as the test score.
Walking speed – six metre walk
Participants were asked to walk along a straight, flat, well-
lit corridor at their "normal walking speed". Two markers
were used to indicate the start and end of the 6 m path and
a 2 m approach was allowed before reaching the start
marker so that participants were walking at their normal
pace within the timed path. The participants were also
instructed to continue walking past the end of the 6 m
path for a further 2 m, to ensure that the walking pace was
kept consistent throughout the task. Walking speed (m/s)
was used as the test measure.
Sit to stand
In this test, participants were asked to rise from a standard
height (43 cm) chair without armrests, five times as fast as
possible with their arms folded. Participants undertook
the test barefoot. The time from the initial seated position
to the final seated position after completing five stands
was the test measure.
Alternate step
The alternate step test is a modified version of the Berg
stool stepping task [15]. It involves weight shifting and
provides a measure of lateral stability. This test involved
alternatively placing the whole left and right foot (shoes
removed) as fast as possible onto a step that was 19 cm
high and 40 cm deep. The time taken to complete eight
steps, alternating between left and right foot comprised
the test measure.
Journal of NeuroEngineering and Rehabilitation 2009, 6:31 />Page 3 of 9
(page number not for citation purposes)
Stair ascent and descent
In this study the test stairs were indoors, had a handrail,
were covered with linoleum and well lit. The participants
started the stair ascent test at the bottom of eight steps (15
cm high, 27.5 cm deep). Participants were instructed to
complete the task as fast as possible and could use the
handrail if preferred and a walking aid if they normally
used one. Timing commenced for the stair ascent test
when the subject raised their foot off the ground to climb
the first step and stopped when both feet were placed on
the eighth step (which was a landing). After a brief rest,
participants were asked to descend the stairs. Timing was
started when they raised their foot off the ground for the
first step and stopped when they completed the last step.
Times taken to complete the ascent and descent tests were
recorded and converted to the number of steps taken per
second.
Statistical analysis
Test-retest reliability for the test measures was assessed
with intra-class correlation (ICC
3,1
) tests. As not all test
scores were normally distributed (particularly in the
young participants), non-parametric statistics were used
in all between-group comparisons. The relationships
among the mobility tests were examined with Spearman
correlations. Mann Whitney-U tests were used to assess
Table 1: Prevalence of major medical conditions, medication use and participation in physical activity in the older sample
Measure score range N or (Mean) % or (SD)
Health Status
Arthritis 283 41.8
Diabetes 46 6.7
Incontinence 103 15.1
Depression 70 10.2
Stroke 48 7.0
Dizziness 30 4.4
SF-12 Physical Component Summary Score (48.24) (8.95)
SF-12 Mental Component Summary Score (55.57) (6.71)
Medications
Psychoactive medications 105 15.4
Cardiovascular medications 477 69.7
Musculoskeletal medications 161 23.5
≥ 4 medications 377 55.1
Planned walk at least once/week 378 55.3
Use of walking aid 115 16.8
≥ 1 fall in the past year 294 43.0
Moderate or marked fear of falling 189 27.9
Journal of NeuroEngineering and Rehabilitation 2009, 6:31 />Page 4 of 9
(page number not for citation purposes)
differences in mobility task performance between young
and older participants, between older participants with
and without stroke and, with and without arthritis, as well
as to assess gender differences within the young and older
groups.
Results
Test-retest reliability
According to the criteria of Shrout and Fleiss [16], the
ICC
3,1
values determined from the older sample indicated
excellent reliability for the sit to stand test (0.89, 95% CI
= 0.79, 0.95), the coordinated stability test (0.83, 95% CI
= 0.70, 0.91), the alternate step test (0.78, 95% CI = 0.59,
0.89), the stair ascent test (0.84, 95% CI = 0.69, 0.92) and
the stair descent test (0.86, 95% CI = 0.74, 0.93). The six
metre walk test and the near tandem balance test dis-
played good and fair reliability (0.74, 95% CI = 0.52, 0.87
and 0.54, 95% CI = 0.23, 0.75 respectively).
Age and gender comparisons
Table 2 shows the median scores and interquartile ranges
(IQR) for the young men and women and the older men
and women when categorised into four age groups (75–
79, 80–84, 85–89, 90+ years). The mean ages of the older
men and women were very similar (80.0 ± 4.6 vs. 80.2 ±
4.4 years, p = 0.67). The older participants (as a group)
performed significantly worse in all seven tests than their
younger counterparts (p < 0.001). There were no differ-
ences in the test performances of young women and
young men, however, older women performed worse
than older men in all of the tests (p < 0.05).
Within the older group, performances in all of the mobil-
ity tests were significantly correlated (r = 0.24–0.87, p <
0.001), and all were weakly but significantly associated
with age (r = 0.14–0.35, p < 0.001). In the young group
fewer tests were significantly associated with each other
(Table 3).
Two tests showed marked age differences. In the test of
near tandem balance, all young participants were able to
attempt the test and 94% completed the 30 second test
period. In contrast, 11% of older participants were unable
to attempt the test, and only 29% successfully completed
it. In the test of coordinated stability, 84% of the young
group recorded no errors, compared with just 15% of the
older group.
During the stair ascent and descent tests, 45% and 52%
(respectively) of older people held the handrail for assist-
ance whereas only one young participant used the hand-
rail in the test of stair descent.
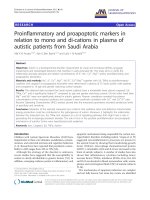
Figure 2 shows the percentage of young and older partici-
pants who could undertake each test within a time period
or error level that indicated "reasonable" performance.
This complementary reporting of the data also shows the
large differences in test performances between the young
and older groups.
Medical conditions within the older group
Table 4 shows the median scores and interquartile ranges
(IQR) for the older participants with and without stroke,
as well as with and without arthritis. The older partici-
pants who had suffered from a stroke in the past had more
than double the number of errors in the coordinated sta-
bility test than those who had not had a stroke. They also
walked significantly slower and took longer time to com-
plete the alternate step test and the stair ascent. The partic-
ipants with arthritis performed significantly worse than
those without arthritis in all the functional ability tests
except for the near tandem balance test.
Tests of (A) Coordinated stability and (B) Near tandem bal-anceFigure 1
Tests of (A) Coordinated stability and (B) Near tan-
dem balance.
START
2.5cm
2.5cm
B
A
Journal of NeuroEngineering and Rehabilitation 2009, 6:31 />Page 5 of 9
(page number not for citation purposes)
Table 2: Median (IQR) functional mobility test scores for men and women in each age group
Test (measure) Age group
(years)
Men
Median (IQR)
Women
Median (IQR)
Total
Median (IQR)
Coordinated stability (errors) 20–39 0.0 (0.0–0.0) 0.0 (0.0–0.0) 0.0 (0.0–0.0)
75–79 2.0 (0.0–7.0) 5.0 (2.0–10.0) 4.0 (1.0–9.5)
80–84 4.0 (0.5–8.0) 10.0 (4.0–17.0) 8.0 (3.0–15.5)
85–89 8.0 (4.0–14.0) 12.5 (3.75–19.0) 11.0 (4.0–18.0)
90+ 15.0 (6.0–23.0) 16.0 (6.5–20.5) 15.5 (6.2–20.7)
Total (75+) 4.0 (0.0–10.0) 7.0 (3.0–15.0) 6.0 (2.0–13.0)
Near tandem balance (s) 20–39 30.0 (30.0–30.0) 30.0 (30.0–30.0) 30.0 (30.0–30.0)
75–79 15.8 (4.2–30) 9.2 (4.7–30) 10.8 (4.3–30.0)
80–84 17.4 (4.8–30.0) 7.2 (2.8–29.2) 8.3 (3.0–30.0)
85–89 5.0 (0.0–23.3) 3.9 (1.2–8.4) 3.9 (0.5–11.6)
90+ 0.0 (0.0–3.3) 0.0 (0.0–2.4) 0.0 (0.0–2.5)
Total (75+) 14.7 (3.4–30.0) 7.2 (3.0–29.6) 8.2 (3.1–30.0)
Walking speed (m/s) 20–39 1.5 (1.2–1.6) 1.4 (1.3–1.6) 1.4 (1.3–1.6)
75–79 1.1 (0.9–1.3) 1.1 (0.9–1.2) 1.1 (0.9–1.2)
80–84 1.1 (0.9–1.2) 1.0 (0.9–1.4) 1.0 (0.9–1.2)
85–89 1.1 (0.8–1.2) 0.8 (0.7–1.0) 0.9 (0.7–1.1)
90+ 0.9 (0.6–0.9) 0.8 (0.6–0.9) 0.8 (0.6–0.9)
Total (75+) 1.1 (0.9–1.2) 1.0 (0.9–1.1) 1.0 (0.9–1.2)
Sit to stand (s) 20–39 7.9 (6.9–9.4) 8.0 (6.4–9.0) 7.9 (6.6–9.0)
75–79 10.3 (9.0–12.9) 11.5 (9.3–13.6) 11.2 (9.1–13.4)
80–84 11.5 (9.4–14.5) 12.0 (10.0–15.0) 11.9 (9.7–14.7)
85–89 11.7 (9.8–14.7) 12.1 (10.2–15.0) 12.0 (10.1–14.9)
90+ 14.5 (9.7–30.0) 14.6 (10.7–15.2) 14.5 (10.5–20.6)
Total (75+) 10.9 (9.2–14.1) 11.9 (9.7–14.3) 11.6 (9.5–14.2)
Alternate step (s) 20–39 6.9 (6.2–7.7) 6.8 (6.3–7.3) 6.8 (6.3–7.3)
75–79 8.6 (7.5–10.6) 9.5 (7.8–10.9) 9.2 (7.7–10.9)
80–84 9.3 (7.7–12.0) 10.7 (9.0–12.9) 10.2 (8.6–12.5)
Journal of NeuroEngineering and Rehabilitation 2009, 6:31 />Page 6 of 9
(page number not for citation purposes)
85–89 10.0 (8.5–13.2) 11.2 (9.1–16.4) 10.7 (8.8–15.4)
90+ 13.2 (9.5–18.8) 14.5 (12.2–20.8) 13.9 (11.7–20.2)
Total (75+) 9.1 (7.8–11.8) 10.1 (8.3–12.3) 9.7 (8.0–12.2)
Stair ascent (steps/s) 20–39 2.0 (1.9–3.2) 2.6 (2.3–2.8) 2.5 (2.0–2.9)
75–79 1.9 (1.6–2.2) 1.6 (1.4–2.0) 1.7 (1.4–2.0)
80–84 1.8 (1.5–2.2) 1.4 (1.2–1.7) 1.5 (1.2–1.8)
85–89 1.6 (1.4–1.8) 1.2 (0.8–1.5) 1.4 (1.0–1.6)
90+ 1.2 (0.9–1.5) 1.1 (0.5–1.6) 1.2 (0.9–1.6)
Total (75+) 1.8 (1.5–2.1) 1.5 (1.2–1.8) 1.6 (1.3–1.9)
Stair descent (steps/s) 20–39 2.5 (2.2–3.9) 3.0 (2.7–3.4) 2.9 (2.3–3.4)
75–79 2.0 (1.7–2.4) 1.6 (1.3–2.0) 1.8 (1.4–2.1)
80–84 1.8 (1.4–2.2) 1.3 (0.9–1.7) 1.5 (1.1–1.9)
85–89 1.7 (1.3–2.0) 1.2 (0.6–1.4) 1.3 (0.8–1.7)
90+ 1.0 (0.9–1.4) 0.9 (0.4–1.3) 1.0 (0.7–1.3)
Total (75+) 1.9 (1.4–2.3) 1.4 (1.1–1.8) 1.6 (1.2–2.0)
Table 2: Median (IQR) functional mobility test scores for men and women in each age group (Continued)
Table 3: Correlation coefficients (ρ) among the functional mobility tests.
Coordinated
stability
Near tandem
balance
Walking speed Sit to stand Alternate step Stair ascent Stair descent Age
Coordinated
stability
-0.38*** -0.45*** 0.32*** 0.46*** -0.50*** -0.50*** 0.30***
Near tandem
balance
0.11 0.38*** -0.24*** -0.28*** 0.31*** 0.35*** -0.26***
Walking speed 0.10 -0.01 -0.49*** -0.57*** 0.68*** 0.65*** -0.30***
Sit to stand 0.17 0.10 0.01 0.63*** -0.54*** -0.51*** 0.14***
Alternate step 0.15 -0.09 -0.20 0.49*** -0.64*** -0.64*** 0.27***
Stair ascent -0.10 0.21 0.39* -0.15 -0.40** 0.87*** -0.33***
Stair descent 0.09 0.22 0.45** -0.14 -0.35* 0.84*** -0.35***
Age -0.09 -0.26* 0.18 -0.17 -0.25* 0.09 0.03
The upper half represents the correlation coefficients for the older group. The bold lower half of the table represents correlation coefficients for
the young group (* p < 0.05, ** p < 0.005, *** p < 0.001).
Journal of NeuroEngineering and Rehabilitation 2009, 6:31 />Page 7 of 9
(page number not for citation purposes)
Discussion
When investigating age-related effects on functional
mobility, a critical controversy arises relating to funda-
mental differences in the definition of the term "normal
ageing". On the one hand, normal older people can be
defined as only those free from all medical conditions,
whilst on the other end, all older people, with no exclu-
sion criteria and hence representative of the general pop-
ulation, can be considered normal. While both
perspectives on selection criteria are valid, they lead to dif-
fering results, depending on whether pathological condi-
tions are considered as a normal concomitant of the
ageing process. The older sample on whom the data anal-
ysis was conducted was representative of the community-
living older population and thus presented with a range of
pathologies.
The study findings revealed significant age-related differ-
ences in all seven functional mobility tests examined.
These findings confirm those of previous studies and indi-
cate that when compared with young people, older people
exhibit poorer leaning balance [1,2], more difficulty
maintaining balance while standing with a reduced base
of support [17], slower comfortable walking speed
[6,7,10], reduced ability to quickly rise from a chair [10],
and slower stair ascent and descent speed [18]. These age-
related differences in functional mobility have been
attributed to impaired sensorimotor function [19,20], in
particular reduced lower extremity strength and power
[19-22], but also to balance deficits [19,20], increased fear
of falling [20,23] and reduced aerobic capacity [24].
Significant correlations among all the functional mobility
tests in the older group indicate that older adults who per-
formed poorly in one test were likely to perform poorly in
all the other tests. This suggests that to a large extent these
tests assess a common underlying "mobility" construct
[25], rather than distinct functional abilities.
The finding that the older women performed worse than
the older men in all the functional mobility tasks is in
agreement with previous studies that have investigated
Percentage of participants who performed each test adequatelyFigure 2
Percentage of participants who performed each test adequately. Reasonable performance levels for each test defined
as: coordinated stability = 0 errors; near tandem balance = full 30s stand; walking speed ≥ 1 m/s; sit to stand ≤ 10s; alternate
step ≤8s; stair ascent and descent ≥ 2 steps/s.
Alternate
step
Stair
ascent
Stair
descent
Sit to
stand
Walking
speed
Near
tandem
balance
Co-
ordinated
stability
60
0
100
40
20
80
%
Young men
Young women
Older men
Older women
Journal of NeuroEngineering and Rehabilitation 2009, 6:31 />Page 8 of 9
(page number not for citation purposes)
lower-extremity functional performance [10], stair negoti-
ation [20], rapid turns and stops [26], and is attributed to
older women being less able to generate rapid lower limb
muscle torques [20,26].
The tests differed considerably with regard to differences
in performances between the young and older groups. The
six metre walk test showed the smallest age difference and
this is likely due to the test instruction requiring walking
at normal rather than maximal pace, and the fact that this
test is familiar and of low threat with respect to falling. In
contrast, the stair descent test, which required participants
to undertake the task as quickly as possible, is likely to
have induced the greatest concern about falling and this
was evident in different strategies adopted by the young
and older participants. Only one young participant held
the handrail while negotiating the stairs and many "ran"
rather than walked down the stairs, while approximately
half of the older people held the handrail and none
adopted a running strategy. As 28% of the older sample
reported moderate or marked fear of falling, this factor, in
addition to sensorimotor function impairments, may
have contributed to the large difference in stair descent
speed between the young and older groups.
The greatest age-related differences in test performance
were found in the coordinated stability and near tandem
balance tests. These tests were completed without error by
most young participants, but proved to be much more dif-
ficult for the older participants. This suggests that the abil-
ity to control and adjust standing balance may undergo
greater age-related changes than transfer and walking
tasks. However, it is also possible that the larger age effects
may be partly due to familiarisation factors in that the
coordinated stability and near tandem balance tests are
less similar to everyday tasks than tests such as the sit to
stand and stair negotiation which are integral elements of
activities of daily living.
Normative data regarding functional mobility perform-
ance in older people suffering from two common medical
conditions in our sample, stroke and arthritis, were also
provided. As suggested in previous studies, sensory and
motor control impairments likely contributed to reduced
functional abilities in stroke survivors [27] and arthritis
sufferers [28]. Surprisingly though, the difference in func-
tional tests performance was not as large between stroke
sufferers and non-stroke sufferers as it was between arthri-
tis sufferers and non-arthritis sufferers. We did not assess
the extent of damage and subsequent recovery from the
stroke; it is likely that some of the older participants had
functionally recovered from their stroke event which
would explain the great variance in the scores. In contrast,
the presence of arthritis would have been affecting the
participants' mobility and balance on a daily basis.
Conclusion
In conclusion, this study provides normative data for per-
formance of young and older community-dwelling peo-
ple in a battery of validated and reliable functional
mobility tests. Significant age-related differences in per-
formance were found in tests of coordinated stability,
near tandem balance, six metre walk, alternate step, five-
repetition sit to stand, and stair negotiation, with older
women performing worse than older men in all tests.
Competing interests
The authors declare that they have no competing interests.
Authors' contributions
SL and AT conceived the study, participated in its design
and coordination and tested the old participants. AB and
Table 4: Median (IQR) functional mobility test scores for participants with and without stroke and with and without arthritis (*p < 0.05,
**p < 0.005, ***p < 0.001)
Test (measure) No stroke
(n = 636)
Stroke
(n = 48)
No arthritis
(n = 401)
Arthritis
(n = 283)
Coordinated stability (errors) 5.5 (1.1–12.5) 11.5 (3.9–20.5)** 5.0 (1.0–12.1) 7.4 (2.9–14.6)***
Near tandem balance (s) 8.5 (3.1–30.0) 7.0 (2.0–30.0) 7.9 (3.1–30.0) 8.6 (3.0–30.0)
Walking speed (m/s) 1.1 (0.9–1.2) 1.0 (0.9–1.1)* 1.1 (1.0–1.3) 1.0 (0.9–1.2)***
Sit to stand (s) 11.5 (9.5–14.2) 12.1 (10.6–14.7) 11.0 (9.2–13.3) 12.5 (10.3–15.9)***
Alternate step (s) 9.7 (8.0–12.2) 10.6 (9.6–13.0)* 9.4 (7.8–11.4) 10.7 (8.4–13.4)***
Stair ascent (steps/s) 1.7 (1.3–2.0) 1.5 (1.3–1.7)* 1.8 (1.4–2.0) 1.5 (1.2–1.8)***
Stair descent (steps/s) 1.6 (1.2–2.0) 1.5 (1.1–1.8) 1.8 (1.4–2.1) 1.4 (1.0–1.9)***
Publish with BioMed Central and every
scientist can read your work free of charge
"BioMed Central will be the most significant development for
disseminating the results of biomedical research in our lifetime."
Sir Paul Nurse, Cancer Research UK
Your research papers will be:
available free of charge to the entire biomedical community
peer reviewed and published immediately upon acceptance
cited in PubMed and archived on PubMed Central
yours — you keep the copyright
Submit your manuscript here:
/>BioMedcentral
Journal of NeuroEngineering and Rehabilitation 2009, 6:31 />Page 9 of 9
(page number not for citation purposes)
JM carried out the testing of the young participants. AB
performed the statistical analysis. All authors helped to
draft the manuscript, read and approved the final manu-
script.
Acknowledgements
The National Health and Medical Research Council (Population Health
Capacity Building Grant in Injury Prevention, Trauma and Rehabilitation and
Health Research Partnership Grant: Prevention of Older People's Injuries
(POPI)), MBF Australia, and the Vincent Fairfax Family Foundation sup-
ported this project.
References
1. Hageman PA, Leibowitz JM, Blanke D: Age and gender effects on
postural control measures. Arch Phys Med Rehabil 1995,
76:961-965.
2. Isles RC, Choy NL, Steer M, Nitz JC: Normal Values of Balance
Tests in Women Aged 20–80. J Am Geriatr Soc 2004,
52:1367-1372.
3. Samson M, Meeuwsen I, Crowe A, Dessens J, Duursma S, Verhaar H:
Relationships between physical performance measures, age,
height and body weight in healthy adults. Age Ageing 2000,
29:235-242.
4. Choy NL, Brauer S, Nitz J: Changes in postural stability in
women aged 20 to 80 years. J Gerontol A Biol Sci Med Sci 2003,
58:525-530.
5. Izquierdo M, Aguado X, Gonzalez R, Lopez JL, Hakkinen K: Maximal
and explosive force production capacity and balance per-
formance in men of different ages. Eur J Appl Physiol Occup Physiol
1999, 79:260-267.
6. Bohannon RW: Comfortable and maximum walking speed of
adults aged 20–79 years: reference values and determinants.
Age Ageing 1997, 26:15-19.
7. Himann JE, Cunningham DA, Rechnitzer PA, Paterson DH: Age-
related changes in speed of walking. Med Sci Sports Exerc 1988,
20:161-166.
8. Hamel KA, Cavanagh PR: Stair performance in people aged 75
and older. J Am Geriatr Soc 2004, 52:563-567.
9. Aoyagi Y, Shephard RJ: Aging and muscle function. Sports Med
1992, 14:376-396.
10. Guralnik JM, Simonsick EM, Ferrucci L, Glynn RJ, Berkman LF, Blazer
DG, Scherr PA, Wallace RB: A short physical performance bat-
tery assessing lower extremity function: association with
self-reported disability and prediction of mortality and nurs-
ing home admission. J Gerontol 1994, 49:M85-94.
11. Lord SR, Tiedemann A, Chapman K, Munro B, Murray SM, Sher-
rington C: The effect of an individualized fall prevention pro-
gram on fall risk and falls in older people: a randomized,
controlled trial. J Am Geriatr Soc 2005, 53:1296-1304.
12. Pfeiffer E: A short portable mental status questionnaire for
the assessment of organic brain deficit in elderly patients.
J
Am Geriatr Soc 1975, 23:433-441.
13. Campbell AJ, Borrie MJ, Spears GF: Risk factors for falls in a com-
munity-based prospective study of people 70 years and
older. J Gerontol 1989, 44:M112-117.
14. Lord S, Ward J: Age-associated differences in sensori-motor
function and balance in community dwelling women. Age Age-
ing 1994, 23:452-460.
15. Berg KO, Wood-Dauphinee SL, Williams JI, Maki B: Measuring bal-
ance in the elderly: validation of an instrument. Can J Public
Health 1992, 83(Suppl 2):S7-11.
16. Shrout PE, Fleiss JL: Intraclass correlations: uses in assessing
rater reliability. Psychol Bull 1979, 86:420-428.
17. Amiridis IG, Hatzitaki V, Arabatzi F: Age-induced modifications of
static postural control in humans. Neurosci Lett 2003,
350:137-140.
18. Gill J, Allum JH, Carpenter MG, Held-Ziolkowska M, Adkin AL, Hon-
egger F, Pierchala K: Trunk sway measures of postural stability
during clinical balance tests: effects of age. J Gerontol A Biol Sci
Med Sci 2001, 56:M438-447.
19. Tiedemann A, Sherrington C, Lord SR: Physiological and psycho-
logical predictors of walking speed in older community-
dwelling people. Gerontology 2005, 51:390-395.
20. Tiedemann AC, Sherrington C, Lord SR: Physical and psychologi-
cal factors associated with stair negotiation performance in
older people. J Gerontol A Biol Sci Med Sci 2007, 62:1259-1265.
21. Kerrigan DC, Todd MK, Della Croce U, Lipsitz LA, Collins JJ: Biome-
chanical Gait Alterations Independent of Speed in the
Healthy Elderly: Evidence for Specific Limiting Impairments.
Arch Phys Med Rehabil 1998, 79:317-322.
22. Puthoff ML, Nielsen DH: Relationships among impairments in
lower-extremity strength and power, functional limitations,
and disability in older adults. Phys Ther
2007, 87:1334-1347.
23. Myers AM, Powell LE, Maki BE, Holliday PJ, Brawley LR, Sherk W:
Psychological indicators of balance confidence: relationship
to actual and perceived abilities. J Gerontol A Biol Sci Med Sci
1996, 51:M37-43.
24. Cunningham DA, Rechnitzer PA, Pearce ME, Donner AP: Determi-
nants of self-selected walking pace across ages 19 to 66. J Ger-
ontol 1982, 37:560-564.
25. Tiedemann A, Shimada H, Sherrington C, Murray SM, Lord SR: The
comparative ability of eight functional mobility tests for pre-
dicting falls in community-dwelling older people. Age Ageing
2008, 37:430-435.
26. Cao C, Schultz AB, Ashton-Miller JA, Alexander NB: Sudden turns
and stops while walking: kinematic sources of age and gen-
der differences. Gait Posture 1998, 7:45-52.
27. Corriveau H, Hebert R, Raiche M, Prince F: Evaluation of Postural
Stability in the Elderly With Stroke. Arch Phys Med Rehabil 2004,
85:1095-1101.
28. Sturnieks DL, Tiedemann A, Chapman K, Munro B, Murray SM, Lord
SR: Physiological risk factors for falls in older people with
lower limb arthritis. J Rheumatol 2004, 31:2272-2279.