báo cáo hóa học: "Bayesian aggregation versus majority vote in the characterization of non-specific arm pain based on quantitative needle electromyography" pot
Bạn đang xem bản rút gọn của tài liệu. Xem và tải ngay bản đầy đủ của tài liệu tại đây (542.36 KB, 12 trang )
RESEARC H Open Access
Bayesian aggregation versus majority vote in the
characterization of non-specific arm pain based
on quantitative needle electromyography
Andrew Hamilton-Wright
1,2,3*
, Linda McLean
1*
, Daniel W Stashuk
4
, Kristina M Calder
1
Abstract
Background: Methods for the calculation and application of quantitative electromyographic (EMG) statistics for the
characterization of EMG data detected from forearm muscles of individuals with and without pain associated with
repetitive strain injury are presented.
Methods: A classification procedure using a multi-stage application of Bayesian inference is presented that
characterizes a set of motor unit potentials acquired using needle electromyography. The utility of this technique
in characterizing EMG data obtained from both normal individuals and those presenting with symptoms of “non-
specific arm pain” is explored and validated. The efficacy of the Bayesian technique is compared with simple voting
methods.
Results: The aggregate Bayesian classifier presented is found to perform with accuracy equivalent to that of
majority voting on the test data, with an overall accuracy greater than 0.85. Theoretical foundations of the
technique are discussed, and are related to the observations found.
Conclusions: Aggregation of motor unit potential conditional probability dis tributions estimated using quantitative
electromyographic analysis, may be successfully used to perform electrodiagnostic characterization of “non-specific
arm pain.” It is expected that these techniques will also be able to be applied to other types of electrodiagnostic
data.
Background
It is generally accepted that non-specific arm pain
(NSAP) is caused by physical exposures in the work-
place including repetitiveness, awkward postures, and
high forces, and this conditio n is commonly reported in
the workplace [1]. In a 2-year prospective population
based cohort study with retrospective a ssessment of
exposures at wor k, Macfarlane et al [2] found mechani-
cal factors moderately increased the risk of NSAP, with
repetitive motion being the most important factor for
the onset of pain. However, a study by Walker-Bone et
al [3] found that individuals with NSAP were no more
likel y to develop a know n pathology, such as hand- wrist
tendonitis from repetitive keyboard work, than indivi-
duals without underlying forearm pain, suggesting that
the diffuse pain felt in NSAP is not simply a precursor
to a more clearly defined musculoskeletal condition.
Despite known risk factors, little is known about the
patholo gy of NSAP, where the diffuse pain noted in the
forearm of affected individuals lacks any clear diagnostic
criteria. In fact, the Harrington c riteria [4] define non-
specific forearm pain as a pain in the forearm that fails
to meet the diagnostic criteria for other specific diag-
noses and/or diseases.
It is not clear whether NSAP is a musculoskeletal or
neuromuscular condition. Some authors believe that
chronic pain conditions like NSAP and trapezius myal-
gia are associated with damage within the muscle [5-10],
whereas others believe it is caused by neuropathic
changes [11-14]. In some muscles affected by chronic
overuse conditions, an increased proportion of “ragged
red” fibers have been identified on biopsy as compared
to healthy control subjects, and researchers have there-
fore suggested that the origin of this c ondition is
* Correspondence: ;
1
School of Rehabilitation Therapy, Queen’s University, Kingston, Ontario,
Canada
Hamilton-Wright et al. Journal of NeuroEngineering and Rehabilitation 2010, 7:8
/>JNER
JOURNAL OF NEUROENGINEERING
AND REHABILITATION
© 2010 Hamilton-Wright et al; licensee BioMed Central Ltd. This is an Open Access article distributed under the te rms of the Creative
Commons Attribution License ( which permits unrestricted use, distribution, and
reproduction in any medium, provided the original work is properly cited.
associated with mitochondrial damage to the Type I
fibers [15-17], however these results have not been con-
clusive, with similar dama ge noted in individuals who
perform repetitive tasks but who are pain free. Other
researchers have found indications that chronic musc le
pain in the wrist flexor group (also referred to as NSAP)
may be neuropathic in nature [11-14]. In particular,
Greening et al speculate that NSAP affecting the wrist
flexor muscles is neuropathic in origin, based on
observed changes in median nerve function [11,12,18].
Quantitative electromyography
Quantitative electromyographic (EMG) data can be
used to obtain reproducible and robust characteriza-
tions of the signature signal structures obtained from
individual moto r units (MUs) [19,20]. Through signal
decomposition techniques applied to a needle-detected
EMG signal, it i s possible to observe the repeated
occurrence of motor-unit potentials (MUPs) from the
pool of motor units active during a given muscle con-
traction. The series of such potentials is referred to as
a motor-unit potential train, or MUPT; these data
may be used to characterize both the average shape of
a MUP as well as to estimate the firing pattern of its
generating MU. In addition, by combining data simul-
taneously acquired using surface and needle ele ctro-
des, it is possible to correlate the data from these
sources and obtain an estimate of the surface repre-
sentation of the MUP (called an SMUP template)
related to each MUPT. The SMUP is determined by
using the firing times of the main spike of each indi-
vidual MUP firing within a MUPT and relating these
to the potential observed at a surface electrode overly-
ing the needle uptake volume. By considering a “win-
dow” based on the needle-triggered firing, a template
of the mean observed voltage may be constructed by
ensemble averaging the voltages for each sample
across the window associated with each firing. This
will produce a template, seen at the surface electrode,
of the average voltage shape related to the needle-
observed MUP.
Through aggregate analysis of the MUPTs detected
during a contraction, or set of contractions, it is possible
to obtain information about the active MUs within a
muscle.Thisworkprovidesananalysisoftheinforma-
tion obtained through an aggregation approach.
The M UPTs considered were detected in the forearm
muscles of individuals with and without NSAP. By using
a s imple, statistically based, Bayesian classification algo-
rithm, we wished to explore the degree to which esti-
mates of the multidimensional distributions of features
used to represent MUPTs may be used to classify sets
of MUPTs, and to differentiate subjects with NSAP
from pain free subjects.
EachMUPTmaybeconsideredtohaveacharacteri-
zation. In th is work, a MUPT characterization is defined
as a set of two conditional probabilities: that of being
detected in a muscle of a subject with NSAP and that of
being detected in a muscle of a subject free of pain. If
we maintain our understanding of this MUPT character-
ization in purely probabilistic terms, then by considering
a set of MUPTs detected from the same muscle we may
estimate the overall conditional probability that the
muscle is from a subject with NSAP versus the probabil-
ity that the subject does not. This overall conditional
probability will be based on more evidence than is avail-
able by analysis of an individual MUPT. Each MUPT
contributes its conditional probability as a weighted vote
toward each possible class labelling.
Bayesian aggregation has been used in several fields
[21-25], including various medical and clinical applica-
tions [26,27]. Pfeiffer [28,29] first proposed Bayesia n
aggregation as a technique for combining the clinical
information available from the analysis of multiple
motor unit potentials. Bayesian aggregation considers a
priori information about data distribution shapes and
relative numbers of occurrence and combines it with
specific sampled data values to produce an overall char-
acterization. Our intention here is to explore this tech-
nique in relation to the poorly understood problem of
NSAP, and evaluate the utility of the Bayesian
technique.
NSAP is of interest in a diagnostic sense as the under-
lying pathophysiology is unknown; we therefore propose
a test that is discriminative for this condition. Based on
quantitative EMG data analysis, it is hoped that some
insight into the morphological differences seen in
MUPTs detected in muscles of subjects with NSAP, and
thus its pathophysiology, may be obtained.
It should be noted, however, that as in any similar
condition, a large enough sample of MUPTs from an
affected individual would contain MUPTs consistent
with the involved state, as well as essentially normative
MUPTs. This i s due simply to the fact that it is unlikely
that the condition has a uniform effect on all motor
units sampled; while some units will potentially be quite
significantlyinvolved,otherunitsmaybefreeofany
involvement at all. The MUPTs associated with these
uninvolved units will therefore produce measures that
are consistent with normative values, an d their presence
in data acquired from an involved subject will make cor-
rect interpretation more difficult. It is therefore reason-
able to hypothesize that both normative and involved
MUPTs will be acq uired from the same muscle (indeed,
during the same contraction), and that there is no clear
way to definitively separate such MUPTs using any type
of gold-standard as both may be considered to be repre-
sentative of a specific condition.
Hamilton-Wright et al. Journal of NeuroEngineering and Rehabilitation 2010, 7:8
/>Page 2 of 12
This situation is not restricted to NSAP. One must, in
fact, assume that this problematic condition may be pre-
sent in any t ype of diagnostic data related to a process
with variable involvement. As involvement proceeds, it
may be expected that more and more of the data
obtained in a sample may indicate a specific condition,
however it is unlikely that all samples may be consid-
ered unequivocally indicativ e of the condition, except in
very extreme cases.
Methods
Data collection
Ethics approval for this study was obtained from the
Queen’s University Health Sciences Research Ethics
Board. Electromyographic (EMG) data were c ollected
from 17 volunteers with signs and sympto ms consistent
withNSAP,aswellasanormativegroupof40
volunteers.
A clinical examination was performed and used to
mak e demographic comparisons between the groups, to
verify correct group assignment, and to verify that sub-
jects had no signs or symptoms of cervical radiculopathy
and/or other repetitive strain injury such as carpal tun-
nel syndrome, deQuervain’s tendonitis, or medial epi-
condylitis. The screening examination consisted of a
neurologic examination of the upper extremities, includ-
ing myotome testing, dermatome (light touch, pin prick)
testing, and assessment of the deep tendon reflexes at
the C5 to C8 levels. Cervical spine range of motion was
tested in sitting to ensure that cervical movements did
not reproduce the forearm symptoms. The movements
tested included flexion, extension, lateral flexion, rota-
tion, and combined extension with lateral flexion. These
movements were held at the end of the available range
of mo tion for 10 seconds. Three repetitions of maximal
handgrip strength (Jamar Dynamomter, Sammons Pre-
ston Inc., Mod el # 5030 J1; in positi on 2) a nd maximal
pinchgripstrength(BaselineEvaluationInstruments,
60# mechanical pinch gauge, model # 12 -0201) were
measured bilaterally with the elbow flexed to 90 degrees,
and with the wrist held in neutral between flexion and
extension, respectively.
For the participants in the NSAP group, several other
parameters were recorded and were used as a basis for
comparison for other samples not presented here. See
[30] for details.
A pressure algometer (model PTH-AF 2, Pain Diag-
nostic and Treatment Corporation, Great Neck, NY
11021, USA) was used to measure pain pressure thresh-
old (PPTh) and pain tolerance (PPtol). The device con-
sists of an analog force gauge fitted with a disc-shaped
rubber tip (1 cm
2
). The range of the gauge is 0-10 kg,
with increment markings at 0.1 kg. Measurements were
made at the nail bed of the third digit (D3), over the
bellies of the extensor carpi radialis brevis (ECRB) mus-
cle, the flexor carpi radialis (FCR) muscle, the biceps
brachii (BB) muscle an d the triceps brachii (TB) muscle.
Pain tolerance scores (PPtol) were normalized to the
amount of pressure subjects could withstand having
applied to the nail bed on D3 of the affected (or tested)
limb.
Subjects who were assigned to the NSAP group
experienced pain on palpation of the ECRB muscle and
complained of forearm pain during wrist extension
activities performed at work or in their leisure activities,
but resisted wrist extension with elbow extension as
described above did not reproduce their signs and
symptoms. We did not include any subjects who had
signs or symptoms that could be attributed to lateral
epicondylitis (i.e.; pain on resisted extension of digit 2
or 3, or pain on passive wrist flexion with the elbow
extended). Control subjects had no pain on resisted
wrist extension, passive wrist flexion, or palpation of the
lateral epicondyle or the ECRB muscle. Subjects in the
control group did not perform repetitive wrist motions
at work or during their leisure time. Both subject groups
excluded individuals with known cardiovascular, meta-
bolic (diabetes) or neurologic disorders. All subjects
provided informed consent prior to participation.
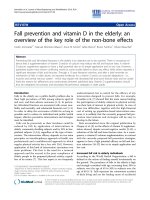
For the electromyographic evaluation, subjects were
seated in a straight back chair with the elbow of the
dominantarmflexedat90°andtheirforearmpronated
and resting on a custom-built table (Figure 1). Adjusta-
ble straps attached to the bottom of the testing table
were passed through an opening and secured around
the dorsum of the hand to provide resistance during the
isometric extension contractions. Surface electrodes
(Ag/AgCl; Kendall-LTP, Chicopee, Massachusetts, cut in
half to measure 1 × 3 cm) were placed on the tested
limb, and subjects were asked to perform a three second
maximum voluntary contraction (MVC) of their wrist
extensors with verbal encouragement provided through-
out. The peak root mean square (RMS) value calculated
over contiguous one second intervals of the surface
EMG attained d uring the MVC was determined. This
value represented the maximal voluntary EMG produced
by the subjects, termed maximal voluntary effort, or
MVE. The RMS values of all subsequent contractions
were expressed as a percentage of this value, and are
referred to as the %MVE-RMS.
Quantitative EMG analysis was performed using th e
DQEMG method and associated algorithms. These were
used as described in detail elsewhere [30-32]. Prior to
electrode placement, the motor point of the ECRB mus-
cle of the test limb was identified as the area over the
muscle surface where the lowest possible electrical sti-
mulus produced a muscle twitch. The location of the
motor point in the ECRB muscle is a pproximately two
Hamilton-Wright et al. Journal of NeuroEngineering and Rehabilitation 2010, 7:8
/>Page 3 of 12
cm distal to the cubital crease. Using the cathode por-
tion of a stimulating probe, with the train rate of the sti-
mulator set at 10 pps, and the stimulation duration set
at 1 ms [33], the cathode was moved over the muscle
belly until the motor point region was determined. The
skin above the motor point, the radial styloid process
and the dorsum of the hand of the test limb was cleaned
with rubbing alcohol prior to electrode placement. The
active e lectrode was positioned over the motor point of
the ECRB and the reference electrode was placed over
the radial styloid process to form a monopolar config-
uration, as described in [19]. A full-sized surface elec-
trode (2 cm by 3 cm) was positioned on the dorsum of
the hand to act as the common reference. A disposable
concentric needle (Model 740 38- 45/N; Ambu
®
Neuro-
line, Baltorpbakken, Ballerup, Denmark) elect rode was
inserted approximately 2 cm deep underneath the active
surface electrode.
AcquireEMG algorithms running on a Neuroscan
Comperio EMG system (Neurosoft, Sterling, VA) were
used to acquire the needle and surface EMG data during
30 s intervals as in [34]. The needle position was
adjusted until the average peak acceleration of the
MUPTs detected during a low-level contraction (5-10%
MVE) was above 30 kV/s
2
[33]. Once a suitable needle
position was found, the operator stabilized the needle
manually and then asked the subject to hold a desired
contraction force for 30 s. Subjects were provided with
avisualbargraphandanumericalvaluethat
corresponded to their force output (%MVE-RMS) for
feedback. Following each contraction the needle was
moved (medially, laterally, superficially and/or deeper)
so that MUPTs from different portions of the muscle
would be sampled in an effort to record from a large
representative pool of motor units. Each subject per-
formed repeated contractions until at least 30 MUP
trains were obtained. The contraction force was varied
between 5-20% of MVE. A 2-minute rest period was
provided between contractions.
The acquisition settings used were as reported in [30]:
micro (needle) data were bandpa ss filtered between 10
Hz-10 kHz and then sampled at 31250 samples/second;
macro (surface) data were a bandpass filtered between 5
Hz-5 kHz and sampled at 3125 samples/second.
EMG decomposition
Needle-detected EMG data from all contractions were
decomposed using the DQEMG program of Stashuk
[32-34], which calculates a set of quantitative EMG
summary statistics for each MUPT acquired during each
muscle contraction. These measures describe the MUP
shape and MU firing behaviour of each MU sampled
from the muscle [35], and s uch parameters have been
shown to be relevant in determining the type (myo-
pathic vs. neuropathic) of disease involvement [28,29].
The DQEMG program produces a number of mea-
sures; the features used are listed in Table 1. These
measures are common quantitative EMG parameters,
Figure 1 Data Collection Procedure.
Hamilton-Wright et al. Journal of NeuroEngineering and Rehabilitation 2010, 7:8
/>Page 4 of 12
the definition and collection of which are described in
[19,35-37].
For some features, as noted in Table 1, logarithmic
mapping w as done in an attempt to provide a data dis-
tribution more closely approximating a Gaussian distri-
bution, as many of the feature values stem from a
multiplicative relationship between several underlying
processes, causing their combined distribution to resem-
ble a n exponential distributio n. Peak-to-peak amplitude
is, for instance, a function of both the size and number
of the active muscle fibres as well as the distance
between these fibres and the electrode surface. As these
factors combine multiplicatively, the distribution of
observed values from a collection of fibres is extremely
skewed, more closely describing an exponential distribu-
tion than a Gaussian one; the log of these values was
therefore used to mitigate skewness. As skewness has
serious implications for the classifier discussed later, this
is expected to improve classifier performance; this
hypothesis was confirmed through a set of p reliminary
experiments performed while preparing the data.
In the case of these log-transformed features, all calcu-
lations shown here were done with t he log-transformed
values.
Data distribution construction and cross-validation
In total, 266 MUPTs were collected from the 17 subjects
with NSAP and 1168 MUPTs were collected f rom the
40 control subjects. Each subject’s EMG data set is hen-
ceforth referred to as a muscle study. Each muscle study
is represented by the collection of the MUPTs extracted
from EMG data detected from the same muscle during
contractions performed on the same occasion. As the
objective during data collection was to have at least 30
separately identifiable MUPTs for each muscle study,
the number o f contractions per study varied from sub-
ject to subject.
As mentioned in the introduction, the data in the
NSAP class contains several samples that would and
should be considered normative, greatly increasing the
difficulty of the characterization task. One of the major
outcomes of this analysis is to show to what degree it is
possible to aggregate the information from MUPTs with
a variety of individual characterizations, across a set of
MUPTs, to produce a correct overall characterization of
a muscle as being either NSAP or normative.
In order to establish performance estimates, the avail-
able MUPT data were organized into 10 cross-validation
poo ls, constructed to preserve the underlying groupi ngs
of the data collection process. These pools were con-
structed by iterating down the lists of NSAP and norma-
tive studies, placing data from each subsequent study
into the next cross-validation pool in round-robin f ash-
ion. This strategy ensures that all of the MUPTs col-
lected from the same muscle remained together for
purposes of aggregation as described below, while also
ensuring that each pool conta ined studies from both
Normative and NSAP characterized data. Enforcing the
presence of data from both characterization classes in
all testing sets controlled potential bias arising from the
fact that there are significantly more normative than
NSAP contractions in the training data.
The cross-validation pools where then used to con-
struct experimental data sets such that the data in eac h
pool were used only once for testing, with training data
obtained by combining all other pools. Results were cal-
culated across all pools, allowing average performance to
be calculated. In light of the discussion in [38] and [39],
full leave-one-out cross-validation was not used, as the
cited works indicate that 10-fold cross-validation should
provide an estimate of performance with less bias that
that provided by full leave-one-out cross-validation.
Classifier construction
A discriminant function providing the minimum-error-
rate for two classes may be represented as
kkk
pP
ln | ln ( ).x
(1)
This encodes a distance measure (δ)thatprovidesthe
minimum error rate discriminant for class k of some K
total classes for a given input vector, x, given th e condi-
tional probability of the observation of x given class ω
k
as well as the overall a priori probability of occurrence
Table 1 Features Studied and their Units.
Transform Feature Abbreviation Units
log Amplitude Ampl ln(μV)
Duration Duration μs
Phases Phases
Turns Turns
log Area/Amplitude Ratio AAR ln(ms)
log Macro Amplitude Mac Ampl ln(μV)
log Macro Negative Peak Area Mac. -Pk Area ln(μV·ms)
log Macro Neg. Peak Amplitude Mac -Pk
Ampl
ln(μV)
Macro Negative Peak Duration Mac -Pk Dur ms
Inter-Discharge Interval Mean IDI mean ms
IDI Standard Deviation IDI std. dev.
IDI Covariance IDI cov
Inter-Discharge rate IDRate pps
Firing Rate FR pps
Firing Rate Mean Consecutive
Difference
FRMCD pps
A “log” Transform indicates that after the measurement of the feature, data
was transformed using the natural logarithm before being used for
calculation.
Hamilton-Wright et al. Journal of NeuroEngineering and Rehabilitation 2010, 7:8
/>Page 5 of 12
of samples from class ω
k
. Here we make no assumption
regarding class probabilities, and assume that all ω
k
are
equally probable.
If the distribution of feature values follows a Gaussian
distribution, then a Bayesian discriminant function
provides optimal separation between classes [[40] pp.
37-41], and a “Normal Density Discriminant Function”
(NDDF) classifier may be constructed using
k
t
kk
t
k
wxxWxwx
0
,
(2)
where
W
S
wSm
mS m
S
k
kkk
kk
k
w
k
k
k
k
P
1
2
1
22
1
0
,
ln
ln ,
in which the variables S
k
, m
k
and P(ω
k
) refer, respec-
tively, to our estimates of the covariance matrix and
mean vector and relative probability of occurrence of
class k of K classes (in this case, K = 2: Normative and
NSAP ). In the above equations, X
-1
indicates the matrix
inverse operation, and |X| indicates the calculation of
the determinant.
This formulation is simply the discriminant function
constructed from (1) using the general multivariate nor-
mal density
p
d
t
x
S
xm S xm
1
2
2
1
2
1
2
exp
(3)
in which d is the dimensionality (the number of in put
features) in the problem. A s can be seen in (2), this fac-
tor drops out in the construction of the discriminant
through the application of the natural logarithm.
The discriminant of (2) can therefore be seen as pro-
viding a measure of similarity to a Gaussian distribution,
and is t herefore equivalent to calculating the relative
distance to each mean using the Mahalanolbis distance
r
t
()().xmS xm
1
(4)
In (4), r provides the distance from the mean of a
Gaussian (Normal) distribution in units of standard
deviation, implying that the Mahalan olbis distance may
then be directly use d as a z-score to relate a given point
to its expected probability of occurrence in the related
distribution. In fact this produces the same classification
results as (2).
In order to apply the above equations, the mean and
covariance are calculated using all of the MUPTs avail-
able for training separated by class. The per-class mean
and covariance may then be calculated directly from
these groups. Mean values were calculated individually
for each feature; covariance data was ca lculated using
these per-feature means.
As mentioned above, the relativ e probab ility of oc cur-
rence of each class, P(ω
k
), was set to 0.5 (or “no infor-
mation”) to establish a uniform prior probability
estimate.
Aggregation of classifier results
Applying the NDDF classifier as described will produce
an estimate of the characterization for each MUPT.
Such a characterization does not take into account the
fact that further information is available, specifically that
MUPTs collected from the same muscle may be consid-
ered as a set in order to produce a mu scle characteriza-
tion, in which each MUPT supports (or refutes) a
specific characterization of that muscle. Individual
MUPTs can be considered to be associated with infor-
mation that is meaningful only in the collective sense;
by collecting such infor mation together; it is possible to
use aggregation to account for the presence of norma-
tive MUPTs in NSAP data.
Further, the characterization of individual MUPTs is
not as meaning ful as the characterization of a muscle as
a w hole. This implies that while individual MUPTs col-
lected from a single contraction may, or may not, show
indications of NSAP that may be preferentially affecting
only some motor units of a muscle, it is the overall diag-
nosis of NSAP that need concern us here. If there is
indeed such variable expression of disease state, aggrega-
tion of the individual MUPT outcomes should allow an
overall diagnosis to be made, in spite of this variation in
outcome associated with the individual MUPT samples.
We must be careful to form an aggregation that cor-
rectly reflects the information presented by each MUPT,
without overstating the importance of any single mea-
surement. Essentially we expect to see both MUPTs that
“lo ok normative” in muscle studies from patients with
NSAP, and we expect to see MUPTs that appear consis-
tent with NSAP in muscle studies from control subjects.
We wished t o integrate the information present in a
set of MUPTs sampled from the same muscle over a
set of contractions into a single muscle characteriza-
tion. Specifically, we wished to consider the set of
MUPTresultsasagroupofinputvaluesforsome
form of aggregation classifier. We therefore compared
results in terms of successful muscle level characteriza-
tion using four different aggregation schemes as
described below.
Hamilton-Wright et al. Journal of NeuroEngineering and Rehabilitation 2010, 7:8
/>Page 6 of 12
Independent MUP analysis
The first calculation done examines the results of the
NDDF classifier as run independently on each MUPT,
producing a total of 1434 characterizations. This analysis
was performed for two reasons: the accuracy of the clas-
sification system when no muscle-level knowledge is
used provides the minimum accuracy we would expect
from aggregation, and a dditionally, it is these NDDF
measures that will be used to produce the aggregate
results to be compared.
Vote-based aggregation
A simple and obvious aggregation strategy to aggregate
the 1434 MUPT results into descriptions of the 57 mus-
cular studies is to apply a simple majo rity vote scheme.
We therefore simply examine all MUPTs sampled from
a muscle a nd count, for each class, the number of
MUPTs for which that class was indicated as having a
maximum conditional probability. The class label that
had the majority count was then applied to all MUPTs
in the contraction. In cases of a tie, one of the labels
was randomly chosen.
Note that this strategy does not take into account the
magnitude of the difference in conditional probability
used to choose the winning class; the smallest of mar-
gins produces a vote of the same weight as a unity
probability.
Bayesian aggregation
The magnitude of difference in probability may be
further taken into account through further leveraging of
our assumption that the class distributions may be
defined as conditional probability distributions following
a Gaussian curve, and using the relative probabilities
found in an aggregate calculation of the joint probability
of association across all MUPTs studied.
This may be easily calculated once we realiz e that the
formulation of (1) allows us to combine the joint prob-
abilities of observation of several x va lues, as it is
equivalent, within a scale factor, of either
kkk
kk
pP
P
p
k
P
k
p
i
P
i
xx
xx
x
x
|,
|
|
|
or
i
K
1
.
(5)
In particular, the second formulation here indicates
that in order to produce an aggregation of the joint
probabilities across a series of MUPT samples x
1
, x
2
,
x
n
, we may simply multiply together all of the δ
k
values
obtained for each sample within the same class to obtain
an estimate of the joint probability Δ
k
, i.e.;
kki
i
n
kn
p
xxxx
1
12
|,,
(6)
As the normalization required to turn ( 6) into a true
probability is the same fo r each class considered, it need
not be considered when constructing the aggregate dis-
criminant, as its effect will simply be to scale each prob-
ability by the same value. To calculate a relative
probability therefore we need simply multiply the values
for each discriminant obtained from (2) as shown in (6)
without a need to normalize the result. We will then
use the highest Δ
k
value to indicate the class association.
Mean NDDF discriminant
As a final strategy, a mean distance across all MUPTs in
a contraction was calculated for a given class, by calcu-
lating an average of the distances determined by the
NDDF classifier. This mean value wa s then computed
for each class, resulting in a measure describing the
average distance of the MUPTs in a given contraction
from each c lass. The contraction was then assigned to
the “closest” class based on this average distance.
Results
Sample demographic information
The demographic information of both samples is pre-
sented in Table 2. The clinical questionnaire and clinical
evaluation outcomes for the NSAP group are presented
in Table 3. The upper limb tension test with radial bias
(ULTT3) revealed that none of the NSAP subjects had a
positive test.
Distribution parameter estimate stability
Table 4 reports the variability of the mean and coeffi-
cient of variation for each of the features described in
Table 1.
Columns indicated as s (μ) contain the standard devia-
tion of the mean values obtained over each feature in a
given class, calculated over the 10 cross-validation tests.
Conversely, columns marked μ(s) show the average of
the per-feature standard deviations, again independently
for each feature. Together, these values may be used to
get an estimate of the variability in the mean values
obtained for the various Normative and NSAP
Table 2 Demographic Data.
n NSAP
Mean ± SD
n Control
Mean ± SD
Height (cm) 17 164.6 ± 7.9 40 170.2 ± 8.4
Weight (lbs) 17 159.2 ± 29.7 40 149.1 ± 24.2
Age (years) 17 50 ± 9** 40 27 ± 5*
MVC (N) 17 127.1 ± 48.8** 40 195.1 ± 51.3*
Hamilton-Wright et al. Journal of NeuroEngineering and Rehabilitation 2010, 7:8
/>Page 7 of 12
distr ibutions tested, and relate these to the variability of
the distributions themselves, noting that all that is shown
is the feature-independent variability, and not the inter-
feature dependence found in a full covariance matrix.
To that end, the columns marked ψ show the coeffi-
cient of variation, which is the ratio of the standard
deviation of the mean of a feature versus the mean
variability of the feature overall, or
i
i
.
(7)
This statistic measures the dispersion of the probabil-
ity distribution of the feature values.
The final column in Table 4 is a t value calculated by
taking the difference between the mean values and nor-
malizing by the mean st andard deviation values weighted
by the degrees of freedom (d.f.) introduced by the tests, or
t
i
Normative
i
NSAP
i
Normative
i
NSAP
i
d.f. d.f
,
(8)
where the number of degrees of freedom is 10, based
on the 10× cross-fold validation. This measure provides
a means of identifying the contribution to classification
relative to the Normal cla ssifier, but does not measure
the information content of the feature if the assumption
of Normal distribution is violated. Note that it is clear
Table 3 Clinical evaluation outcomes from the Disability
of arm shoulder and hand (DASH) questionnaire, SF-36
eight domain scores, ULTT3 (number of positive tests,
pain threshold scores (values in brackets are normalized
to third nail bed; D3), grip and pinch-grip strength for
the NSAP group.
n NSAP Mean ± SD
DASH
Disability score 16 23.83 ± 12.96
Work module 15 35.22 ± 31.59
Sport/art module 9 68.06 ± 29.22
SF-36
Physical functioning 15 82.00 ± 18.01
Role physical 16 62.50 ± 38.76
Bodily pain 16 57.38 ± 18.75
General health 16 73.12 ± 20.04
Vitality 16 61.56 ± 18.86
Social functioning 16 84.38 ± 17.38
Emotional role 16 83.33 ± 32.20
Mental health 16 76.50 ± 16.58
ULLT3 (n positive) 16 0
Pain Threshold (kg/cm
2
)
D3 16 12.87 ± 5.95
ECRB 16 5.78 ± 3.49 (45%)
FCR 16 9.18 ± 5.06 (71%)
BB 16 9.08 ± 4.74 (71%)
TB 16 8.28 ± 5.02 (64%)
Grip strength (kg) 16 33.95 ± 13.06
Pinch grip strength (kg) 16 9.41 ± 3.89
Table 4 Distributions Obtained of Features Studied.
Normative NSAP
Feature μ(μ) s(μ) μ(s) ψ μ(μ) s(μ) μ(s) ψ t
log Ampl 5.923 0.555 0.016 35.361 5.883 0.485 0.018 27.127 0.17
Duration 9.742 4.861 0.071 68.147 9.190 2.877 0.142 20.316 0.31
Phases 2.570 0.923 0.024 39.074 2.767 0.925 0.035 26.561 0.48
Turns 3.381 1.658 0.043 38.566 3.101 1.462 0.059 24.915 0.40
log AAR 0.237 0.393 0.007 56.585 0.333 0.362 0.017 21.244 0.57
log Mac Ampl 4.187 0.766 0.032 24.010 4.018 0.605 0.048 12.721 0.55
log Mac -Pk Area 5.882 0.936 0.037 25.323 5.439 0.724 0.052 13.941 1.19
log Mac -Pk Ampl 3.656 0.738 0.032 22.919 3.432 0.651 0.051 12.759 0.72
Mac -Pk Dur 25.516 13.701 0.222 61.805 17.745 5.753 0.220 26.097 1.65
IDI mean 69.881 14.657 0.466 31.425 72.858 15.857 0.557 28.444 0.44
IDI std dev 9.500 4.293 0.067 63.896 8.265 5.259 0.173 30.441 0.58
IDI cov 0.138 0.056 0.001 41.829 0.112 0.053 0.002 24.638 1.03
IDRate 58.552 22.901 0.458 50.038 54.498 18.650 0.488 38.255 0.43
FR 14.873 2.880 0.103 28.080 14.292 2.802 0.113 24.780 0.49
FRMCD 0.192 0.111 0.003 44.018 0.147 0.095 0.004 24.676 0.98
The notation “log” indicates those columns whose data is log-transformed before analysis as shown in Table 1.
Hamilton-Wright et al. Journal of NeuroEngineering and Rehabilitation 2010, 7:8
/>Page 8 of 12
that no single feature, in and of i tself, is sufficient to
determine between Normative and NSAP values.
Classification accuracy
Tables 5 through 8 are set up as confusion matrices
describing the results of independent MUPT classifica-
tion, vote based aggregation, Bayesian aggregation and
mean NDDF discriminant respectively.
Each table contains a header and summary row. The
central rows of the table are set up in the following way:
• each row is labelled with the true characterization,
• the first two columns indicate the number of charac-
terization with the true label into each of the possible
characterization labels,
• the “Totals” column shows the number of elements
in each true class, and
•“per-class accuracy” is the fraction of the elements
that was correctly labelled for each class. Considering
NSAP as a “positive test outcome,” and Normative as a
“negative test outcome”, the per-class accuracies for the
NSAP and Normative classes are, respectively, the esti-
mates of the sensitivity and specificity of the classifier;
the overall accuracy of the classifier is simply the sum
of the per-class accuracy values divided by the number
of classifications made.
The bottom of the table displays overall statistics.
Totals are tallied for eac h column, whi ch indicate the
number of samples assigned to each target class; in the
case of Table 5 these are MUPTs, in the rema ining
tables these are muscles.
The value at the foot of the “Per-class accuracy” col-
umn is s imply the product of all of the per-class accu-
racy values assigned, and is termed “P erfo rmanc e.” This
was chosen as an overall performance statistic as it
equally weights the contribution to overall performance
by each class while providing a metric that can be used
to compare the different classification schemes. It
should be pointed out that although this metric is [0···1]
bounded, the multiplicative relationship between the ele-
ments does mean it is non-linear (though monotonically
increasing).
Table 5 indicates the results of analysis using the
NDDF classifier when classifying each MUPT indepen-
dently (i.e.; discarding the knowledge that for a set of
MUPTs sampled from a muscle all the MUPTs come
from the same muscle, and thus must have t he same
characterization). These results show that, as a baseline ,
approximately 3/4 of the individual MUPT characteriza-
tions have a maximum conditional pro bability that
matches the true muscle characterization.
An analysis of the same underlying data is shown in
Table 6, but with an aggregate label calculated using the
voting aggregation as presented above. Immediately
apparent from this table is t he fact that aggregate deci-
sion making results in a much higher degree of accu-
racy: the poorest per-class accuracy is 0.875 based on
best-vote-takes-all.
Bayesian aggregation provides somewhat different
values,showninTable7,which indicates that the
increase in accuracy is similar to that in the voting
scheme.
Table 8, displaying the mean NDDF classification,
shows that this technique is severely biased toward Nor-
mative, achieving an accur acy of roug hly only 2 in 3 on
NSAP data.
An analysis of the significance of these results was cal-
culated using McNemar’s test [41,42]. This test was con-
structed by examining the pair-wise differences between
the same contractions as evaluated by each test. Four
groups were constructed, containing the counts of: the
instances for which both classifiers were correct; the
instances for which both were incorrect; those for which
Table 5 NDDF (Independent)/10 fold cross-validation
(MUPTs)
Assigned Label
True Label Normative NSAP Totals Accuracy/Performance
Normative 900 268 1168 0.771
NSAP 73 193 266 0.726
Totals 973 461 0.559
Table 8 Mean NDDF/10 fold cross-validation
(contractions)
Assigned Label
True Label Normative NSAP Totals Accuracy/Performance
Normative 38 1 39 0.974
NSAP 5 11 16 0.688
Totals 43 12 0.670
Table 6 NDDF + vote/10 fold cross-validation
(contractions)
Assigned Label
True Label Normative NSAP Totals Accuracy/Performance
Normative 36 3 39 0.923
NSAP 2 14 16 0.875
Totals 38 17 0.807
Table 7 NDDF + Bayes/10 fold cross-validation
(contractions)
Assigned Label
True Label Normative NSAP Totals Accuracy/Performance
Normative 34 5 39 0.872
NSAP 1 15 16 0.938
Totals 35 20 0.817
Hamilton-Wright et al. Journal of NeuroEngineering and Rehabilitation 2010, 7:8
/>Page 9 of 12
there was an improvement in classification by the sec-
ond classifier (i.e.; the first classifier was wrong, but the
second was correct); and those for which there was a
degradation (first was correct, the second was wrong).
The McNemar test relates the association between the
changes in “treatment” (here the change in classif ier)
and the change in outcome (termed “discordant pairs”).
With no association, the two discordant pairs should be
equal, and a c
2
value can then be calculated from two
discordant pairs a and b using
2
1
2
,
(9)
calculated using 1 degree of freedom.
Table 9 provides the number of improved and
degraded discordant pairs, as well as the 2-tailed p-value
and, c
2
. As can be seen in this table, there are no sig-
nificant differences between any groups in these data.
Discussion
The clinical assessment showed there were no strength
differences between the individuals with and without
NSAP; in fact the groups were very similar other than
the fact that the individuals with forearm pain scored
higher on measures of pain and disability, had a lower
tolerance to pressure applied to their ECRB muscle and
their triceps muscle. Other than non-specific symptoms
of pain, therefore, there were no features on examina-
tion that would suggest that the individuals with NSAP
had either myopathy or neuropathy.
Classification outcome
The power of Bayesian aggregation would lead us to
expect that the results in Table 7 would provide a sig-
nificantly higher performance than the simple voting
results shown in Table 6. The fact that this is not the
case is very instructive regarding the estimation of the
underlying data distribution. Such an expecta tion rests
upon the assumption that t he Bayesian aggregation has
access to useful and correc t information describing both
the Normative class and the NSAP class; which in turn
is based on the assumption that both of these are in fact
Gaussian distributions.
The fact that muscle characterization based on i ndivi-
dual MUPT characterizations performed quite well (i.e.,
75% accuracy on MUPT a nalysis) lends a great deal of
support to this premise, as poor results are found when
using this classification scheme on significantly skewed
distributions. The evidence here is that although the dis-
tributions are centrally limited, the assumption of a
Gaussian distribution is not well founded in this case,
though the limitations of this assumption are not severe.
One potential weakness stems from the amount of
data available to estimate distribution par ameters.
Although the method of estimation used is optimal
given a Gaussian distribution [[40], pp. 36], insufficient
data will provide an unstabl e estimate. The stability of
our parameter e stimates as shown in Table 4 indicate
not only that the mean values calculated are relatively
stable, but that the variance in these estimates are sig-
nificantly smaller than the per-feature standard devia-
tions associated with each feature.
Essentially, the conclusion that may be reached based
on our observations is that although the Bayesian aggre-
gation technique using sets of MUPTs substantially
increases classification accuracy (relative to unaggre-
gated data), the assumption of a Gaussian distribution
to describe the data limits its effectiveness; there is no
more information, on average, available in the estimate
of distribution shape and Bayesian aggregation than is
available through aggregate voting.
The outlier detection methods introduced in [43] and
applied and discussed in [44,45] are relevant here as it is
exactly these outliers that contribute to the ability o f the
Bayesian estimator to determine that these muscles are
not normative. The inference applied here limits the
extent to which outlier following will be performed,
ensuring that the outlier-based classifications are appro-
priately weighted by the observation of normative
MUPTs. If appropriate probabilities are available for the
Bayesian estimator, it may be expected that this will pro-
vide an excellent mechanism for determining when
enough MUPTs have been observed, allowing the central
question of [45] to be explored in a probabilistic sense.
This observation in turn supports the idea that with a
better understanding of the true data distribution, a bet-
ter Bayesian estimator may be produced. The authors
intend to apply an event-based treatment introduced in
earlier work [36] to these data, providing an analysis
that is free from the assumption of a Gaussian
distribution.
The measure of stability (column marked ψ in Table 4)
provides insight into the variability of t he means of the
Table 9 McNemar Test Results on Classifier Performance
Classifiers Improved Degraded 2-tailed p-value c
2
Odds Ratio Confidence Interval
MICD+Bayes -vs- MICD+mean 4 4 0.72 0.125 1.00 0.189 5.37
MICD+Bayes -vs- MICD+vote 2 1 1.00 0.125 2.00 0.104 118
MICD+vote -vs- MICD+mean 4 3 1.00 0.000 1.333 0.226 9.10
Hamilton-Wright et al. Journal of NeuroEngineering and Rehabilitation 2010, 7:8
/>Page 10 of 12
two classes relative to the class variances; when compared
with the t values shown in the right-most column of
Table 4 we see that there is significant information pre-
sent in these columns. We may therefore conclude that
though our assumption of a Gaussian distribution does
not accurately reflect the underlying distribution of the
data for all of the reasons mentioned above, there is sig-
nificant information content in these data that will allow
decisions to be made. Further, we can estimate, based on
these data, which features are likely to be the most infor-
mative overall, and further exploration of these features
in a non-parametric analysis is warranted.
We intend therefore to proceed to an analysis of these
data using stronger, non-parametric techniques to ascer-
tain whether a better classification may be obtained
then the already-strong performance obtained here.
Conclusions
In support of the findings of [28,29], MUPT classifica-
tion performance may be improved through the applica-
tion of Bayesian aggregation, however the degree of
improvement may be limited to that obtained through
simpler means, such as majority vote.
The limitation in the performance improvement
observed is not related to an inability to estimate distribu-
tion parameters because of a lack of data; instead, limita-
tions are apparent because of assumptions of distribution
shape that do not reflect the true MUP morphological and
MU firing pattern changes occurring due to involvement.
An investigation into more appropriate methods to
examine the distribution of involved versus normative
data should allow Bayesian aggregatio n to achieve
improved characterization accuracy.
Acknowledgements
Funding for this project was received from the Canadian Foundation for
Innovation, the Ontario Innovation Trust and the Workplace Safety and
Insurance Board (WSIB) of Ontario.
Author details
1
School of Rehabilitation Therapy, Queen’s University, Kingston, Ontario,
Canada.
2
Math and Computer Science, Mount Allison University, New
Brunswick, Canada.
3
Computing and Information Science, University of
Guelph, Ontario, Canada.
4
Department of Systems Design Engineering,
University of Waterloo, Ontario, Canada.
Authors’ contributions
All authors consulted and collaborated throughout the study. LMcL
conceived of the initial idea, while AH-W carried out the experimental
procedure, developed all related Matlab
©
programs and drafted the
manuscript. KMC collected the data and performed initial statistical analyses.
All authors participated in the study design, and read and approved the final
manuscript.
Competing interests
The authors declare that they have no competing interests.
Received: 25 June 2008 Accepted: 15 February 2010
Published: 15 February 2010
References
1. Urwin M, et al: Estimating the burden of musculoskeletal disorders in the
community: the comparative prevalence of symptoms at different
anatomical sites, and the relation to social deprivation. Ann Rheum Dis
1998, 57(11):649-55.
2. Macfarlane GJ, Hunt IM, Silman AJ: Role of mechanical and psychosocial
factors in the onset of forearm pain: prospective population based
study. BMJ 2000, 321(7262):676-9.
3. Walker-Bone K, Cooper C: Hard work never hurt anyone: or did it? A
review of occupational associations with soft tissue musculoskeletal
disorders of the neck and upper limb. Ann Rheum Dis 2005, 64(10):1391-6.
4. Harrington JM, et al: Surveillance case definitions for work related upper
limb pain syndromes. Occup Environ Med 1998, 55(4):264-71.
5. Larsson SE, et al: Muscle changes in work-related chronic myalgia. Acta
Orthop Scand 1988, 59(5):552-6.
6. Larsson B, Libelius R, Ohlsson K: Trapezius muscle changes unrelated to
static work load. Chemical and morphologic controlled studies of 22
women with and without neck pain. Acta Orthop Scand 1992, 63(2):203-6.
7. Hagg G: Static workloads and occupational myalgia: a new explanation
model. Electromyographical Kinesiology ElsevierAnderson P, Hobart DJ,
Danoff JV 1991, 441-444.
8. Larsson SE, et al: Chronic trapezius myalgia. Morphology and blood flow
studied in 17 patients. Acta Orthop Scand 1990, 61(5):394-8.
9. Larsson B, et al: Mechanical performance and electromyography during
repeated maximal isokinetic shoulder forward flexions in female
cleaners with and without myalgia of the trapezius muscle and in
healthy controls. Eur J Appl Physiol 2000, 83(4-5):257-67.
10. Dennett X, Fry HJ: Overuse syndrome: a muscle biopsy study. Lancet
1988, 1(8591):905-8.
11. Greening J, et al: The use of ultrasound imaging to demonstrate reduced
movement of the median nerve during wrist flexion in patients with
non-specific arm pain. J Hand Surg 2001, 26(5):401-6, discussion 407-8.
12. Greening J, Lynn B, Leary R: Sensory and autonomic function in the
hands of patients with non-specific arm pain (NSAP) and asymptomatic
office workers. Pain 2003, 104(1-2):275-81.
13. Greening J, Dilley A, Lynn B: In vivo study of nerve movement and
mechanosensitivity of the median nerve in whiplash and non-specific
arm pain patients.
Pain 2005, 115(3):248-53.
14. Greening J: Workshop: clinical implications for clinicians treating patients
with non-specific arm pain, whiplash and carpal tunnel syndrome. Man
Ther 2006, 11(3):171-2.
15. Larsson SE, et al: Muscle changes in work-related chronic myalgia. Acta
Orthop Scand 1988, 59(5):552-6.
16. Larsson B, Libelius R, Ohlsson K: Trapezius muscle changes unrelated to
static work load. Chemical and morphologic controlled studies of 22
women with and without neck pain. Acta Orthop Scand 1992, 63(2):203-6.
17. Larsson SE, et al: Chronic trapezius myalgia. Morphology and blood flow
studied in 17 patients. Acta Orthop Scand 1990, 61(5):394-8.
18. Greening J, et al: Reduced movement of median nerve in carpal tunnel
during wrist flexion in patients with non-specific arm pain. Lancet 1999,
354(9174):217-8.
19. Stashuk DW: Quantitative Electromyography. 2002, 311-348, Brown et al.
20.
20. Brown WF, Bolton CF, Aminoff MJ, (Eds): Neuromuscular Function and
Disease Philadelphia: W.B. Saunders 2002.
21. West M: Bayesian aggregation. J Royal Stat Soc 1984, 147(4):600-607.
22. Clemen RT, Winkler RL: Combining probability distributions from experts
in risk analysis. Risk Analysis 1999, 19(2):187-203.
23. Rosqvist T: Bayesian aggregation of experts’ judgements on failure
intensity. Rel Eng Sys Safety 2000, 70(3):283-289.
24. Budescu DV, Yu H-T: To Bayes or not to Bayes? A comparison of two
classes of models of information aggregation. Decision Analysis 2006,
3(3):145-162.
25. Barutcuoglu Z, De Coro C: Hierarchical shape classification using Bayesian
aggregation. Shape Modeling and Applications 2006, 44-48.
26. Lipscomb J, Parmigiani G, Hasselblad V: Combining expert judgement by
hierarchical modeling: an application to physician staffing. Manag Sci
1998, 44(2):149-161.
27. Kononenko I: Inductive and Bayesian Learning in Medical Diagnosis.
Applied Artificial Intelligence 1993, 7(4):317-337.
Hamilton-Wright et al. Journal of NeuroEngineering and Rehabilitation 2010, 7:8
/>Page 11 of 12
28. Pfeiffer G, Kunze K: Discriminant Classification of Motor Unit Potentials
(MUPs) Successfully Separates Neurogenic and Myopathic Conditions.
Electroenceph Clin Neurophys 1995, 97(5):191-207.
29. Pfeiffer G: The diagnostic power of motor unit potential analysis: an
objective Bayesian approach. Muscle Nerve 1999, 22(5):584-591.
30. Calder K, Stashuk DW, McLean L: Motor Unit Potential Morphology
Differences in Individuals with Non-Specific Arm Pain and Lateral
Epicondylitis. J NeuroEng and Rehab 2008, 5:1-11.
31. Calder K, Stashuk DW, McLean L: Physiological Characteristics of Motor
Units in the brachioradialis muscle across fatiguing low-level isometric
contractions. J Electromyogr Kinesiol 2008, 18(1):2-15.
32. Stashuk DW, Paoli GM: Robust supervised classification of motor unit
action potentials. Med Biol Eng Comput 1998, 36:75-82.
33. Stashuk DW: Decomposition and quantitative analysis of clinical
electromyographic signals. Med Eng & Phy 1999, 21(6):389-404.
34. Stashuk DW: EMG signal decomposition: How can it be accomplished
and used? J Electromyogr Kinesiol 2001, 11(3):151-173.
35. Brown WF: The Physiological and Technical Basis of Electromyography
Butterworth 1984.
36. Hamilton-Wright A, Stashuk DW: Clinical characterization of
electromyographic data using computational tools. Symposium on
Computational Intelligence In Biology, (CIBCB’06), Toronto 2006.
37. Stashuk DW, Doherty TJ: Normal Motor Unit Action Potential. 2002,
311-348, Brown et al. 20.
38. Kohavi R: A study of cross-validation and bootstrap for accuracy
estimation and model selection. Proc. 14th Int. Joint Conference on Artificial
Intelligence, (IJCAI-95) Montréal, Québec, Morgan Kaufmann 1995, 1137-1143.
39. Nadeau C, Bengio Y: Inference for the Generalization Error. Machine
Learning 2003, 52(3):239-281.
40. Duda RO, Hart PE, Stork DG: Pattern Classification Wiley, 2 2001.
41. McNemar Q: Note on the Sampling Error of the Difference Between
Correlated Proportions of Percentages. Psychometrika 1947, 12(2):153-157.
42. Durkalski VL, Palesch YY, Lipsitz SR, Rust PF: Analysis of Clustered Matched-
Pair Data. Statistics in Medicine 2003, 22(15):2417-2428.
43. Stålberg E, Bischoff C, Falck B: Outliers, a way to detect abnormality in
EMG. Muscle & Nerve 1994,
17(4):392-399.
44. Podner S: Usefulness of an increase in size of motor unit potential
sample. Clinical Neurophysiology 2004, 115(7):1683-1688.
45. Podner S: Comparison of different outlier criteria in quantitative anal
sphincter electromyography. Clinical Neurophysiology 2005,
116(8):1840-1845.
doi:10.1186/1743-0003-7-8
Cite this article as: Hamilton-Wright et al.: Bayesian aggregation versus
majority vote in the characterization of non-specific arm pain based on
quantitative needle electromyography. Journal of NeuroEngineering and
Rehabilitation 2010 7:8.
Submit your next manuscript to BioMed Central
and take full advantage of:
• Convenient online submission
• Thorough peer review
• No space constraints or color figure charges
• Immediate publication on acceptance
• Inclusion in PubMed, CAS, Scopus and Google Scholar
• Research which is freely available for redistribution
Submit your manuscript at
www.biomedcentral.com/submit
Hamilton-Wright et al. Journal of NeuroEngineering and Rehabilitation 2010, 7:8
/>Page 12 of 12