báo cáo hóa học: " A decision support framework for the discrimination of children with controlled epilepsy based on EEG analysis" pdf
Bạn đang xem bản rút gọn của tài liệu. Xem và tải ngay bản đầy đủ của tài liệu tại đây (3.22 MB, 14 trang )
JNER
JOURNAL OF NEUROENGINEERING
AND REHABILITATION
Sakkalis et al. Journal of NeuroEngineering and Rehabilitation 2010, 7:24
/>Open Access
RESEARCH
© 2010 Sakkalis et al; licensee BioMed Central Ltd. This is an Open Access article distributed under the terms of the Creative Commons
Attribution License ( which permits unrestricted use, distribution, and reproduction in
any medium, provided the original work is properly cited.
Research
A decision support framework for the
discrimination of children with controlled epilepsy
based on EEG analysis
Vangelis Sakkalis*
1
, Tracey Cassar
2
, Michalis Zervakis
3
, Ciprian D Giurcaneanu
4
, Cristin Bigan
5
, Sifis Micheloyannis
6
,
Kenneth P Camilleri
2
, Simon G Fabri
2
, Eleni Karakonstantaki
6
and Kostas Michalopoulos
3
Abstract
Background: In this work we consider hidden signs (biomarkers) in ongoing EEG activity expressing epileptic
tendency, for otherwise normal brain operation. More specifically, this study considers children with controlled
epilepsy where only a few seizures without complications were noted before starting medication and who showed no
clinical or electrophysiological signs of brain dysfunction. We compare EEG recordings from controlled epileptic
children with age-matched control children under two different operations, an eyes closed rest condition and a
mathematical task. The aim of this study is to develop reliable techniques for the extraction of biomarkers from EEG
that indicate the presence of minor neurophysiological signs in cases where no clinical or significant EEG abnormalities
are observed.
Methods: We compare two different approaches for localizing activity differences and retrieving relevant information
for classifying the two groups. The first approach focuses on power spectrum analysis whereas the second approach
analyzes the functional coupling of cortical assemblies using linear synchronization techniques.
Results: Differences could be detected during the control (rest) task, but not on the more demanding mathematical
task. The spectral markers provide better diagnostic ability than their synchronization counterparts, even though a
combination (or fusion) of both is needed for efficient classification of subjects.
Conclusions: Based on these differences, the study proposes concrete biomarkers that can be used in a decision
support system for clinical validation. Fusion of selected biomarkers in the Theta and Alpha bands resulted in an
increase of the classification score up to 80% during the rest condition. No significant discrimination was achieved
during the performance of a mathematical subtraction task.
Background
Epilepsy is one of the most common neurological disor-
ders in childhood [1]. There are many epidemiological
studies referring to the incidence of seizures. The average
annual rate of new cases per year (incidence) of epilepsy
is approximately 5-7 cases per 10,000 children from birth
to 15 years of age [2] and despite the differences across
studies, it is possible to rate the prevalence of epilepsy in
children as 4-5/1,000. Epilepsy is a complex condition
caused by a variety of pathological processes in the brain.
It is characterized by occasionally (paroxysmal), exces-
sive, and disorderly discharging of neurons that can be
detected by clinical manifestations, EEG recording, or
both.
The diagnosis of epilepsy is mainly clinical. The use of
EEG is also requisite for the diagnosis and the classifica-
tion of epilepsy. Pathophysiologically, there are many the-
ories, based on animal models, about the generation of
the seizures that implicate the excitation and inhibition of
neuronal membranes and the role of some neurotrans-
mitters (i.e. GABA). Generally the prognosis of epilepsy
for remission is good but depends on the underlying
cause. Antiepileptic drugs and surgery can control many
types of epilepsy, but 20-30% of people with epilepsy have
* Correspondence:
1
Biomedical Informatics Lab, Institute of Computer Science, Foundation for
Research and Technology, Heraklion, Greece
Full list of author information is available at the end of the article
Sakkalis et al. Journal of NeuroEngineering and Rehabilitation 2010, 7:24
/>Page 2 of 14
the benign genetic epilepsies that remit without treat-
ment. Although most seizures in children are benign and
result in no long-term consequences, increasing experi-
mental animal data strongly suggest that frequent or pro-
longed seizures in the developing, immature brain result
in long-lasting sequel [3].
Anti-epileptic drug treatments can result in significant
power spectral differences of the epileptic patients when
compared to a control group. Salinsky et. al. [4] and Tuu-
nainen et. al. [5] have both analyzed spectral EEG
changes in adult patients taking AEDs. Salinsky in partic-
ular has considered four occipital EEG measures includ-
ing the peak frequency, median frequency and relative
theta and delta power to analyze a group of patients with
low seizure frequency who were either starting or stop-
ping AED therapy. A set of cognitive tests and a struc-
tured EEG were performed before the change in AED
consumption and 12-16 weeks after. When compared
with a control group, the peak frequency captured differ-
ences in patients stopping or starting AEDs. For those
stopping AEDs, the median frequency and the percentage
theta power also gave significant differences. Similarly,
Tuunainen et. al. captured differences in AED patients
and control subjects. In this case they used the absolute
and relative power as well as the peak power frequency at
left occipital brain lobes as features extracted from a four
second, eyes open, experimental setting. Results showed
that the occipital peak alpha frequency was significantly
lower in patients than in controls. Furthermore, the abso-
lute power of the patient group was significantly higher at
baseline in the control group, over all channels for the
delta, theta, beta and total activity. Absolute alpha power
was also found to be higher but this result was not signifi-
cant.
Cognitive and behavioral changes in children with epi-
lepsy are often encountered and these may be related to
the epilepsy itself, the necessary use of antiepileptic drugs
or a possible surgery, the probable brain dysfunction or
damage associated with the seizures and social and family
reasons [6]. Specifically, there is an association between
attention-deficit/hyperactivity disorder (ADHD) and epi-
lepsy revealed by many studies [7,8] but there are also
other psychiatric disorders more commonly associated
with epilepsy. Depression is considered to be the most
frequent psychiatric disorder in patients with epilepsy
and it is reported that children with epilepsy examined
with the Child Depression Inventory showed elevated
scores for depression [9]. Pellock estimated the preva-
lence of anxiety in children with epilepsy at 16% [10].
There also seems to be an association between autism
and epilepsy in children, but a strong relation between
epilepsy in childhood and aggressive or oppositional
behavior has not been established [11]. Due to the poten-
tial long-lasting effects of epilepsy, it is important to
detect and deal with symptoms as early as possible. To
address this issue, we consider the diagnosis of children
who experienced very few seizures in the past but who
have no psychological findings or notable symptoms and
whose EEG is visually diagnosed by a clinician as being
normal. These children are highly probable to experience
epilepsies in the future. Thus, the aim of this study is to
develop reliable techniques for the extraction of biomark-
ers from EEG that indicate the presence of such con-
trolled epileptic patterns. We compare two different
approaches of localizing activity differences and retriev-
ing relevant information to identify young children hav-
ing controlled epilepsy from their non-epileptic
counterparts. The first approach focuses on power spec-
trum analysis techniques using a signal representation
approach such as Wavelets to elaborate on the differences
in classification results. The second approach focuses on
analyzing the functional coupling of cortical assemblies
using the widely used magnitude squared coherence
(MS-COH) measure and the bivariate autoregressive
(AR) coherence (AR-COH) measure on the actual EEG
signal
Methods
Subjects
The epileptic group under study consists of twenty chil-
dren aged 9-13 (9 boys, 11 girls) children selected from
the pool of Pediatric Neurology outpatient Clinics of two
Hospitals in Heraklion-Crete-Greece, where they were
diagnosed and followed at regular intervals. These chil-
dren, referred to as controlled epileptic, were put under
scrutiny because of their early symptoms but they had no
clinical findings of brain damage or dysfunction and their
EEG was visually normal. They had one or more epileptic
seizures in the past and some of them were under mono-
therapy with drugs in low doses, without clinical side-
effects. Inclusion criteria for patients and controls con-
sisted of: a) age of 9-13 years old b) normal intellectual
potential (assessed with WISC-III) c) absence of neuro-
logical damage-documented by neurological evaluation
for patients and controls and by brain CT and/or MRI
scan for patients and d) absence of psychiatric problems
(based on parent's interview). These children were
treated using common antiepileptic medication (in thera-
peutical doses without clinical side effects) only after they
exhibited at least two seizures. The type of seizures diag-
nosed were the most common ones in childhood (Rolan-
dic epilepsy, idiopathic generalized seizures, focal
secondary generalized seizures without detectable brain
damage and absence seizures). Written informed consent
was obtained from the patients for publication of this
case report and accompanying images. A copy of the
written consent is available for review by the Editor-in-
Chief of this journal.
Sakkalis et al. Journal of NeuroEngineering and Rehabilitation 2010, 7:24
/>Page 3 of 14
Recordings
Continuous EEGs were recorded in an electrically
shielded, sound and light attenuated room while partici-
pants sat in a reclined chair. The EEG signals were
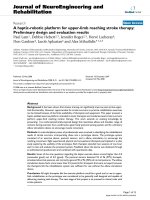
recorded from 30 electrodes placed according to the 10/
20 international system, referred to linked A1+A2 elec-
trodes. This electrode montage is shown in Figure 1. The
signals were amplified using a set of Contact Precision
Instrument amplifiers (Cambridge, MA, USA http://
www.psylab.com), filtered on-line with a band pass
between 0.1 and 200 Hz, and digitized at 400 Hz. Off-line,
the recorded data were carefully reviewed for technical
and biogenic artefacts, so that only artefact free epochs of
10.24s duration are investigated. Artefacts were treated
visually by an expert, since many automated artefact
removal algorithmic methodologies, even if they are suc-
cessful in removing certain types of artefacts, fail to leave
physiological EEG intact. Thus, only pieces without visi-
ble artefacts (EOG, EMG, movements) were preserved.
For each subject only one representative 10.24s epoch is
included in the data. The selection of EEG epochs was
performed blindly by an expert without knowing the
group of each subject. Also the length of the epoch was
chosen as it is short enough to assume stationarity and
from the experience of our clinical lab, this period is
enough for the analysis required [12,13]. The procedures
used in the study had been previously approved by the
University of Crete Institutional Review Board.
Test description
In this study, two different tasks were analyzed. During
the control (passive viewing) task (Task 1) subjects were
at rest and had their eyes fixed on a on a small star dis-
played at the centre of a computer screen to reduce eye
artefacts. The second task was a mathematical task (Task
2) involving the subtraction of two-digit numbers (e.g. 34
- 23, 49 - 32) [14], displayed on an LCD screen located in
front of the participants at a distance of approximately 80
cm, subtending 2-4 degrees of horizontal and 2-3 degrees
of vertical visual angle. Such a mental task is considered
to be difficult for the studied age group. Vertical/horizon-
tal eye movements and blinks were monitored through a
bipolar montage from the supraorbital ridge and the lat-
eral canthus. The analyzed epochs were acquired during
the intensive calculation phase.
Analysis
In this study two different approaches of localizing activ-
ity differences and retrieving relevant information for
classifying the two children groups are compared. Section
(4.1) focuses on power spectrum analysis techniques. In
particular, we elaborate on the differences in classifica-
tion results obtained when using Wavelets, which is a
non-parametric approach that actually achieves an alter-
native signal representation [13]. Section (4.2) focuses on
analyzing the functional coupling of cortical assemblies
using the traditionally formulated but widely used magni-
tude squared coherence (MS-COH) and the coherence
measure applied on a bivariate autoregressive (AR) pro-
cess (AR-COH). Coherence is a normalized measure of
linear dependence between two signals and is capable of
identifying linear synchrony on certain frequency bands
[15,12].
Univariate power spectrum analysis
Features extracted from the time-frequency spectrum
when using Wavelets are compared and their effect on
the classification of the two groups is analyzed, while the
subjects performed the control (rest) task (Task 1) and
math task (Task2). Wavelets derive significant features
encoding brain activity throughout the test period, which
can also be localized in time for the study of abrupt or
transient responses.
Biomarkers are constructed for specific brain regions
(lobes) assuming a preselected lobe scheme that covers
the entire head and is separated in groups of channels
that are expected to function in a similar manner. The
lobes (channel groups) considered are: FL (FP1, F3, F7),
FR (FP2, F4, F8), CL (C3, CP3), CR (C4, CP4), PL (P3, P7),
PR (P4, P8), TL (FT7, T3, TP7), TR (FT8, T4, TP8) and
OL (O1, P7), OR (O2, P8). Furthermore six sequential fre-
Figure 1 Electrode montage consisting of 30 electrodes placed
according to the 10/20 international electrode placement sys-
tem.
Sakkalis et al. Journal of NeuroEngineering and Rehabilitation 2010, 7:24
/>Page 4 of 14
quency bands were considered in this analysis: delta (0-4
Hz), theta (4-8 Hz), alpha (8-13 Hz), beta (13-30 Hz),
gamma1 (30-45 Hz) and gamma2 (45-90 Hz).
Wavelet transform (WT)
The WT has developed into an important tool for analy-
sis of time series that contain non-stationary power at
many different frequencies (such as the EEG signal), and
it has proved to be a powerful feature extraction method
[16]. The epileptic recruitment rhythm during seizure
development is well described in terms of relative wavelet
energies [17]. The WT as compared to the FFT is more
suitable for analyzing transient signals because both fre-
quency (scales) and time information can be obtained in
good resolution.
The continuous wavelet transform (CWT) was pre-
ferred in this work, so that the time and scale parameters
can be considered as continuous variables. In the CWT
the notion of scale s is introduced as an alternative to fre-
quency, leading to the so-called time-scale representa-
tion. The CWT of a discrete sequence x
n
with time
spacing δt and N data points (n = 0,1, , N-1) is defined as
the convolution of x
n
with consecutive scaled and trans-
lated versions of the wavelet function ψ
0
(η):
where s, η and ω
0
indicate scale, non-dimensional "time"
and "frequency" parameters, respectively and . In
our application, ψ
0
(η) describes the most commonly used
wavelet type for spectral analyses, i.e., the normalized
complex Morlet wavelet as given in (2). The frequency
parameter ω
0
is selected equal to 6 since it is a good trade-
off between time and frequency localization for the Mor-
let wavelet. The wavelet function ψ
0
is a normalized ver-
sion of ψ that has unit energy at each scale, so that each
scale is directly comparable to each other. There exists a
concrete relationship between each scale s and an equiva-
lent spectral frequency f, which for the Morlet wavelet is
given by f = 1/(1.03 s) [18], so that scales can be mapped
to frequency bands [13]. Thus, we can obtain the power
spectrum of WT at specific frequency-scale s for each
channel c, through the time-scale-averaged power spec-
trum . The corresponding biomarkers for each sub-
ject are obtained for each brain lobe l (which includes
specific channels) and band B (which includes several
scales), can then be computed as:
where c
l
represents the set of channels within each lobe
l and s
B
the number of frequency bins in band B. Notice
that in the power measure we use the dB value.
Bivariate synchronization analysis
In this study we also employ a methodology towards
investigating the capabilities of linear measures in reveal-
ing the coupling between EEG channels in real band-lim-
ited signals. Synchronous oscillations of certain types of
such assemblies in different frequency bands relate to dif-
ferent perceptual, motor or cognitive states and may be
indicative of a wider range of cognitive functions or brain
pathologies [19,20]. Hence, in the bivariate case we con-
sidered the MS-COH and the AR-COH measures and
applied them in classifying the two subject groups, in the
same analysis scheme as described in Section 3.1 for the
univariate case. In this case a synchronization value is
calculated between a selected pair of electrodes resulting
in bivariate measures that can be treated similarly to the
ones in the univariate case. Once the additional synchro-
nization features are calculated they are fed to the classi-
fier to discriminate between the two subject groups.
Magnitude squared (MS-COH) and AR coherence (AR-COH)
For the time series x
n
and y
n
, n = 1 N, where x, y repre-
sent pairs of channels, the well-known expression of the
Magnitude Squared Coherence (MS-COH) is given by:
where f denotes frequency, S
xy
denotes the cross spec-
tral density function, while S
xx
and S
yy
are the individual
autospectral density functions for x and y, respectively
[15]. To compute the MS-COH with nonparametric
methods, we use the Welch's periodogram smoother,
with a non-overlapping Hamming window of 1024 sam-
ples length. In the formula above, we employ the notation
Ό· to emphasize that window averaging is applied. Note
that MS-COH for a given frequency f ranges between 0
Ws x ts n nts
nn
n
N
() ( / ) [( ) / ]
*
=
′
−
′
′
=
−
∑
dy d
1
2
0
0
1
(1)
yh p
w
h
h
0
14 2
0
2
()
//
=
−
−
−
ee
i
(2)
i =−1
W
sc
,
2
w
Bl
c
l
s
B
W
sc
s
s
c
c
B
l
,
log
,
=+
=
∑∑
⎛
⎝
⎜
⎜
⎞
⎠
⎟
⎟
=
11
10
1
2
1
1
(3)
g
xy
f
S
xy
f
S
xx
fS
yy
f
()
()
() ()
=
2
(4)
Sakkalis et al. Journal of NeuroEngineering and Rehabilitation 2010, 7:24
/>Page 5 of 14
(no coupling) and 1 (maximum linear interdependence).
For each brain lobe l and band B the MS-COH (γ
B, l
) can
be defined as the average of eq. 4, for x, y within the spe-
cific lobe and f within the specific band.
The linear dependence between the signals x and y can
be modeled by a bivariate autoregressive (AR) process of
order m. Let Z
n
= [x
n
y
n
]
T
for 1 ≤ n ≤ N and z
n
= [0 0]
T
for n
< 1, with the convention that
T
denotes transposition.
Then we have z
n
= -A
1
z
n-1
- ʜ- A
m
z
n-m
+ e
n
where the
entries of the 2 × 2 matrices A
1
, , A
m
are real-valued.
The residuals e
n
are temporally uncorrelated and their
covariance matrix is denoted Q
m
. The bivariate AR model
leads to the following factorization of the spectral matrix
[21]:
where i
2
= -1, A
0
is the identity matrix and the symbol *
is used for conjugate transpose. For example, MS-COH
can be readily computed, and we use the name AR-COH
whenever the evaluation of the MS-COH is based on the
spectral matrix factorization. A detailed description of
algorithms for estimating A
1
, , A
m
and Q
m
, which are
defined for specific x, y and f from EEG data, can be
found [22]. The results reported in Section 4.2 have been
obtained with the Whittle-Wiggins-Robinson estimation
method [23,24]. The order of the autoregressions was
selected from {1, , 50} by applying the Minimum
Description Length criterion [25]:
The band and lobe specific measure is defined similar
to the corresponding MS-COH measure (i.e. γ
B, l
). The
MS-COH and AR-COH synchronization values ranging
from 0 to 1 are used as biomarkers in the bivariate case
and are calculated for each brain region (lobe) assuming
again a preselected lobe scheme that contain grouped
channel pairs instead of single channels. The lobes (chan-
nel pair groups) for the bivariate case are: OPL (O1-P3,
O1-P7, P7-P3), OPR (O2-P4, O2-P8, P8-P4), CPL (CP3-
P3, C3-CP3, P3-P7), CPR (CP4-P4, C4-CP4, P4-P8) FTL
(FP1-F7, FP1-F3, FT7-T3, FT7-TP7, T3-TP7), FTR (FP2-
F8, FP2-F4, FT8-T4, FT8-TP8, T4-TP8), TL (FT7-T3, T3-
TP7, FT7-TP7), TR (FT8-T4, T4-TP8, FT8-TP8).
Feature Selection and Classification
This study proposes a statistical method for mining the
most significant lobes using the available biomarkers,
resembling the way many clinical neurophysiological
studies evaluate the brain activation patterns. Since the
goal is to find significant differences between two groups,
the independent two-sample t-test is used to assess
whether the means of the two groups are statistically dif-
ferent from each other. As a parametric test it assumes
that: i) data comes from normally distributed popula-
tions, ii) data is measured at least at the interval level, iii)
variances of the populations involved are homogenous
and iv) all observations are mutually independent [26]. In
this analysis, the feature vectors for control subjects (F
C
)
and for epileptic subjects (F
E
) consist of the biomarkers
M
B, l
which are the log-transformed values of the power
(univariate case) or the synchronization values (bivariate
case) within a specific frequency band B for a particular
lobe l. Thus, the feature vectors are formed as:
where or represents the set of biomarker for
control or epilepsy subject i (Ci or Ei), within frequency
band B, and for a particular lobe l. In our application, the
number of bands B ranges from one to six and the num-
ber of lobes l ranges from one to ten. These feature vec-
tors can be defined for the various forms of biomarkers
(wavelet power, MS-COH and AR-COH) defined above,
or for combinations of measures. By using the D'Agostino
Pearson test [26] or Kolmogorov-Smirnov's test [26], the
features were found to have a normal distribution, thus
satisfying assumption (i). Distance between points along
the scale of the possible feature values was equal at all
parts of the scale, thus ensuring that data is measured at
least at the interval level (assumption (ii)). Homogeneity
of variances was tested using Levene's test based on the
F-statistic [26] and in this case it was found that the fea-
tures from the two groups did not have equal variances.
As this violates one of the above assumptions, the t-test
had to be applied assuming unequal variances (Behrens-
Fisher problem). Finally, since the biomarkers in F
C
and F
E
are coming from two independent groups (controls and
epileptics) assumption (iv) is reasonable.
S
xx
fS
xy
f
S
yx
fS
yy
f
k
k
m
ikf
m
e
() ()
() ()
⎡
⎣
⎢
⎤
⎦
⎥
⎛
⎝
⎜
⎜
⎞
⎠
⎟
⎟
=
=
−
−
∑
AQA
0
2
1
p
kk
k
m
ikf
e
=
−
−
∑
⎛
⎝
⎜
⎜
⎞
⎠
⎟
⎟
⎡
⎣
⎢
⎢
⎤
⎦
⎥
⎥
0
2
1
p
*
(
5
)
mf
N
N
xy
m
m
m
∧
=+
()
⎡
⎣
⎢
⎤
⎦
⎥
()
ln
arg min ln det Q 4
(6)
FMM M
CBl
C
Bl
C
Bl
C
=
⎡
⎣
⎤
⎦
,, ,
,,,
12 20
…
(7)
FMM M
EBl
E
Bl
E
Bl
E
=
⎡
⎣
⎤
⎦
,, ,
,,,
12 20
…
(8)
M
Bl
Ci
,
M
Bl
Ei
,
Sakkalis et al. Journal of NeuroEngineering and Rehabilitation 2010, 7:24
/>Page 6 of 14
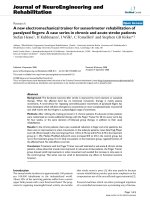
Figure 2 Topographic maps showing the p-values of WT power differences between control and epilepsy subjects for Task 1 and Task 2.
The black dots in each image represent the channel locations. Lower p-values are indicated in shades of blue while p-values close to the threshold of
0.1 are indicated in shades of red. Blank areas within each topographic map indicate that the features extracted from that particular lobe do not give
significant differences between the two populations (p > 0.1).
Figure 3 Classification scores, Sensitivity and Specificity using WT features: Results for Task 1.
Sakkalis et al. Journal of NeuroEngineering and Rehabilitation 2010, 7:24
/>Page 7 of 14
This statistical analysis technique was used to identify
which lobes and frequency bands give significant differ-
ences between the epileptic subject group and the control
group for both the signal representation approach and
the signal modelling approach in the univariate and
bivariate cases.
Once the features were available, classification was per-
formed using a simple linear discriminant analysis (LDA)
classifier with the leave-one-out validation approach.
This means that one subject was tested while all the rest
were used for training. In the results section we give the
classification scores for the respective frequency bands
and brain lobes to identify the number of correctly classi-
fied subjects out of the total population of 40 children.
Apart from this the corresponding sensitivity and speci-
ficity measures are provided.
Results
Univariate power spectrum analysis
The WT was applied to the real EEG data, where each
signal was initially set to zero mean and unit variance. In
each case, we compute the lobe/band significance, as well
as the corresponding classification scores with sensitiv-
ity-specificity measures. Figure 2 illustrates the topo-
graphic maps of the p-values between the two groups,
obtained for each task and frequency band. Cells which
have been left blank indicate no significant difference at
the 90% confidence interval (p > 0.1). Shaded brain lobes
represent a p-value ranging from 0.01 to 0.1, with shades
of blue indicating the lowest p-values. These topographic
maps show clearly that for the control task (Task 1) few
brain areas have been identified by Wavelets to give sig-
nificant differences between the two groups. The Wavelet
approach detected significant differences in the left fron-
tal lobe of the Alpha band only. Since frontal channels
may easily be affected by eye movements, this result may
be purely sporadic. Differences in the Alpha band are
expected, since the Rolandic EEG rhythms at rest are
dominated by Alpha and Beta activity [27].
However, for Task 2 the WT succeeds in identifying
significant spectral differences within the frontal left
lobes of Alpha and Gamma2 band and central lobes of the
Alpha band. Alterations in the Alpha band are also
expected since they are generally associated with prob-
lems in attention and episodic memory [28]. For higher
frequency bands WT found low significant differences in
left frontal areas. Differences at higher frequencies, par-
ticularly in the gamma bands, for such a cognitive task is
probably related to the task complexity itself [29].
The classification scores (percentage correct) and sen-
sitivity-specificity measures for both Task 1 and 2, are
shown in the form of bar graphs in Figures 3 and 4. A lin-
ear discriminant analysis (LDA) classifier with the leave-
one-out evaluation scheme was implemented to derive
the number of correctly classified subjects. In this case 39
out of a total of 40 children available were used for train-
ing while the remaining subject was then used in the test-
ing process. The plots show that the spectral biomarkers
for Task 1 result in classification scores close to 60%. The
most consistent result across the different brain regions,
for WT, occurred for the Theta and Alpha bands with the
exception of the score over the right temporal brain
region which fell well below chance level. The bar graphs
also show that overall the Gamma1 band was consistent,
as well.
For Task 2, the classification scores are more sporadic
than those obtained for Task 1. The most stable result
across the different brain lobes was obtained for the
Alpha band (where the highest score of 72.5% was
achieved) and the Beta band over the frontal lobe. For the
Gamma bands, WT also obtained relatively stable scores
over the parietal and occipital brain areas, but as shown
in the topographic maps earlier, the occipito-parietal dif-
ferences at these sites were not significant.
Bivariate synchronization analysis
The MS-COH and AR-COH measures are computed on
both "normal" and "controlled-epileptic" band-filtered
data (using a fourth order zero-phase shift bandpass But-
terworth filter). Similar to the results of the previous sec-
tion, the classification scores and sensitivity-specificity
measures for MS-COH and AR-COH, for Tasks 1 and 2
are shown in the form of bar graphs in Figures 5 and 6,
respectively. The plots show that the maximum classifica-
tion score achieved for Task 1 was in the Gamma2 band
for the occipito-parietal lobes (OPL, OPR), where 72.5%
classification was reached (MS-COH). For Task 2, the
maximum classification score achieved was 65% (MS-
COH) in CPL - Beta band and OPL - Gamma2 band.
Even if this score is low, a general trend observed in Fig-
ures 5 and 6 is that the central-parietal (CPL-CPR) and
occipito-parietal (OPL-OPR) lobes achieve overall better
scores. As a final step towards a better classification
result for Task 2, we considered fusing selected biomark-
ers from the univariate and the bivariate case (see section
3.3.3). Finally, it should be noted that nonlinear measures
(phase and generalized synchronization) were also tested
but not included in this paper since they were not able to
identify any statistically significant differences.
Selection of biomarkers
Biomarkers based on WT
As discussed previously, WT derives good classification
estimates for feature selection in Task 1. This task oper-
ates similar to [19] in an "eyes open" scheme. Attempting
a comparison with this previous work, in Figure 7 we
illustrate the WT biomarkers averaged over the 20 epilep-
Sakkalis et al. Journal of NeuroEngineering and Rehabilitation 2010, 7:24
/>Page 8 of 14
tic and 20 control children respectively across different
frequency bands and brain regions.
For controlled epileptic children our analysis derives
consistent higher energy in the Theta and Alpha bands,
as well as a symmetrical energy variation pattern in Delta,
Theta, Alpha and Beta bands. This result is in line with
earlier studies [19,30], which found an increase in delta-
theta ranges (3-7 Hz) and upper Alpha-lower Beta ranges
(15-17 Hz) in patients with partial and generalized epi-
lepsies. From this relation and the significant areas
derived by WT analysis, we select Theta-Alpha band
activity on central and temporal channels (TL, TR, CL
and CR) for further analysis of our results from univariate
analysis. In Table 1 we analyze the spectral biomarkers of
the two groups for Task 1. Specifically, the table presents
the average and the standard deviation values of the bio-
markers across the analyzed brain lobes, for the epileptics
and controls, respectively. Results for each of the six fre-
quency bands are tabulated. These results verify that on
average, the epileptic children had significantly higher
spectral biomarkers, especially on the Theta and Alpha
bands where the difference is shown to be the most sig-
nificant (p < 0.5).
The largest difference occurred within the Alpha band,
as was expected for a child group where the spectral peak
may also spread into the theta band, since in children dif-
ferent frequency bands are not yet functionally differenti-
ated and separated from the broad alpha frequency range
and, thus responds more in an alpha-like way [31]. Rela-
tive to an age matched control group, epileptic patients
between 9 and 11 years analyzed in [32] have also shown
an increase in theta and alpha power.
When considering the mathematical subtraction Task 2
the most significant bands (Table 2) are Theta, Beta and
Gamma2. In comparison with the rest Task 1 in each
group, we would expect to find increased power activity
in Gamma as well as Alpha frequency bands. There is
extensive evidence that neural oscillations increasing
power in the Gamma band are involved in the visual per-
ception of objects and correlate with cognitive task
assignments [29,33]. Furthermore, children with epilepsy
have been reported to reflect alterations in the Theta
Figure 4 Classification scores, Sensitivity and Specificity using WT features: Results for Task 2.
Sakkalis et al. Journal of NeuroEngineering and Rehabilitation 2010, 7:24
/>Page 9 of 14
band in tasks associated with attention and episodic
memory [28]. Considering the derived classification esti-
mates for Task 2, we also find evidence of differences in
these bands through the WT analysis. In Section 3.3.3 we
further consider fusion of biomarkers in an attempt to
increase the overall discrimination ability.
Biomarkers based on synchronization measures
For both tasks the synchronization measures lead to
slightly inferior classification estimates compared with
the univariate (power) measure. Thus, the selection of
synchronization measures for further consideration has
been associated with that of power measures and also
directed by the existing literature. In general MS-COH
appears more efficient than AR-COH in exemplifying
small differences. Task 1 does not indicate any significant
difference between the two studied groups, based on MS-
COH. In association with the selection of WT features in
Section 3.3.1, we further consider synchronization mea-
sures in the Theta and Alpha bands (Table 1, p < 0.5),
with the aim of exploring the fusion of both power and
synchronization biomarkers in enhancing classification
scores (Section 3.3.3).
For the cognitive (subtraction) process in Task 2, we
would expect some increased synchronization especially
in the gamma band, where synchronous localized and/or
broadband rhythmic bursting in assemblies of neurons
are associated with several consciousness processes [29]
and present increased activity in people with partial or
generalized epilepsy [19]. In our analysis (Figure 6), dif-
ferences in classification scores based on synchronization
are low and insignificant. Further analysis based on aver-
age measures per group has been performed on lobes
expressing the highest classification scores. More specifi-
cally, Table 2 summarizes the average biomarkers for
both the epileptic and control groups in all six frequency
bands for a lobe subset consisting of CPL, CPR, OPL and
Figure 5 Classification scores, Sensitivity and Specificity results using MS-COH and AR-COH features: Results for Task 1.
Sakkalis et al. Journal of NeuroEngineering and Rehabilitation 2010, 7:24
/>Page 10 of 14
OPR. The results show that the biomarker values for the
two groups are close to each other and hence not signifi-
cant. From Table 2, the highest p-value for discrimination
is achieved in the higher Gamma band, followed by the
Beta band. The latter also gives better overall classifica-
tion scores in Figure 6. There is further evidence of the
involvement of the Beta band in cognitive tasks in a way
similar to that of Gamma band, however with weaker
enhancement of activity [29]. Thus, even though on its
own MS-COH fails to distinguish between the epileptic
and control children, we further consider the Beta band
at lobes CPL, CPR, OPL and OPR for further consider-
ation in a fusion strategy along with power measures, as
described in the next section.
Decision support for controlled epilepsy based on EEG
biomarkers
In order to summarize the above results in the decision
framework and use potential biomarkers in such a way as
to increase differentiation between the two groups, we
consider a fusion scheme for the available features. Task 1
and Task 2 were considered separately, in order to involve
the most prominent features as biomarkers in each case.
Fusion tests were performed on three sets of features:
power (WT) features only, MS-COH features only and a
combination of power and MS-COH features. Four sim-
ple fusion operators were tested as follows:
1 A Linear Discriminant Classifier (LDC) applied to
the average of all selected features
2 A majority vote function applied on the classifica-
tion outcomes of selected biomarkers. This decision
function selects the class label based on which of the
available classes (epileptic or normal) gets more than
half the votes.
3 A weighted sum of individual classification scores.
4 The MINDIST Algorithm which calculates the least
squares distance to the average of features inside each
Figure 6 Classification scores, Sensitivity and Specificity using MS-COH and AR-COH features: Results for Task 2.
Sakkalis et al. Journal of NeuroEngineering and Rehabilitation 2010, 7:24
/>Page 11 of 14
known class, i.e. epileptic or normal and assigns a
label based on that class with the minimum distance.
For Task 1, the individual classification scores obtained
from specific lobes and frequency bands are not satisfac-
tory. Across all lobes, the best results obtained are those
for WT, with an average classification score of 54.5%,
54.3% and 49% across the Alpha, Gamma1 and Theta
bands respectively. Over the same bands MS-COH
obtained classification scores of 46.6% and 56%. Based on
these results and in an attempt to also relate with the
widespread distribution of differences derived in [19]
between epileptics and controls during the eyes-open,
rest state, we included in a fusion scheme features from
WT and MS-COH analysis related to the theta and alpha
bands. When considering a total of 10 features, 7 from
the WT approach (FL, FR, CR, OL from the theta band
and FL, PL, OL from the alpha band) and 3 features from
the MS-COH approach (FTR, OPL from the Theta band
Figure 7 Averaged WT biomarkers across the 20 epileptic and 20 control subjects, for each frequency band and brain lobe considered.
Table 1: Average WT Biomarker Values of lobes (TL, TR, CL, CR) for Task 1.
Epileptics Controls p-values
Delta 3.98 ± 0.24 3.97 ± 0.31 0.94
Theta 3.76 ± 0.28 3.70 ± 0.20 0.45
Alpha 3.68 ± 0.29 3.57 ± 0.24 0.20
Beta 3.50 ± 0.19 3.49 ± 0.19 0.80
Gamma1 2.80 ± 0.22 2.80 ± 0.21 0.94
Gamma2 3.19 ± 0.17 3.20 ± 0.21 0.94
Sakkalis et al. Journal of NeuroEngineering and Rehabilitation 2010, 7:24
/>Page 12 of 14
and OPR from the Alpha band), the best classification
score reached 65% with a sensitivity and specificity mea-
sure of 70% and 60% respectively (Table 3). The choice of
features was based on the criteria of highest individuals
and specificity/sensitivity measures higher than 50%.
Although this fusion result shows a slight improvement
over individual features, the classification is still reason-
ably low. A further rigorous feature selection process
resulted in five specific features to be fused, two WT fea-
tures (FL and PL from the Alpha band) and three MS-
COH (FTR, OPL from the Theta band and OPR from the
Alpha band. These gave a score of 80% (Table 3) which is
now superior to the 65% obtained earlier. This result
shows that fusion of features in the Theta-Alpha bands
can yield significant improvements in classification
scores over individual scores. Hence, this is our proposed
strategy for designing a decision support system that can
efficiently detect particular characteristics of children
with epilepsy.
For Task 2, the individual classification scores obtained
from specific lobes and frequency bands are even lower.
Across all lobes and frequency bands, the best results
obtained are those for Wavelets, with an average classifi-
cation score of 54% and those for MS-COH with an aver-
age classification score of 47%. We further explored the
potential of fusing biomarkers in order to increase the
discrimination ability. A total of 20 features were selected,
16 features from the WT approach (alpha: PL, OL, OR;
beta: CL, PL, OL; gamma1: CL, CR, PL, PR, OL, OR;
gamma2: PL, PR, OL, OR) and 4 features from the MS-
COH approach (beta: CPL, CPR, OPL, OPR). The selec-
tion of these features was based on the best classification
scores and sensitivity or specificity measure higher than
50%. The results obtained when applying these operators
to the various feature sets for Task 2 are shown in Table 4.
The highest classification scores for the WT features
reached 70% which is still lower than the 72.5% score
obtained by WT over lobe FL for the alpha band. The
results for the MS-COH features yield even lower scores.
Finally, when univariate and bivariate features were com-
bined a score of 70% was once again achieved. Overall,
fusion of features did not result in any significant
improvement in classification scores over the individual
scores achieved for Task 2. Thus no biomarker was found
to reliably discriminate between the two groups while the
subjects are performing this mathematical task. Never-
Table 2: Average MS-COH Biomarker Values of lobes (CPL, CPR, OPL, OPR) for Task 2.
Epileptics Controls p-values
Delta 0.76 ± 0.10 0.74 ± 0.11 0.57
Theta 0.71 ± 0.12 0.68 ± 0.11 0.44
Alpha 0.69 ± 0.12 0.69 ± 0.09 0.89
Beta 0.69 ± 0.10 0.66 ± 0.13 0.34
Gamma1 0.72 ± 0.15 0.72 ± 0.10 0.97
Gamma2 0.73 ± 0.11 0.77 ± 0.07 0.16
Table 3: Task 1: Best Results of fusion based on selected features from WT + MS-COH.
Fusion operator Sensitivity Specificity Classification score
WT+ MS-COH (# of features: 10) LDC on Average 70% 60% 65%
WT + MS-COH (# of features: 5) Majority Vote 80% 80% 80%
WT + MS-COH (# of features: 29 All WT with scores ≥57.5 + all with scores
≥ 57.5 from MS-COH)
Majority Vote 60% 70% 65%
WT + MS-COH symmetric combination choice based on High
classification score (non algorithmic choice) WT: FL, FR, PL, PR MS-COH:
OPL, OPR
LDC on Average 80% 50% 65%
Sakkalis et al. Journal of NeuroEngineering and Rehabilitation 2010, 7:24
/>Page 13 of 14
theless, a related work reported during the review process
of this paper reveals that other auditory tasks related to
episodic memory have shown potential in classifying a
group of children with mild signs of epilepsy [28]. Thus, a
more rigorous consideration of various tasks should be
performed towards the design of a decision support sys-
tem, which can reflect wider aspects on the performance
of children with epilepsy.
Discussion and Conclusion
This work considers methods for the discrimination of a
controlled epileptic child group and an age-matched con-
trol group. The children considered in this analysis are at
an age range where maturing is not drastic and education
is not significantly different. Thus, we expect only small
differences due to age. The experiment is in a matched
controls scheme where we have same numbers in the two
groups in terms of age, sex and education. The studied
population of controlled epileptic children does not show
clinical dysfunction or other EEG abnormalities. We are
using sensitive methods of analysis in order to search for
signs of differences from age-matched controls. Such
signs are indicative of slight neurophysiological distur-
bances that are not obvious in usual neuropsychological
tests and electrophysiological EEG recordings. Even
though these disturbances are not considered serious, the
children need to follow a certain course of therapy and
follow-up in order to restrict their effects.
Our first aim was to check whether controlled-epileptic
children exhibit spectral differences in their EEGs in
comparison to an age-matched control group during a
control situation and while performing a mental task.
Secondly, we address the development of sensitive and
reliable measures for discrimination between the two
groups by means of either power spectrum univariate
measures or bivariate synchronization measures of dif-
ferent brain regions or both. The latter stems from the
fact that neuronal dynamics and synchronization phe-
nomena have been increasingly recognized to be impor-
tant mechanisms by which specialized cortical and sub-
cortical regions integrate their activity to form distrib-
uted neuronal assemblies that function in a cooperative
manner [34]. According to our knowledge, such an inte-
grated analysis has not been carried out so far.
Clinical and psychological examinations, as well as
visual EEG inspection, do not provide any information
leading to differences. On the original EEG data we apply
two types of methodologies, one based on the power
spectrum using direct signal representation (through
wavelets), and the other on capturing the coupling of dif-
ferent lobes using linear synchronization indexes (MS-
COH and AR-COH). The extracted features in each lobe
and band are examined through significance tests, classi-
fication accuracies and statistical distributions of bio-
markers.
The results of this paper indicate that univariate Wave-
let analysis, as well as bivariate synchronization analysis
based on MS-COH, can provide different features for dis-
crimination. Thus, such methods could be used in a com-
plementary manner towards the design of a decision
support system aimed at detailed neurophysiological
assessment. Fusion of selected biomarkers in the Alpha
bands resulted in an increase of the classification score up
to 80% (Table 3) during the rest condition. No better dis-
crimination (70%-Table 4) was achieved during the per-
formance of a cognitive subtraction task. Other recent
studies have illustrated discrimination during tests trig-
gering episodic memory. These results, however, need
further investigation, particularly on a larger dataset and
follow-up of many years, to be able to state concretely
Table 4: Task 2: Best Results of fusion based on selected features from WT, MS-COH and WT + MS-COH.
Fusion operator Sensitivity Specificity Classification score
WT (# of features: 16) LDC on Average 80% 60% 70%
Majority Vote 65% 65% 65%
Weighted Sum 70% 60% 65%
MINDIST 80% 60% 70%
MS-COH (# of features: 4) LDC on Average 60% 50% 55%
Majority Vote 55% 75% 65%
WT + MS-COH (# of features: 20) Mindist (WT) or MajorityVote (MS-COH) 80% 60% 70%
Sakkalis et al. Journal of NeuroEngineering and Rehabilitation 2010, 7:24
/>Page 14 of 14
which brain areas and frequency bands can best assess
slight brain dysfunction in cases of controlled epilepsy
and perhaps in other disturbances of neurophysiological
origin.
Competing interests
The authors declare that they have no competing interests.
Authors' contributions
VS, TC and MZ were responsible for the design of the study and writing down
the manuscript. VS, TC and MZ, CDG conducted the univariate and bivariate
analysis, respectively. VS, TC and CB conducted the feature selection, classifica-
tion and classifier fusion processes, respectively. SM and EK conducted data
acquisition and interpretation. KPC and SGF helped to draft the manuscript. TC
and KM worked on the charts and illustrations creation. All authors read and
approved the final manuscript.
Acknowledgements
This work was supported in part by the EC-IST project Biopattern, contract no:
508803, by the EC ICT project TUMOR, contract no: 247754, by the University of
Malta grant LBA-73-695, by an internal grant from the Technical University of
Crete, ELKE# 80037 and by the Academy of Finland, project nos: 113572,
118355, 134767 and 213462.
Author Details
1
Biomedical Informatics Lab, Institute of Computer Science, Foundation for
Research and Technology, Heraklion, Greece,
2
iBERG, Department of Systems
and Control Engineering, Faculty of Engineering, University of Malta, Msida,
Malta,
3
Department of Electronic and Computer Engineering, Technical
University of Crete Chania, Greece,
4
Department of Signal Processing, Tampere
University of Technology, Tampere, Finland,
5
Ecological University of Bucharest,
Romania and
6
Clinical Neurophysiology Laboratory (L. Widen), Faculty of
Medicine, University of Crete, Heraklion, Greece
References
1. Shinnar S, Pellock JM: Update on the Epidemiology and Prognosis of
Pediatric Epilepsies. J Child Neurol 2002, 17(1):S4-17.
2. Cowan LD: The epidemiology of the epilepsies in children. Ment Retard
Dev Disabil Res Rev 2002, 8:171-81.
3. Ben-Ari Y, Holmes GL: Effects of seizures on developmental processes in
the immature brain. The Lancet Neurology 2006, 5:1055-63.
4. Salinsky MC, Oken BS, Storzbach D, Dodrill CB: Assessment of CNS effects
of antiepileptic drugs by using quantitative EEG measures. Epilepsia
2003, 44(8):1042-1050.
5. Tuunainen A, Nousiainen U, Pilke A, Mervaala E, Partanen J, Riekkinen P:
Spectral EEG during short term discontinuation of antiepileptic
medication in partial epilepsy. Epilepsia 1995, 36(8):817-823.
6. Cornaggia CM, Beghi M, Provenzi M, Beghi E: Correlation between
Cognition and Behavior in Epilepsy. Epilepsia 2006, 47(Suppl 2):34-39.
7. Semrud-Clikeman M, Wical B: Components of attention in children with
complex partial seizures with and without ADHD. Epilepsia 1999,
40:211-215.
8. McDermott S, Mani S, Krishnaswami S: A population-based analysis of
specific behavior problems associated with childhood seizures. J
Epilepsy 1995, 8:110-118.
9. Ettinger AB, Weisbrot DM, Nolan EE, Gadow KD, Vitale SA, Andriola MR,
Lenn NJ, Novak GP, Hermann BP: Symptoms of depression and anxiety
in pediatric epilepsy patients. Epilepsia 1998, 39:595-599.
10. Pellock J: Understanding co-morbidities affecting children with
epilepsy. Neurology 2004, 62:S17-23.
11. Dunn DW: Neuropsychiatric aspects of epilepsy in children. Epilepsy &
Behavior 2003, 4:101-106.
12. Micheloyannis S, Sakkalis V, Vourkas M, Stam CJ, Simos PG: Cortical
networks involved in mathematical thinking: Evidence from linear and
non-linear cortical synchronization of electrical activity. Neuroscience
Letters 2005, 373:212-217.
13. Sakkalis V, Cassar T, Zervakis M, Camilleri KP, Fabri SG, Bigan C,
Karakonstantaki E, Micheloyannis S: Time-Frequency Analysis and
Modelling of EEGs for the evaluation of EEG activity in Young Children
with controlled epilepsy. Comput Intel Neurosc (CIN) 2008. doi: 10.1155/
2008/462593
14. Von Aster M, Weinhold M: Neuropsychologische Testbatterie für
Zahlenverarbeitung und Rechnen bei Kindern (ZAREKI). Mannedorf:
Swets Test Services 2002.
15. Ford M, Goethe J, Dekker D: EEG coherence and power changes during a
continuous movement task. Int J Psychophysiol 1986, 4:99-110.
16. Sakkalis V, Zervakis M, Micheloyannis S: Significant EEG features involved
in mathematical reasoning: evidence from wavelet analysis. Brain
Topography 2006, 19:53-60.
17. Rosso OA, Martin MT, Figliola A, Keller K, Plastino A: EEG analysis using
wavelet-based information tools. J Neurosci Methods 2006, 153:163-182.
18. Torrence C, Compo GP: A practical Guide to Wavelet Analysis. Bull Am
Meteorol Soc 1998, 79:61-78.
19. Willoughby JO, Fitzgibbon SP, Pope KJ, Mackenzie L, Medvedev AV, Clark
CR, Davey MP, Wilcox RA: Persistent abnormality detected in the non-
ictal electroencephalogram in primary generalised epilepsy. Journal of
Neurology, Neurosurgery, and Psychiatry 2003, 74(1):51-55.
20. Larsson PG, Kostov H: Lower frequency variability in the alpha activity in
EEG among patients with epilepsy. Clinical Neurophysiology 2005,
116:2701-2706.
21. Brovelli A, Ding M, Ledberg A, Chen Y, Nakamura R, Bressler SL: Beta
oscillations in a large-scale sensorimotor cortical network: directional
influences revealed by Granger causality. Proc Natl Acad Sci USA 2004,
101(26):9849-9854.
22. Sakkalis V, Giurcăneanu CD, Xanthopoulos P, Zervakis M, Tsiaras V, Yang Y,
Micheloyannis S: Assessment of linear and nonlinear synchronization
measures for analyzing EEG in a mild epileptic paradigm. IEEE Trans Inf
Tech 2009, 13(4):433-441. (DOI: 10.1109/TITB.2008.923141)
23. Whittle P: On the fitting of multivariate autoregressions and the
approximate canonical factorization of a spectral density matrix.
Biometrika 1963, 50:129-134.
24. Wiggins R, Robinson E: Recursive solution to the multichannel filtering
problem. J Geophysical Research 1966, 70:1885-1891.
25. Rissanen J: Modeling by shortest data description. Automatica 1978,
14:465-471.
26. Zar JH: Biostatistical Analysis. New Jersey USA: Prentice-Hall; 1999.
27. Lee PL, Wu YT, Chen LF, Chen YS, Cheng CM, Yeh TC, Ho LT, Chang MS,
Hsieh JC: ICA-based spatiotemporal approach for single-trial analysis of
postmovement MEG beta synchronization. Neuroimage 2003,
20:2010-1030.
28. Krause CM, Boman PA, Sillanmäki L, Varho T, Holopainen IE: Brain
Oscillatory EEG event-related desynchronization (ERD) and -
synchronization (ERS) responses during an auditory memory task are
altered in children with epilepsy. Seizure 2008, 17:1-10.
29. Fitzgibbon SP, Pope KJ, Mackenzie L, Clark CR, Willoughby JO: Cognitive
tasks augment gamma EEG power. Clinical Neurophysiology 2004,
115:1802-1809.
30. Miyauchi T, Endo K, Yamaguchi T, Hagimoto H: Computerized Analysis of
EEG Background Activity in Epileptic Patients. Epilepsia 1991,
32(6):870-881.
31. Klimesch W: EEG alpha and theta oscillations reflect cognitive and
memory performance: a review and analysis. Brain Research Reviews
1999, 29:169-195.
32. Martin-Fiori EM: Thalamo-cortical oscillation during brain development
and in epilepsy. Web presentation of a project funded by University
Children's Hospital, Olga-Mayenfisch Foundation [http://
www.forschungsportal.ch/unizh/media/pdf/p8421.pdf].
33. Keil A, Müller M, Ray WJ, Gruber T, Elbert T: Human Gamma Band Activity
and Perception of a Gestalt. The Journal of Neuroscience 1999,
19(16):7152-7161.
34. Olesen J, Baker MG, Freund T, Di Luca M, Mendlewicz J, Ragan I, Westphal
M: Consensus document of European brain research. J Neurology,
Neurosurgery, Psychiatry 2006, 77:1-49.
doi: 10.1186/1743-0003-7-24
Cite this article as: Sakkalis et al., A decision support framework for the dis-
crimination of children with controlled epilepsy based on EEG analysis Jour-
nal of NeuroEngineering and Rehabilitation 2010, 7:24
Received: 24 August 2009 Accepted: 2 June 2010
Published: 2 June 2010
This article is available from: 2010 Sakkalis et al; licensee BioMed Cent ral Ltd. This is an Open Access article distributed under the terms of the Creative Commons Attribution License ( ), which permits unrestricted use, distribution, and reproduction in any medium, provided the original work is properly cited.Journal of NeuroEn gineerin g and Reha bilitatio n 2010, 7:24