Developments in Heat Transfer Part 16 ppt
Bạn đang xem bản rút gọn của tài liệu. Xem và tải ngay bản đầy đủ của tài liệu tại đây (4.15 MB, 40 trang )
30
Thermal State and Human
Comfort in Underground Mining
Vidal F. Navarro Torres
1
and Raghu N. Singh
2
1
Centre for Natural Resources and Environment of Technical University of Lisbon
2
Nottingham Centre for Geomechanics, of University of Nottingham
1
Portugal
2
United Kingston
1. Introduction
The human metabolism is accompanied by heat generation, with the body temperature
remaining constant near 36.9°C and in contact with surrounding atmospheric temperature;
people have cooler or hotter sensations.
When people are exposed to a temperature greater than the threshold limits, it causes
physiological effects expressed as follows: loss of interest in people’s activities, taking
frequent rests or breaks, a desire to quickly complete the task, irritability, reduced
concentration and reduction in sensitivity.
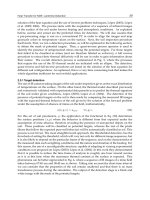
A prolonged exposure of people to unfavourable thermal conditions inevitably leads to
increase in body temperature and consequently producing physiological effects that affect
the work efficiency. Figure 1 shows a relationship between work efficiency and effective
temperature and air, wet temperature and air velocity. It may be noted that the prolonged
exposure of a worker to temperature exceeding 42°C may even cause death.
Work efficiency (%)
Effective temperature, T
e
, or Wet temperature, T
w
(ºF)
100
60
80
40
20
0
80 70 100 110
90
120
60
T
w
T
e
V = 2.03
m/s
V = 4.06 m/s
V = 0.51 m/s
V: air velocity
T
w
= wet temperature
Fig. 1. Effect of temperature on work efficiency (Navarro, 2003, Ramani, 1992)
Developments in Heat Transfer
590
The temperature of intake air due to its passage through an underground opening gradually
increases due to depth and the length of air travel through underground opening. The main
cause of heat transfer to air flow in underground atmosphere is due to thermal properties of
virgin rock, known as geothermal gradient. Other sources of heat to the air in underground
atmosphere are air auto-compression, diesel emission, explosive detonation, human
metabolism and influx of thermal water.
2. Mathematical model of heat transfer
The total variation of temperature in an underground environment Δt
total
can be calculated
by including the variation of temperature from air auto-compression Δt
a
, thermal properties
of rock Δt
r
, heat emission from diesel equipments Δt
d
, heat due to breaking of rocks with the
use of explosives Δt
e
, human metabolism Δt
h
and thermal water Δt
w
as outlined in equation
(1):
total a r d e h w
ttttttt
Δ
=Δ +Δ +Δ +Δ +Δ +Δ (1)
With increasing mining depths, the influence of the thermal properties of the rock mass
becomes more important (Navarro et al, 2008). Based on equation (1), the total underground
atmosphere temperature T
2
, will be expressed by equation (2), as a function of surface
temperature t
s
or underground opening initial temperature T
1
.
2 stotal
Tt t
=
+Δ or
21 total
TT t
=
+Δ (2)
2.1 Surface air temperature
It is well known that the surface air temperature varies with the seasons and is subjected to
regional variations according to local weather conditions, so that the temperature variation
is influenced by the ventilation current temperature in underground openings.
Fig. 2. Typical surface air dry temperature in Neves Corvo and San Rafael mines
Figure 2 indicates that average monthly surface temperature in Neves Corvo mine was
maximum 24.5ºC in July, minimum 9.0ºC in January and mean being 15.6ºC and in San Rafel
Thermal State and Human Comfort in Underground Mining
591
mines was maximum temperature was 8.8ºC in November, minimum 4ºC in July and mean
being 6.61ºC. Surface air temperature variation throughout the year can be better illustrated
with monthly average temperature measured in Neves Corvo and San Rafael mines (Figure 2).
Neves Corvo mine is located in Portugal in North Hemisphere at 20º latitude and at altitude
of 800m, but San Rafael mine located in Perú in South latitude at the altitude of about 4500
m. Temperature trend in Neves Corvo mine is similar to the metalliferous mines in Portugal
with maximum variation range of 15 °C and temperature tendency in San Rafael mine is
typical of the South American Andes with maximum variation range of 4.0 °C. Average dry
bulb temperature measured in Neves Corvo mine stopes located at depth between 750 m to
770m, compared with variation of external dry bulb temperature, observed clearly the
influence of outside temperature in underground openings (Figure 3). Therefore, the
maximum temperature on the hottest month will be critical.
Fig. 3. Surface air temperature influencing underground openings air temperature
Fig. 4. Underground temperature variations as a function of surface air temperature
Developments in Heat Transfer
592
The surface air temperature can influence the temperature of air flow in the atmosphere of
underground openings, since these are more than 7 °C, as in the Neves Corvo mine (Figure 4).
This result indicates that during winter times or in mines located at large altitudes, such as
the South America Andes, the outside temperature has little or no influence on the
temperature of underground openings.
Moreover, as a part of an environmental thermal comfort assessment in deep underground
mines, it is necessary to consider the surface temperature, because this is the initial
temperature, t
1
, of intake air to underground openings.
For similar conditions of Neves Corvo mine and at 750 m depth, variation in underground
openings temperature, Δt
s
, will be calculate by equation (3), based on surface air
temperature, t
e
.
0.301 2.107
se
ttΔ= − (3)
2.2 Heat transfer due to air auto-compression in vertical underground openings
Auto-compression process occurs during the air descent through the underground openings
and due to its own compression. The mathematical model is deduced considering the
equilibrium condition, air properties and the influenced of by vertical forces (Figure 5)
expressed by air equilibrium condition as follows:
α
d
h
d
p
h
L
Raise
t
1
t
2
Fig. 5. Air auto-compression in inclined raise layout
./0
a
gdh dp
ρ
−
= (4)
Where, g is gravity, dh is depth differential, dp is pressure differential,
ρ
a
is air density. By
substituting specific gravity γ and specific volume v in equation (4) the following expression
is obtained:
/dh dp vdp
γ
=
= (5)
In adiabatic process
.
k
pv
=
constant, when k is air adiabatic coefficient and differentiating
results in equation (6) as follows:
0vdp kpdp
+
= (6)
Clapeyron equation p.v= R.t
2
, where R is universal gases constant and t
2
is compressed air
temperature, the following differential equation results:
2
p
dv R dt v dp=−
(7)
Thermal State and Human Comfort in Underground Mining
593
Using equations (5), (6) and (7) equation (8) is obtained as follows:
2
(. ) 0dh k R dt dh
+
−= (8)
Integrating the equation (8) obtains the following expression (9) where C is constant:
22
(1 ) . (1 ) . . 0kdhkRdt khkRt C
−
+=−++=
∫
∫
(9)
Rearranging equation (9), the temperature t
2
is obtained as follows:
2
(1)
.
kh
tC
kR
−
=
−
(10)
For initial values h=0 and t=t1, the constant C=0, then C=-t
1
, the adiabatic equation 9 result
in equation 11 as follows:
21
(1)
.
a
kh
ttt
kR
−
Δ= −=
(11)
With numerical values of constant of perfect gases (R=29.27 kgf-m/kg-ºK) and average air
adiabatic index (1.302) the final equation is obtained as follows:
21
0.0098tt h−=
(12)
In general condition depth h will be expressed as a function of underground opening length
L (m) and inclination α (º), as h=LSin
α
and finally, the temperature increase due air auto-
compression
a
tΔ (ºC) results in following equation (Navarro Torres, 2003):
21
0.0098 sin
a
ttt L
α
Δ= −=
(13)
That means, when α=90º (vertical raise) for each 100 m air temperature increases by in
0.98ºC, for 200 m 1.96ºC, for 300 m 2.94ºC, for 400 m 3.92ºC, for 500 m 4.9ºC, for 650 m
6.37ºC, for 800 m 7.84 ºC and for 1000 m 9.8ºC. Therefore when α=0º (horizontal
underground opening) auto-compression temperature is zero (Figure 6)
Fig. 6. Variation of auto-compression temperature with raise inclination
Developments in Heat Transfer
594
2.3 Heat transfer of thermal properties of rock mass to underground atmosphere
At a certain depth h
n
from the surface defined as the thermal neutral zone (15 m according
to Ramani 1992; 20 to 40 m indicated by Vutukuri & Lama, 1986) the temperature of rock
masses varies during the year as a function of the changes of surface air temperature. The
temperature of any rock mass at depth t
hr
and underground atmosphere air temperature
variation Δt
r
can be calculated by the following equations:
()
n
hr n
g
hh
tt
g
−
=+
(14)
1
sin
n
g
g
hhL
t
g
α
−±
Δ=
(15)
where; t
hr
is the rock temperature at depth h (ºC), t
n
is the temperature of the rock mass
above the thermal neutral zone (ºC), h depth of mining excavation below the surface, h
n
is
the depth of the thermal neutral zone (m) and g
g
geothermal gradient of the rock mass
(m/ºC).
In order to obtain the mathematical model for the calculation of heat transfer of thermal
properties of rock mass, use of the heat transfer formulation of gas flow in pipes can be
applied to underground openings.
Heat spreads from one point to another one in three distinct ways: conduction, radiation
and convection. In most cases, the three processes occur simultaneously and therefore the
amount of heat “q” supplied to a body of mass “m” and specific heat C
e
, when the
temperature increases from t
1
to t
2
is given by the general equation (16):
21
.( )
ee
qmCt t mC t
=
−= Δ (16)
For the air flowing in the underground openings this equation can be expressed in function
of the circulating air volume Q through:
.21
1000 . . 1000. . . .( )
raer ae
qCQt CQtt
ρ
ρ
=
Δ= − (17)
Where q
r
is the heat received by the air from the rock mass (W),
ρ
a
the air density (kg/m
3
), C
e
the specific heat of air (kJ/m.ºC), Q the flow of air (m
3
/s) and Δt
r
the variation of
temperature from t
1
to t
2
(Fig. 7). The heat coming out of the rock mass and received by the
ventilation air in the underground environment can also be expressed in terms of coefficient
of heat transfer
λ
(Holman, 1983) according to the equation (17):
( )
p
m
d
q
Pdx P T
λ
=− (18)
Where T
p
and T
m
are the temperatures of rock wall and air mixture in the particular position
x (ºC), λ is the coefficient of heat transfer between the rock mass and the air mixture
(W/m
2
.ºC) and P is the perimeter of the section of the underground opening (m). The total
heat q
r
transferred (W) can be calculated by using equation (19) as follows:
( )
r
p
m avera
g
e
qPLTT
λ
=
− (19)
Thermal State and Human Comfort in Underground Mining
595
h
1
h
n
Undergorund
opening
Thermal neutral zone
1
2
A
B
L
α
dx
Q
q
r
h
1
, t
1
t
2
Fig. 7. Layer of rock influenced by external temperature and elementary parameters of an
underground opening
Using equation (19) the average temperature of the rock mass may be given by equation (20)
and (21):
1
11
.sin
1
2
n
p
g
hhL
Ttt
g
α
⎧
⎫
⎛⎞
−±
⎪
⎪
⎜⎟
=++
⎨
⎬
⎜⎟
⎪
⎪
⎝⎠
⎩⎭
(20)
12
2
m
tt
T
+
=
(21)
By substituting equations (20) and (21) in equations (17) and (19) the following expression is
obtained:
()
1
12 21
.sin
1000. . . .
2
n
ae
g
hhL
PL
tt CQtt
g
α
λ
ρ
⎡⎤
−±
⎡⎤
+− = −
⎢⎥
⎢⎥
⎣⎦
⎢⎥
⎣⎦
Finally the variation of temperature from t
1
to t
2
(Δt
r
) may be expressed as follows:
1
21
( .sin )
( . . 2000. . . )
n
r
gae
PL h h L
ttt
gPL CQ
λ
α
λρ
−±
Δ= − =
+
(22)
Resulting equation (22) is an innovative mathematical model developed for heat transfer of
thermal properties of rock mass to underground openings (Navarro, 2003).
In raises or in any vertical underground openings, h
1
= 0, and the length which influences
the temperature due to geothermal gradient is L Sinα
- h
n
and α =90º, thus, resulting in the
following equation:
[]
2
21
( )
. .( ) 2000. . .
n
r
gnae
PL h
ttt
gPLh CQ
λ
λρ
−
Δ= − =
−+
(23)
The coefficient of heat transfer
λ
is calculated as a function of the thermal conductivity K
(W/mºC) which is the non-dimensional coefficient of Dittus and Boelter N
db
and the
diameter of section d (m); for horizontal and inclined underground openings d = (B + A)/2,
where B is the width of the section (m) and A its height (m):
Developments in Heat Transfer
596
.
db
kN
d
λ
=
(24)
The relation of Dittus and Boelter co-efficient N
db
. (Holman, 1983) was studied in detail by
Petukohov for gases (air) that derived the following equation:
0.5 0.67
Re .Pr
8
1.07 12.7( ) (Pr 1)
8
d
db
f
N
f
=
+
−
(25)
Where R
ed
is the Reynolds number (non-dimensional), given by:
.
ed
Vd
R
μ
=
(26)
in which V is the average velocity of air (m/s), d the underground opening diameter (m)
and
μ
the kinematic viscosity of air (Kg/m.s). In addition, f is the friction coefficient of the
underground opening walls (Kg/m
3
), P
r
is the Prandtl number (non-dimensional) calculated
by:
ae
r
C
P
K
ρ
μ
=
(27)
Air properties at atmospheric pressure will be determined based in temperatures (Table 1).
2.4 Heat transfer from diesel equipment
The equipments used in underground work generate the heat transfer to the ventilation
current in underground atmosphere as follows:
1.
Mobile diesel and electrical equipments, such as jumbo drills, trucks, LHDs, pumps,
locomotives, etc.
2.
Electrical and non-mobile equipments (fans, lighting, pumps, hoists, stations or
transformer substations, etc.).
For the mobile and non-mobile equipments used in underground work, diesel equipments
contributes significantly to heat transfer to the air flow in underground atmosphere. Diesel
engines fuel consumption for mining equipment is 0.24 kg/kWh, with a calorific value of 44
MJ/kg (Vutukuri & Lama, 1986), so the total energy released is 0.24x 44x10
3
KJ/kWh =
10560 kJ/kWh = 176 kJ/mink = 2.9 kJ/s.KW = 2.9 kW/kW. Of the total 1kW energy release,
(34%) is converted into mechanical energy and 1.9 kW (66%) is exhausted to air flow of
underground atmosphere. This energy is not totally transferred to the air flow, because it
depends to the effective time for which the equipment used, so it is different for each
condition of underground work and the value is around 0.9 kW (31%).
Diesel equipment heat exhaust q
ed
(KW) can be expressed by equation (28) as follows:
ed m t d d
qffqP=
(28)
Where q
d
is the equivalent energy released by diesel fuel (2.9 kW/kW),
P
d
is the equipment engine (kW),
f
m
is mechanical efficiency and
f
t
is equipment utilization efficiency.
Thermal State and Human Comfort in Underground Mining
597
T (ºK)
ρ
a
(kg/m
3
)
C
e
(KJ/kg.ºC)
ν(kg/m.s)
x10
-5
μ(m
2
/s)x
10
-6
K(W/m.ºC)
Dif.Térm.
(m
2
/s)x10
-4
P
r
100
150
200
250
300
350
400
450
500
550
600
650
700
750
800
850
900
950
1000
1100
1200
1300
1400
1500
1600
1700
1800
1900
2000
2100
2200
2300
2400
2500
3.6010
2.3675
1.7684
1.4128
1.1774
0.9980
0.8826
0.7833
0.7048
0.6423
0.5879
0.5430
0.5030
0.4709
0.4405
0.4149
0.3925
0.3716
0.3524
0.3204
0.2947
0.2707
0.2515
0.2355
0.2211
0.2082
0.1970
0.1858
0.1762
0.1682
0.1602
0.1538
0.1458
0.1394
1.0266
1.0099
1.0061
1.0053
1.0057
1.0090
1.0140
1.0207
1.0295
1.0392
1.0551
1.0635
1.0752
1.0856
1.0978
1.1095
1.1212
1.1321
1.1417
1.160
1.179
1.197
1.214
1.230
1.248
1.267
1.287
1.309
1.338
1.372
1.419
1.482
1.574
1.688
0.6924
1.0283
1.3289
1.488
1.983
2.075
2.286
2.484
2.671
2.848
3.018
3.177
3.332
3.481
3.625
3.765
3.899
4.023
4.152
4.44
4.69
4.93
5.17
5.40
5.63
5.85
6.07
6.29
6.50
6.72
6.93
7.14
7.35
7.57
1.923
4.343
7.490
9.49
16.84
20.76
25.90
31.71
37.90
44.34
51.34
58.51
66.25
73.91
82.29
90.75
99.30
108.2
117.8
138.2
159.1
182.1
205.5
229.1
254.5
280.5
308.1
338.5
369.0
399.6
432.6
464.0
504.0
543.5
0.009246
0.013735
0.01809
0.02227
0.02624
0.03003
0.03365
0.03707
0.04038
0.04360
0.04659
0.04953
0.05230
0.05509
0.05779
0.06028
0.06279
0.06525
0.06752
0.0732
0.0782
0.0837
0.0891
0.0946
0.1000
0.105
0.111
0.117
0.124
0.131
0.139
0.149
0.161
0.175
0.02501
0.05745
0.10165
0.13161
0.22160
0.2983
0.3760
0.4222
0.5564
0.6532
0.7512
0.8578
0.9672
1.0774
1.1951
1.3097
1.4271
1.5510
1.6779
1.969
2.251
2.583
2.920
3.262
3.609
3.977
4.379
4.811
5.260
5.715
6.120
6.540
7.020
7.441
0.770
0.753
0.739
0.722
0.708
0.697
0.689
0.683
0.680
0.680
0.680
0.682
0.684
0.686
0.689
0.692
0.696
0.699
0.702
0.704
0.707
0.705
0.705
0.705
0.705
0.705
0.704
0.704
0.702
0.700
0.707
0.710
0.718
0.730
Table 1. Air properties at atmospheric pressure (Holman, 1983, Navarro, 2003)
Based on equation (28), the temperature variation of air due to exhaust from the diesel
equipment Δt
d
(ºC) can be quantified by the following equation:
mtd d
d
ae
ffqp
t
CQ
ρ
Δ= (29)
It may be noted that the exhaust heat from the diesel engines to the underground
atmosphere is from the local equipment use only.
Developments in Heat Transfer
598
2.5 Heat transfer from explosive blasting
The blasting process of explosive in underground environment generates heat that is
transferred to the surrounding rock mass and to the ventilation current of the underground
atmosphere.
Heat released by blasting q
e
(kW) can be calculated by equation (30), based on calorific
energy of explosive E
e
(kJ/kg), and explosive quantity daily used q
e
(Kg/day). For example,
the calorific energy of ANFO is 3900 kJ/kg and the dynamite 60% varying between 4030 to
4650 kJ/kg.
.
86400
ee
e
E
q
q =
(30)
The thermal influence due to blasting Δt
e
(ºC) can be quantified by equation (31) as follows:
.
86400. . .
ee
e
ae
E
q
t
CQ
ρ
Δ=
(31)
Similar to diesel exhaust heat, the heat due to explosive detonations influences the local
atmosphere only.
2.6 Heat transfer due to human metabolism
The heat transfer of human metabolism in not significant and can be ignored (Hartman et
al., 1997), for example 800 workers in normal working conditions leads to a total release of
192 kW (65000 BTU/hr), energy corresponding to each worker being 0.25 kW.
Thus, when the number of people or workers in an underground environment is large,
temperature increase by human metabolism
Δ
t
h
(ºC) can be expressed by equation (32),
where q
h
is the human heat release and it is a function of effective temperature (kW/person)
and, n is the total number of human involved.
.
h
h
ae
q
n
t
CQ
ρ
Δ=
(32)
2.7 Heat transfer from underground water
Two sources of water are encountered in mining: Groundwater or Mine water. All ground
water, especially from hot fissures and natural rock reservoirs, is a prolific source of heat in
mine workings. Since water and heat are both derived from the surrounding rock or
geothermal sources, the water temperature will approach or even exceed the rock
temperature.
The water transfers its heat to the mine air, mainly by evaporation increasing the latent heat
of the air.
The total heat gain from hot underground water in open channel flow q
w
(kW) can be
calculated from the equation (33):
.( )
wtwwtwa
qFctt
=
− (33)
Where F
tw is
weight flow rate of thermal water (kg/s)
C
w
is specific heat of water (4.187 kJ/kg°C), and
t
tw
and t
a
are water temperatures at points of emission and exit from the mine
airway in (°C), respectively.
Thermal State and Human Comfort in Underground Mining
599
The thermal influence of underground ventilation air flow can be calculated by equation
(34) as follows:
(
)
.
4.187
tw tw a
w
ae
Ft t
t
CQ
ρ
−
Δ= (34)
3. Case studies of heat transfer in underground mining
3.1 Case study in Portuguese Neves Corvo mine
Vertical underground opening
The Neves Corvo mine is an operating underground copper and zinc mine in the western
part of the Iberian Pyrite Belt which stretches through southern Spain into Portugal. The
mine uses both bench and fill and drift and fills underground stoping methods. The copper
plant has treated a maximum of 2.0 mt per annum of ore and in 2007 it was upgraded to
treat up to 2.2 mt of ore per annum.
Fig. 8. Map of the Neves Corvo area showing the massive sulphide ore bodies Neves, Corvo,
Gracia and Zambjal, main faults and the exploratory boreholes (Moura, 2005)
The ore bodies of the underground Neves Corvo copper mine (Fig. 8) were formed in a
volcanic sedimentary submarine environment possibly linked with an intercontinental rift
and, third order pull apart basins, not far from the collision zone and located in geological
formations between Volcanic Lavas (V1) and Volcanic Sediments (V2). The V1 is composed
of black shale/schist and has same silicfication but generally less than V2 volcanic. The V2
has a compact vitreous due the high quantity of silica (Riolitic) showing schistosity and
alteration from Chlorite (Lobato, 2000).Mining areas are located between +200m and -450m,
Developments in Heat Transfer
600
and they are referred to 0 level, equivalent to 0 m datum and transport level equivalent to
-550m level (Fig. 9). The total length of underground vertical shafts, inclined and horizontal
openings is about 80 kilometres.
COLECTO
R
720
COLECTOR 850
Transport Neves
-3
Transport Level 700
CORVO
Ore body
GRAÇA
Ore body
N
EVES Ore body
Transport level 550
Comminution
Level 550
Comminution Level
700
SANTA
BÁRBARA
SHAFT
RAMP
GRAÇ
A
RAMP
N
EVES
RAMP
CASTRO
CPV4
CPV8
CPV2
CPV5
CPV3
CPV1
CPV6
Ore pass CPM
Ventilation shaft CPV
Use diverse galleries
Use diverse ramps
Use diverse inclined openings
LEGEND
GRAÇA COLECTOR
NEVES COLECTOR
Fig. 9. Neves Corvo underground mine cross section (Navarro, 2003)
The air temperature in underground stopes of Neves Corvo mine is moderate averaging
between 20ºC to 33ºC and in isolated areas in critical condition reaching 42ºC
For applying the mathematical model a vertical underground opening the CPV3 shaft
shown in Figure 10, was selected (Navarro Torres, et al, 2008). This shaft was constructed
using a raise boring machine from the depth of 1222.40m level to 973.64m level with a length
of 248.76m and a diameter of 4.2 m (perimeter 13.19 m and 13.85 m
2
in
cross section area).
The wall friction factor corresponded to 0.0362 kg/m
3
with an average air velocity measured
in July 2000 of 11.84 m/s and average exterior temperature of 24.61 ºC (Figure 2 and Figure 3).
Average airflow resulted in 164.03 m
3
/s calculated based on air velocity measured, as
indicated in Figure 11.
Depth
Air intake
Shaft
CPV3
Fig. 10. Scheme and photograph of shaft CPV3
Thermal State and Human Comfort in Underground Mining
601
0
1
2
3
4
5
6
7
8
9
10
11
12
13
14
15
16
17
18
19
20
21
22
23
24
25
26
27
28
1
2:29
12
:3
4
12:
3
9
12:
4
4
12:
4
9
12:
5
4
12:
5
9
13:04
13:09
13:14
13:19
1
3:24
13
:2
9
13:
3
4
13:
3
9
13:
4
4
13:
4
9
13:
5
4
13:59
14:04
14:09
14:14
14
:1
9
14:
2
4
14:
2
9
14:
3
4
14:
3
9
14:
4
4
14:
4
9
14:54
14:59
15:04
1
5:09
15
:1
4
15:
1
9
15:
2
4
Dry temprature - Air velocity
Dry temperature (ºC)
Air velocity (m/s)
Fig. 11. Intake dry temperature and air velocity measured by Data LOGGER DL20K
The air temperature in CPV3 shaft is not influenced by the temperature rise due to diesel
equipments (
Δ
t
d
), explosives (
Δ
t
e
), thermal water (
Δ
t
w
) and human metabolism (
Δ
t
h
).
Therefore, only auto-compression (
Δ
t
a
) and geo-thermal properties of rock (
Δ
t
r
) were
considered for the validation of the proposed model.
The physio-chemical properties of air shown in Table 2 extracted from Table 1 for 24.4ºC
enabled the calculation of the Prandtl number P
r,
Reynolds number Re
d
, related to Dittus
and Boelter number N
db
and coefficient of heat transfer
λ
, by applying equations (27), (26),
(25) and (24), respectively as shown in Table 3.
ρ
a
(kg/m
3
)
C
e
(kJ/kg.ºC)
μ (m
2
/s)
K(W/m.ºC)
1.1888 1.0056 16.48 x10
-6
0.026
Table 2. Physio-chemical air properties at 24.4 ºC (Navarro, 2008).
P
r
R
ed
N
bd
λ
(W/ m
2
.ºC)
0.709 3.02 x 10
6
5162.02 76.106
Table 3. Coefficient of heat transfer and previous values calculated
Finally using the geothermal gradient as 30.3 m/ºC for the rock mass (g
g
) for the Neves
Corvo mine (Fernández-Rubio. et al., 1990) and using 30.0m as the depth of thermal neutral
zone in the developed mathematical model in equation (23), the temperature rise of rock
mass (Δt
r
= t
2 –
t
1
) is calculated as 2.65ºC. Applying these values to equation (13), the
temperature increase due to air auto-compression can be obtained as 2.38ºC. Then the total
increase of the air temperature during the air flow in the shaft CVP3 results in 5.03ºC (Fig.
12), calculated by following simplified equation:
2
0.033( 30)
0.0098.
2.38. 30
ar
L
tt L
QL
−
Δ+Δ= +
+−
(34)
Developments in Heat Transfer
602
Obviously, when airflow is decreased, the total temperature increment (auto-compression +
geothermal properties of rock + temperature due to depth increase) significantly raises the
total temperature increment (Fig. 12).
By applying equation (2) to equation (34), the underground atmosphere’s temperature of
CPV3 shaft T
2
in Neves Corvo mine as a function of airflow quantity Q is represented by
equation (35) given below and illustrated in Figure 13 for the average surface temperature
15.65
o
C (maximum 24.5ºC, minimum 9ºC and mean 15.65ºC).
2
1579.25
2.44
2.38 248.76
s
Tt
Q
=+ +
+
(35)
Shaft CPV3
50 75 100 125 150 175 200 225 250
Airflow, m /s
3
35
30
25
20
15
10
5
0
Underground atmosphere temperature ºC
100 m
200 m
248.76 m
300 m
400 m
500 m
600 m
700 m
Fig. 12. Total increases in temperature due to auto-compression and geothermal properties
of rock as a function of shaft depth and airflow in shaft CPV3
Measure airflow quantity
Underground atmosphere temperature ºC
35
30
25
20
15
10
5
0
50 75 100 125 150 175 200 225 250
Airflow quantity, m /s
3
ts maximum 24.5 ºC
ts medium 15.65 ºC
ts minimum 9 ºC
Fig. 13. Underground atmosphere temperature influenced by auto-compression and thermal
properties of rock and airflow quantity in CPV3 shaft
Thermal State and Human Comfort in Underground Mining
603
It may be observed that a slight increase in the underground atmospheric temperature,
results in slight decrease in the air flow. The average values measurement with Data
LOGGER DL20K of ROTRONIC in the air shaft intake with a thermo/hygrometer Casella in
the shaft (Fig. 14) was 29.52ºC in the shaft bottom and 24.61ºC in the intake, therefore the
difference is 4.91ºC.The comparison the results show a total variation of temperature (
Δ
t
total
)
between the mathematical model and measured temperature in CPV3 shaft is only 0.12ºC.
Fig. 14. Measurements with Data LOGGER DL20K and thermo/hygrometer Casel
3.2 Case study in Peruvian San Rafael tin mine
Sub-horizontal underground opening
The San Rafael mine belongs to the Peruvian company MINSUR S.A. and is located
Southwest of the San Bartolomé de Quenamari mountain (altitude 5299 m), in the
Department of Puno in the Eastern Mountains of Southern Peru. It is geographically located
in the coordinates of 70°19' longitude West and 14°14' latitude south. This mine is the only
producer of tin in Peru and ore production is 2500 tons per day, with 5.23% of tin (Sn).
Geology of San Rafael mine involves silts and quartzite rocks of the tertiary Sandia
formation with the intrusion of two granites. In the neighborhood there are rocks of the
superior Paleozoic age. In the Sandia formation silts have dark gray colors with muscovite
in the cleavage plans and the quartzites are intercalated with silts (Fig. 15).
The mineralized veins and ore bodies are located in the intrusive ore body of San Rafael
along the NE – SW direction, with a length of 800 m to 1000 m, a width of 300 m and depth
of up to 2000 m. These ore bodies have widths of 4 m to 30 m, lengths of 30 m to 180 m and
heights of 60 m to 610 m, and in general have prismatic forms. The main existing minerals
are cassiterite, stanhite and chalcopyrite.
The main access from surface is through 4523m ramp that communicates to 3825m level,
constituting the principal infrastructure of underground transport, as well as the ventilation
circuit (Fig. 16).
Figure 17 presents the clean air temperatures with normal trend until the level 3950 m
(17ºC), but in 3850m level, where a variation is only 100 m, temperature increases to 34ºC,
thus showing the effect of thermal water. A forecast for air temperature in the 3850m level
without the influence of hot water leads to 20ºC for the air flow of 8.11m
3
/s.
Developments in Heat Transfer
604
Fig. 15. Geological section with zones of mining in San Rafael along the direction N 70º E
Fig. 16. General project of the underground environment of San Rafael mine (Navarro, 2001)
1
2
3
5
6
4
Thermal State and Human Comfort in Underground Mining
605
0
5
10
15
20
25
30
35
40
3800 3900 4000 4100 4200 4300 4400 4500 4600
Temperature (ºC)
Trend influenced by thermal water located in 3850
Trend without thermal water influenced
Fig. 17. Air temperature trends with and without the influence of thermal water (Navarro,
2003)
The thermal water temperature measured in the flowing water channel was 40ºC and the
influence of air temperature in underground opening was up to 34 ºC (15 m
2
section). It may
be observed that an increase in temperature by 12 ºC is not a normal trend of air
temperatures, because it represents an increase of about 60%.
In San Rafael mine case study, the calculated geothermal gradient g
g
based on equations (1)
and (22) and measured data and equation (22) needed recalculation of temperatures
variation due to diesel exhaust, explosive detonations and thermal water, because in local
level 3850, the temperature increment due to auto-compression and human metabolism are
insignificant.
Diesel equipments heat transfer Δt
d
, is calculated by applying equation (29) based on
combined factors of mechanical efficiency and equipment utilization efficiency (f
m
.f
t
) of 0.005
for diesel equipments used in ramp 4523(level 3850) (Table 4), air density 1.2661 kg/m
3
and
specific heat of air 1.0056 kJ/kg.ºC (Table 1) and for depth local level 3850 of ramp 4523,
temperature increase result is 0.85ºC.
Heat transfer Δt
e
due to explosive detonation
is
determined by applying equation (31), based
on an average of 120 kg per day ANFO, air density and air specific heat (Table 1), resulting
in temperature rise of 0.52ºC.
The thermal water heat transfer calculated by applying equation (34), based on measured
flow rate of 4.93 l/s of thermal water in channel F
tw
, was 40ºC water temperatures at points
of emission t
tw
and 34ºC at the exit from the mine airway t
a
; using air density and air
specific heat (Table 1), result being 12ºC.
Using these results and applying equation (1) based in measured 22ºC (34ºC-12ºC) total
temperature increase Δt
total
the heat transfer of virgin rock Δt
r
results in 8.63ºC.
Finally, for the following conditions d = 4.5m, f = 0.0046kg/m
3
, V = 0.39m/s, P = 18m,
L = 7000m, h
1
= 30m, h
n
= 30m, α = 7º, Q = 8.11m
3
/s (branch 6-5 Figure 15) and for physical-
chemical air conditions (Table 5) and calculated Prandtl number P
r,
Reynolds number Re
d
,
relation of Dittus and Boelter N
db
and coefficient of heat transfer
λ
, is calculated applying
equations (27), (26), (25) and (24), respectively as shown in Table 6, and applying equation
(22) the geothermal gradient result in 59.51m/ºC or 1.68 ºC for each 100 m.
Developments in Heat Transfer
606
Mining operations Equipments
Development and
prospection
. 2 Jumbo Boomer H 282 of Atlas Copco, with 75 HP (55.93 KW)
. 2 LHD de 5.5. Yd
3
EJC, with 186.43 KW each.
Drilling long holes
. 1 Simba H-1354 de Atlas Copco, Cop – 1838, with 80 HP (59.66 KW)
. 1 DTH Tunnel 60, Drillco Toolls, Topo 3
. 1 DTH Mustang A32 de Atlas Copco, with Drill Cop – 34
Mucking ins stopes
. 2 LHD de 6.5 yd
3
ST100 Wagner, with 250 HP (186.43 KW) each.
. 1 LHD de 3.5 Yd
3
Wagner (stand by), com 185 HP (137.9 KW)
Fragmentation . 4 hydraulic drills Kent
Ore transport by ramp . 6 Trucks Volvo NL12, de 15 m
3
, with 410 HP (305.73 KW) each.
Supervision . 27 Cars, with 89 HP (66.37 KW) each.
Table 4. Underground diesel equipment used in San Rafael mine
ρ
a
(kg/m
3
)
C
e
(kJ/kg.ºC)
μ (m
2
/s)
K(W/m.ºC)
1.26614 1.0056 14.07 x10
-6
0.0248056
Table 5. Physical-chemical air properties
P
r
R
ed
N
bd
λ
(W/ m
2
.ºC)
0.710 0.125 x 10
6
45.08 0.248
Table 6. Coefficient of heat transfer and previous values calculated
Geothermal gradient trend of San Rafael mine based on calculated results as compared with
worldwide mining district trends is shown in Fig. 18.
Fig. 18. Geothermal gradient of San Rafael mine compared of some worldwide mining
districts (compiled by Navarro, 2001)
De
p
th
(
Km
)
0
Temperature virgin rock mass (ºC)
20
40
60
80
Thermal State and Human Comfort in Underground Mining
607
In Rafael mine, the intake clean air bay drifts 4666, 4600 and ramp 4523, compared with the
mine deepest level at 3835 m, there is an 831 m level difference where temperature raises
21.5ºC, or about 1ºC for each 40m depth. This result indicates a variation of annual average
external temperature of 6.61 ºC and at level 3850 would reach 16.70 ºC (Fig. 19), which is
compatible with the trend of temperatures measured in ramp 4523. The thermal
conductivity of the rock mass of the San Rafael mine is estimated as 3.25 W/mºC.
0
2
4
6
8
10
12
14
16
18
20
3800 3900 4000 4100 4200 4300 4400 4500 460
0
Level (m)
Temperature (ºC)
Geothermal degree determined
Ramp 4523 air temperature measure
d
Linear (Ramp 4523 air temperature measured)
Fig. 19. Geothermal gradient determined and air temperature measured Navarro, 2003
Thermal human comfort assessment in underground openings based on International
Standards Organization (ISO 7730) and American Society of Heating, Refrigerating and Air-
Conditioning Engineers (ASHRAE/55) standards, and the thermal human comfort defined
based in operative ranges from 22ºC to 28ºC as shown in Figure 20.
Fig. 20. ISO 7730 and ASHRAE/55 human thermal comfort standards
Developments in Heat Transfer
608
By applying equations (1) and (2), using the annual average external temperature as 6.61 ºC
(Fig. 2), without the influence of thermal water and the physio-chemical properties of air
conditions (Tables 5 and 6) the thermal condition of 4523m ramp in San Rafael mine was
assessed by using equation (36)
2
0.544 11.745
265.653 151539.88
total
L
t
LQQ
Δ= +
+
(36)
In San Rafael mine without thermal water heat transfer, the temperature is lower than
thermal comfort standards (ISO 7730 and ASHRAE/55). Figure 21 illustrates the
underground opening temperatures for various air flow rates and underground opening
lengths. It can be observed that when airflow increases, the underground opening
temperature decreases, and on the other hand, when underground opening length increases,
the change in underground air temperature is moderate.
Fig. 21. Temperature total increment influenced by airflow quantity and underground
openings length in San Rafael mine
For thermal human comfort assessments in underground openings it is necessary to
determine the local thermal situation and that obtain increasing for the total temperature
increment
Δ
t
total
the initial temperature in the underground opening branch
(t
1
). In San
Rafael mine measured average minimum temperature in July was 4°C and the maximum
temperature in February was 7.8ºC and the average temperature was 6.16ºC a shown in
Figure 2.
Underground atmosphere temperature in ramp 4523 (Level 385 m), influenced by thermal
water as a function of initial temperature in local branch t
1
, local length (349 m) and airflow
quantity Q, will be expressed by particular equation (37) as shown in Figure 22.
21
1 109.04
0.0868 0.142
tt
=+ +
+
(37)
Thermal State and Human Comfort in Underground Mining
609
In the locality of ramp 4523 (level 3835) where the average intake air temperature is 16.7ºC,
the temperature is influenced by the heat transfer due geothermal properties of rock, diesel
exhaust, explosive detonation and thermal groundwater and the human thermal comfort
will be obtained for airflow quantity between 6 and 8 m
3
/s (Fig. 20). When the airflow
quantity are smaller than 6 m
3
/s the underground atmosphere temperature increases
greatly and for the flow rates higher than 8 m
3
/s the surface temperature decreases
gradually.
Thermal comfort lower
limit
Thermal comfort upper limit
Airflow quantity, m /s
0 10 20 30 40 50 60 70 80 90 100 110 120
50
45
40
35
30
25
20
15
10
5
0
Underground atmosphere temperature ºC
Minimum 4 ºC
Medium 6.61 ºC
Maximum 7.8
ºC
Fig. 22. Human thermal comfort situation in ramp 4523m (level 3835) of San Rafael mine
It may be noted that without the presence of thermal water there is no risk of environmental
thermal discomfort, but in localities with thermal water there appears to be risk of thermal
discomfort.
3. Acknowledgements
Thanks are due to Dr A. S. Atkins, Faculty of Computing, Engineering and Technology,
Staffordshire University for his valuable suggestions to improve the quality of this book
chapter.
4. References
Fernández-Rubio, R., Carvalho P. and Real F. (1988). Mining-Hydrological characteristics of
the Underground Copper Mine of Neves-Corvo, Portugal. Third International Mine
Water Congress. Melbourne, Australia, pp. 49-63
Hartman H. L., Mutmansky J. M., Ramani R. V. and Wang Y. J. (1997). Mine Ventilation and
Air Conditioning, (3d ed), John Wiley & Sons, Inc, New York. USA, pp.730
Holman, J. P. ( 1983). Transferência de calor. McGraw Hill, São Paulo Brasil, pp. 194–203
Moura, A. (2005). Fluids from the Neves Corvo massive sulphide ores, Iberian Pyrite Belt,
Portugal. Chemical Geology. Volume 223, Issues 1-3, 22 November 2005, 153–169
Developments in Heat Transfer
610
Lobato, J. C. (2000). Evaluation of mining induced stress on support requirements at Neves Corvo,
MSc Thesis University of Exeter, UK, 21–31
Navarro Torres V. F. (2001). Thermal, dynamic and volumetric impact assessment of
underground environment of Peruvian San Rafael mine, Technical Report,
Geotechnical Center of Technical University of Lisbon, pp. 47
Navarro Torres V. F. (2003). Environmental Underground Engineering and Applications of
Portuguese and Peruvian Mines, Doctoral Thesis, Technical University of Lisbon, pp.
85-225
Navarro Torres V. F., Dinis da Gama C., Singh R. N. (2008). Mathematical modelling of
thermal state in underground mining, Acta Geodyn. Geomater., Vol. 5, No. 4 (152),
pp. 341–349
Ramani R. V. (1992). Personnel Health and Safety, Chapter 11.1 SME Mining Engineering
Hand Book, 2
nd
Edition Volume 1, H. L. Hartman Senior Editor, pp. 995 -1039
Vutukuri V. S. & Lama R. D. (1986). Environmental Engineering in Mines, Cambridge
University Press, 0521157390, Great Britain, 518 pp. 518
31
Heat Transfer in the Environment:
Development and Use of Fiber-Optic
Distributed Temperature Sensing
Francisco Suárez
1
, Mark B. Hausner
1
,
Jeff Dozier
2
, John S. Selker
3
and Scott W. Tyler
1
1
University of Nevada, Reno,
2
University of California, Santa Barbara,
3
Oregon State University,
United States
1. Introduction
In the environment, heat transfer mechanisms are combined in a variety of complex ways.
Solar radiation warms the atmosphere, the oceans, and the earth’s surface, driving weather
and climate (Lean & Rind, 1998). Clouds and aerosols reflect a fraction of the incoming solar
radiation and partially absorb the infrared radiation that comes from the earth’s surface,
allowing the existence of acceptable temperatures for the biota and human survival
(Norand, 1920; Moya-Laraño, 2010). In water bodies, absorption and scattering of solar
radiation results in stratification of the water column (Branco & Torgersen, 2009). Cooling
conditions, e.g., convective night-time cooling, at the water surface can destroy the
stratification and thus, mix the water column (Henderson-Sellers, 1984). In open water
bodies solar radiation also induces evaporation: as water changes its phase, heat is
transferred from the water body into the atmosphere by the release of latent heat (Brutsaert,
1982). Within the earth, temperature increases with depth. The temperature at the earth’s
center is estimated to be on the order of 6000 °C (Alfe et al., 2002). An average geothermal
gradient of 25-30 °C km
-1
(Fridleifsson et al., 2008) indicates that approximately 40 TW (4 ×
10
13
W) flow from the earth’s interior to its surface (Sclater et al., 1981). Much of this heat is
the result of radioactive decay of potassium, uranium, and thorium (Lee et al., 2009). In the
shallow subsurface, this geothermal gradient can be disturbed by groundwater flow and
atmospheric conditions (Uchida et al., 2003; Bense & Kooi, 2004).
By measuring the temperature in the environment, it is possible to elucidate the main heat
transfer mechanisms controlling different environmental, ecological, geological or
engineering processes. Many of these processes span spatial scales from millimeters to
kilometers. This extreme range of spatial scaling has been a barrier limiting observation,
description, and modeling of these processes. In the past, temperature measurements have
been performed at small scales (spanning millimeters, centimeters, or a few meters) or at
large scales (spanning tens of meters or kilometers (Alpers et al., 2004)). However, for spatial
scales between these two disparate scales and in a variety of media, there is a lack of
Developments in Heat Transfer
612
methods that can accurately estimate temperatures. Fiber-optic distributed temperature
sensing (DTS) is an approach available to provide coverage in both space and time that can
be used continuously to monitor real-time data in different environments and at spatial
scales that range from centimeters to kilometers. DTS was first developed in the mid 1980s
(Dakin et al., 1985) and used in the oil and gas industry during the 1990s and early 2000s
(Kersey, 2000), but only since the middle of this decade have DTS instruments achieved
acceptable levels of spatial and temporal resolution, along with the high temperature
accuracy and resolution needed to observe environmental processes. With their spatial and
temporal coverage, DTS methods offer significant advantages over traditional measurement
systems in the environment. For instance, the fiber-optic cables that serve as the temperature
probe are low cost, with no issues of bias or fluid column disturbance, and variability due to
different sensors and sensor measurement scale can be avoided.
The objective of this chapter is to provide the reader with an overview of the theory of fiber-
optic DTS technology and a review of environmental applications to date, which will be
used to investigate the main heat transfer mechanisms occurring in different environments.
Important considerations, recent advances, and future trends are also discussed.
2. Fiber-optic distributed temperature sensing theory
Fiber-optic DTS technology uses Raman spectra scattering in an optical fiber to measure
temperature along its length, i.e., the fiber-optic cable is the thermometer, achieving
temperature resolutions as small as ±0.01 °C, and spatial and temporal resolutions of 1-2 m
and 1-60 s, respectively, for cables up to 10 km (Selker et al., 2006a). Raman scattering can
also be used to estimate temperatures in media other than optical fibers, such as
atmospheric LIDAR (Eichinger et al., 1993), but can only be used to measure atmospheric
temperatures and are far less widely used. To understand how fiber-optic DTS systems
work, we first present the background of Raman scattering, describing how this scattering
can be used to determine temperatures along the length of the optical fiber. Then, we
present the governing equations that DTS systems use.
To measure the temperature along an optical fiber, the DTS instrument emits laser pulses at
a known wavelength into an optical fiber. An optical fiber consists of a glass core
surrounded by a glass cladding with a different refractive index than the core (Fig. 1). As
light travels longitudinally along the fiber, a fraction of the incident light is scattered by
interactions between the light and the crystalline structure, and vibration frequency
(temperature) of the fiber itself (Hausner, 2010). Light scattering is classified as elastic or
inelastic. Elastic (or Rayleigh) scattering occurs when the kinetic energy of the incident
photons is conserved and thus, the frequency of the scattered photons is equal than that of
the incident light. On the other hand, when the kinetic energy of the incident photons is not
conserved, inelastic scattering occurs. As a result, the frequency of the incident and scattered
photons differs. In optical fibers, the inelastic scattering typically has two components:
Brillouin and Raman. The Brillouin scattering propagates as acoustic waves and is the result
of density shifts caused by interaction between pulsed and continuous light waves counter-
propagating in the optical fiber (Kurashima et al., 1990). Brillouin scattering occurs at a
predictable amplitude but variable frequency. The Raman scattering is produced by
interactions between the photons and vibrating molecules within the lattice of the glass
fiber. This interaction results in a predictable frequency shift. The scattered light shifted to
lower frequencies (longer wavelengths) than the incident light is termed Stokes, while the
Heat Transfer in the Environment:
Development and Use of Fiber-Optic Distributed Temperature Sensing
613
scattered light shifted to higher frequencies (shorter wavelengths) is called anti-Stokes. The
backscattered Stokes signal is produced when a photon excites a molecule at a base
vibrational state and the molecule returns to a slightly higher state (Fig. 2(b)). When the
incident photon hits a previously-excited molecule and this molecule returns to the base
state (Fig. 2(c)), the backscattered anti-Stokes signal is generated. The greater the
temperature of the fiber, the more frequently these previously-excited molecules will be
encountered (Smith & Dent, 2005).
Fig. 1. Internal refractions of light in a cross section of an optical fiber
Fig. 2. Interactions between light and glass structure (Smith & Dent, 2005)
Although the frequencies of the Raman signals are predictable, their intensities are not. The
intensity of the anti-Stokes scattering depends strongly on the temperature of the silica
molecules of the fiber, while the intensity of the Stokes backscattering depends weakly on
this temperature (Fig. 3). Because of this differential temperature dependence, the ratio of
the anti-Stokes and Stokes signals can be used to determine the temperature of the fiber at
the point of scattering (this is described below). The distance of the point of light scatter is
calculated by time-domain reflectometry using the speed of light in the glass fiber, which is
dependent on the frequency of the light and the index of refraction of the fiber itself. In
standard optical fibers, the speed of light ranges between 1.7x10
8
and 2.0x10
8
m s
-1
(Hausner,
2010). Commercial DTS instruments typically use a 10 or 20 ns laser pulse to illuminate the
optical fiber. After emitting the laser pulse, the backscattered signals begin to return to the
DTS instrument, where they are collected in discrete time periods by the detector unit.
Because the light in the fiber travels approximately 2 m in 10 ns, the signals that return to
the DTS instrument between the 0-10 ns following the injected pulse come from the first
meter of fiber. If the backscattering detection unit is set to 10 ns, the DTS instrument will
return temperature readings integrated over 1 m of fiber. The DTS instrument repeats the
pulse and data collection continuously for temporal integration periods as specified by the
user. A diagram of a typical DTS system is depicted in Fig. 4.